Click here for the BAT GCN circular template
Image
Pre-slew 15.0-350.0 keV image (Event data)
#   RAcent    DECcent   POSerr    Theta     Phi              Peak Cts       SNR   Name
  250.8658    31.7511   0.0064    30.1980     0.5788         1.7227268     30.222 TRIG_00621234

Foreground time interval of the image:
 -0.060  10.949 (delta_t =  11.009 [sec])
Background time interval of the image:
-239.152  -0.060 (delta_t = 239.092 [sec])
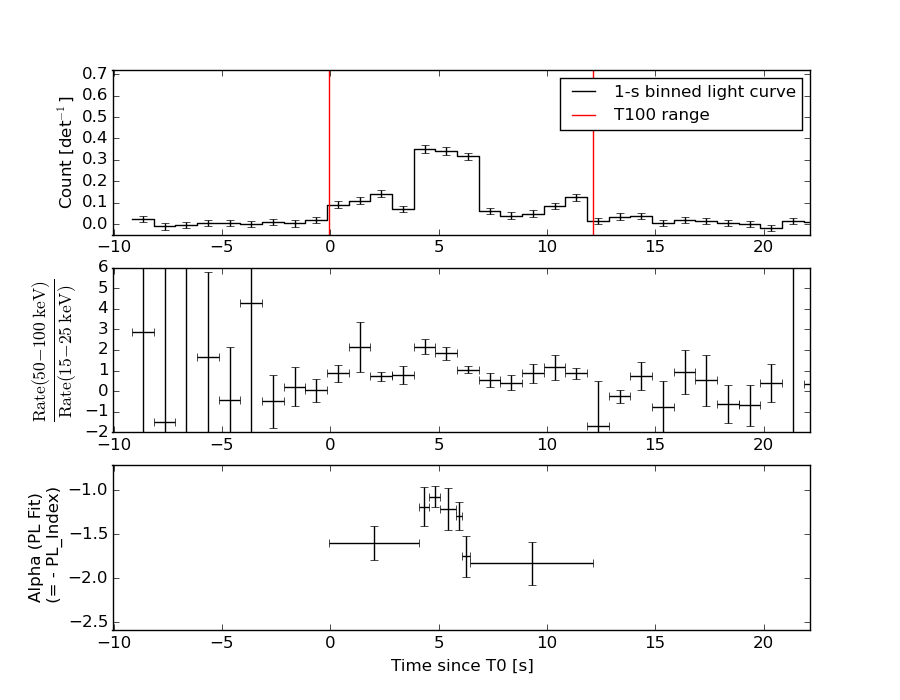
Lightcurves
Notes:
- 1) The mask-weighted light curves are using the flight position.
- 2) Multiple plots of different time binning/intervals are shown to cover all scenarios of short/long GRBs, rate/image triggers, and real/false positives.
- 3) For all the mask-weighted lightcurves, the y-axis units are counts/sec/det where a det is 0.4 x 0.4 = 0.16 sq cm.
- 4) The verticle lines correspond to following: green dotted lines are T50 interval, black dotted lines are T90 interval, blue solid line(s) is a spacecraft slew start time, and orange solid line(s) is a spacecraft slew end time.
- 5) Time of each bin is in the middle of the bin.
1 s binning
From T0-310 s to T0+310 s

From T100_start - 20 s to T100_end + 30 s

Full time interval
64 ms binning
Full time interval
From T100_start to T100_end
From T0-5 sec to T0+5 sec

16 ms binning
From T100_start-5 s to T100_start+5 s
Blue+Cyan dotted lines: Time interval of the scaled map
From 0.000000 to 1.024000
8 ms binning
From T100_start-3 s to T100_start+3 s
Blue+Cyan dotted lines: Time interval of the scaled map
From 0.000000 to 1.024000
2 ms binning
From T100_start-1 s to T100_start+1 s
Blue+Cyan dotted lines: Time interval of the scaled map
From 0.000000 to 1.024000
SN=5 or 10 sec. binning (whichever binning is satisfied first)
SN=5 or 10 sec. binning (T < 200 sec)
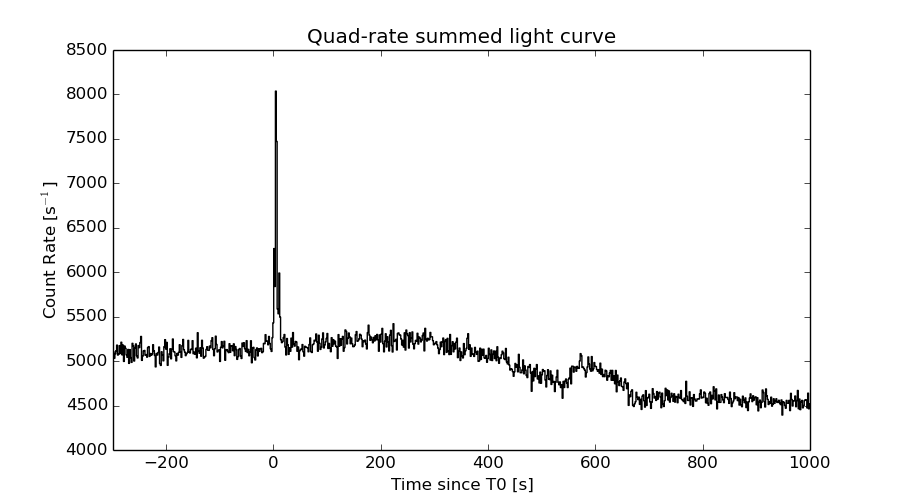
Quad-rate summed light curves (from T0-300s to T0+1000s)
Spectral Evolution
Spectra
Notes:
- 1) The fitting includes the systematic errors.
- 2) When the burst includes telescope slew time periods, the fitting uses an average response file made from multiple 5-s response files through out the slew time plus single time preiod for the non-slew times, and weighted by the total counts in the corresponding time period using addrmf. An average response file is needed becuase a spectral fit using the pre-slew DRM will introduce some errors in both a spectral shape and a normalization if the PHA file contains a lot of the slew/post-slew time interval.
- 3) For fits to more complicated models (e.g. a power-law over a cutoff power-law), the BAT team has decided to require a chi-square improvement of more than 6 for each extra dof.
Time averaged spectrum fit using the average DRM
Power-law model

Time interval is from   -0.060 sec. to   12.136 sec.

Spectral model in power-law:
------------------------------------------------------------
Parameters  : value       lower 90%   higher 90%
Photon index: 1.46017     ( -0.0887968   0.088904 )
Norm@50keV  : 1.01740E-02    ( -0.000521646   0.000521084 )
------------------------------------------------------------
#Fit statistic : Chi-Squared =          47.71 using 59 PHA bins.
# Reduced chi-squared =         0.8370 for     57 degrees of freedom
# Null hypothesis probability =   8.048811e-01

Photon flux (15-150 keV)    in 12.2 sec: 1.25700 ( -0.0662881  0.066388 ) ph/cm2/s
Energy fluence (15-150 keV)             : 1.18557e-06 ( -6.61321e-08  6.63885e-08 ) ergs/cm2
Cutoff power-law model

Time interval is from   -0.060 sec. to   12.136 sec.
Spectral model in the cutoff power-law:
------------------------------------------------------------
Parameters  : value       lower 90%   higher 90%
Photon index: 1.06450     ( -0.367803   0.339256 )
Epeak [keV] : 121.704      ( -35.9012 338.3 )
Norm@50keV  : 1.59367E-02    ( -0.00497418   0.00798733 )
------------------------------------------------------------
#Fit statistic : Chi-Squared =          43.67 using 59 PHA bins.
# Reduced chi-squared =         0.7799 for     56 degrees of freedom
# Null hypothesis probability =   8.846982e-01

Photon flux (15-150 keV)    in 12.2 sec: 1.23290 ( -0.06929  0.06932 ) ph/cm2/s
Energy fluence (15-150 keV)             : 1.15365e-06 ( -7.24058e-08  7.21862e-08 ) ergs/cm2
Band function

Time interval is from   -0.060 sec. to   12.136 sec.

Spectral model in the Band function:
------------------------------------------------------------
Parameters  : value       lower 90%   higher 90%
alpha       : -1.06449   ( -0.280938   0.430398 )
beta        : -10.0000    ( 10   1.06581e-14 )
Epeak [keV] : 121.684      ( -24.4704 340.368 )
Norm@50keV   : 1.59353E-02    ( -0.00497334   0.00798885 )
------------------------------------------------------------
#Fit statistic : Chi-Squared =          43.67 using 59 PHA bins.
# Reduced chi-squared =         0.7941 for     55 degrees of freedom
# Null hypothesis probability =   8.642484e-01

Photon flux (15-150 keV)    in 12.2 sec: 1.23265 (    ) ph/cm2/s
Energy fluence (15-150 keV)             : 1.15491e-06 ( 0  0 ) ergs/cm2
Single BB

Spectral model blackbody:
------------------------------------------------------------
Parameters  : value    Lower 90%  Upper 90%
kT [keV]    : 15.7820  (  )
R^2/D10^2   : 0.119343  (   )
(R is the radius in km and D10 is the distance to the source in units of 10 kpc)
------------------------------------------------------------
#Fit statistic : Chi-Squared =         122.74 using 59 PHA bins.
# Reduced chi-squared =         2.1533 for     57 degrees of freedom
# Null hypothesis probability =   1.014959e-06

Energy  Fluence     90% Error
[keV]   [erg/cm2]   [erg/cm2]
15- 25  7.521e-08   7.253e-09
25- 50  3.127e-07   2.190e-08
50-150  5.416e-07   5.435e-08
15-150  9.295e-07   6.100e-08
Thermal bremsstrahlung (OTTB)

Spectral model: thermal bremsstrahlung
------------------------------------------------------------
Parameters  : value         Lower 90%    Upper 90%
kT [keV]    : 200.000       (      )
Norm        : 5.16134       (-0.263674     0.26368)
------------------------------------------------------------
#Fit statistic : Chi-Squared =          47.47 using 59 PHA bins.
# Reduced chi-squared =         0.8328 for     57 degrees of freedom
# Null hypothesis probability =   8.117771e-01

Energy  Fluence     90% Error
[keV]   [erg/cm2]   [erg/cm2]
15- 25  1.575e-07   8.662e-09
25- 50  3.030e-07   1.879e-08
50-150  6.645e-07   4.343e-08
15-150  1.125e-06   1.419e-07
Double BB

Spectral model: bbodyrad<1> + bbodyrad<2>
------------------------------------------------------------
Parameters  : value         Lower 90%    Upper 90%
kT1 [keV]   : 7.63701        (-1.16418      1.28298)
R1^2/D10^2  : 0.934807        (-0.363121      0.679438)
kT2 [keV]   : 27.9481        (-4.29009      6.70933)
R2^2/D10^2  : 1.28725E-02    (-0.00677282   0.0108328)
------------------------------------------------------------
#Fit statistic : Chi-Squared =          40.08 using 59 PHA bins.
# Reduced chi-squared =         0.7287 for     55 degrees of freedom
# Null hypothesis probability =   9.346234e-01

Energy  Fluence     90% Error
[keV]   [erg/cm2]   [erg/cm2]
15- 25  1.360e-07   2.675e-08
25- 50  3.067e-07   5.063e-08
50-150  7.194e-07   1.825e-07
15-150  1.162e-06   2.200e-07
Peak spectrum fit
Power-law model

Time interval is from    4.100 sec. to    5.100 sec.

Spectral model in power-law:
------------------------------------------------------------
Parameters  : value       lower 90%   higher 90%
Photon index: 1.11354     ( -0.106849   0.105636 )
Norm@50keV  : 3.37020E-02    ( -0.00220365   0.00220299 )
------------------------------------------------------------
#Fit statistic : Chi-Squared =          60.17 using 59 PHA bins.
# Reduced chi-squared =          1.056 for     57 degrees of freedom
# Null hypothesis probability =   3.618685e-01

Photon flux (15-150 keV)    in 1 sec: 3.91449 ( -0.261937  0.262183 ) ph/cm2/s
Energy fluence (15-150 keV)             : 3.50854e-07 ( -2.50364e-08  2.51216e-08 ) ergs/cm2
Cutoff power-law model

Time interval is from    4.100 sec. to    5.100 sec.
Spectral model in the cutoff power-law:
------------------------------------------------------------
Parameters  : value       lower 90%   higher 90%
Photon index: 0.381130     ( -0.495822   0.443405 )
Epeak [keV] : 120.862      ( -28.672 97.1127 )
Norm@50keV  : 7.45241E-02    ( -0.0278329   0.050427 )
------------------------------------------------------------
#Fit statistic : Chi-Squared =          51.67 using 59 PHA bins.
# Reduced chi-squared =         0.9227 for     56 degrees of freedom
# Null hypothesis probability =   6.392181e-01

Photon flux (15-150 keV)    in 1 sec: 3.83003 ( -0.26746  0.26741 ) ph/cm2/s
Energy fluence (15-150 keV)             : 3.38775e-07 ( -2.6903e-08  2.6743e-08 ) ergs/cm2
Band function
Time interval is from    4.100 sec. to    5.100 sec.

Spectral model in the Band function:
------------------------------------------------------------
Parameters  : value       lower 90%   higher 90%
alpha       : 1.74444   ( -1.43051   -0.80277 )
beta        : -1.36572    ( 1.391   0.207769 )
Epeak [keV] : 46.7213      ( -21.5522 96.8863 )
Norm@50keV   : 1.84015    ( -1.79947   174.992 )
------------------------------------------------------------
#Fit statistic : Chi-Squared =          49.62 using 59 PHA bins.
# Reduced chi-squared =         0.9022 for     55 degrees of freedom
# Null hypothesis probability =   6.795673e-01

Photon flux (15-150 keV)    in 1 sec:  (    ) ph/cm2/s
Energy fluence (15-150 keV)             : 0 ( 0  0 ) ergs/cm2
Single BB
Spectral model blackbody:
------------------------------------------------------------
Parameters  : value    Lower 90%  Upper 90%
kT [keV]    : 19.4393  (-1.56326  1.74427)
R^2/D10^2   : 0.207898  (-0.051063   0.0659806)
(R is the radius in km and D10 is the distance to the source in units of 10 kpc)
------------------------------------------------------------
#Fit statistic : Chi-Squared =          78.48 using 59 PHA bins.
# Reduced chi-squared =          1.377 for     57 degrees of freedom
# Null hypothesis probability =   3.114016e-02

Energy  Fluence     90% Error
[keV]   [erg/cm2]   [erg/cm2]
15- 25  1.531e-08   1.995e-09
25- 50  7.483e-08   6.855e-09
50-150  2.087e-07   2.210e-08
15-150  2.988e-07   2.560e-08
Thermal bremsstrahlung (OTTB)
Spectral model: thermal bremsstrahlung
------------------------------------------------------------
Parameters  : value         Lower 90%    Upper 90%
kT [keV]    : 200.000       (      )
Norm        : 16.0270       (-1.08051     1.08043)
------------------------------------------------------------
#Fit statistic : Chi-Squared =         100.05 using 59 PHA bins.
# Reduced chi-squared =         1.7552 for     57 degrees of freedom
# Null hypothesis probability =   3.721102e-04

Energy  Fluence     90% Error
[keV]   [erg/cm2]   [erg/cm2]
15- 25  3.992e-08   2.950e-09
25- 50  7.678e-08   6.865e-09
50-150  1.684e-07   4.773e-08
15-150  2.851e-07   4.900e-08
Double BB

Spectral model: bbodyrad<1> + bbodyrad<2>
------------------------------------------------------------
Parameters  : value         Lower 90%    Upper 90%
kT1 [keV]   : 9.82318        (-2.49409      3.06841)
R1^2/D10^2  : 1.02248        (-0.492406      1.21562)
kT2 [keV]   : 32.5703        (-7.28323      21.8539)
R2^2/D10^2  : 2.97607E-02    (-0.0239451   0.0447201)
------------------------------------------------------------
#Fit statistic : Chi-Squared =          49.33 using 59 PHA bins.
# Reduced chi-squared =         0.8970 for     55 degrees of freedom
# Null hypothesis probability =   6.900059e-01

Energy  Fluence     90% Error
[keV]   [erg/cm2]   [erg/cm2]
15- 25  2.466e-08   8.649e-09
25- 50  7.827e-08   1.914e-08
50-150  2.398e-07   1.064e-07
15-150  3.427e-07   1.279e-07
Pre-slew spectrum (Pre-slew PHA with pre-slew DRM)
Power-law model

Spectral model in power-law:
------------------------------------------------------------
Parameters  : value       lower 90%   higher 90%
Photon index: 1.44715     ( -0.0909023   0.0909887 )
Norm@50keV  : 1.03678E-02    ( -0.000548718   0.000548147 )
------------------------------------------------------------
#Fit statistic : Chi-Squared =          41.17 using 59 PHA bins.
# Reduced chi-squared =         0.7222 for     57 degrees of freedom
# Null hypothesis probability =   9.433915e-01

Photon flux (15-150 keV)    in 11.01 sec: 1.27679 ( -0.0693722  0.0694711 ) ph/cm2/s
Energy fluence (15-150 keV)             : 1.0929e-06 ( -6.30156e-08  6.32747e-08 ) ergs/cm2
Cutoff power-law model

Spectral model in the cutoff power-law:
------------------------------------------------------------
Parameters  : value       lower 90%   higher 90%
Photon index: 0.987683     ( -0.386925   0.35478 )
Epeak [keV] : 113.227      ( -30.4007 185.959 )
Norm@50keV  : 1.74737E-02    ( -0.00567018   0.00930954 )
------------------------------------------------------------
#Fit statistic : Chi-Squared =          36.14 using 59 PHA bins.
# Reduced chi-squared =         0.6454 for     56 degrees of freedom
# Null hypothesis probability =   9.818867e-01

Photon flux (15-150 keV)    in 11.01 sec: 1.24937 ( -0.07241  0.07242 ) ph/cm2/s
Energy fluence (15-150 keV)             : 1.05896e-06 ( -6.90327e-08  6.88698e-08 ) ergs/cm2
Band function

Spectral model in the Band function:
------------------------------------------------------------
Parameters  : value       lower 90%   higher 90%
alpha       : -1.01698   ( -0.318197   0.369039 )
beta        : -9.17231    ( 9.3666   19.3666 )
Epeak [keV] : 119.926      ( -22.3792 54.2279 )
Norm@50keV   : 1.67522E-02    ( -0.0043857   0.00566252 )
------------------------------------------------------------
#Fit statistic : Chi-Squared =          36.19 using 59 PHA bins.
# Reduced chi-squared =         0.6580 for     55 degrees of freedom
# Null hypothesis probability =   9.764857e-01

Photon flux (15-150 keV)    in 11.01 sec: 1.25512 (    ) ph/cm2/s
Energy fluence (15-150 keV)             : 1.06535e-06 ( -1.06527e-06  -6.6311e-08 ) ergs/cm2
S(25-50 keV) vs. S(50-100 keV) plot

S(25-50 keV)  = 2.87e-07
S(50-100 keV) = 4.18e-07
T90 vs. Hardness ratio plot
T90                                   = 10.5079999566078 sec.
Hardness ratio (energy fluence ratio) = 1.45645
Color vs. Color plot

Count Ratio  (25-50 keV) / (15-25 keV) = 1.56751
Count Ratio (50-100 keV) / (15-25 keV) = 1.21795
Mask shadow pattern

IMX = 5.819381555698157E-01, IMY = -5.878992609027462E-03
TIME vs. PHA plot around the trigger time

Blue+Cyan dotted lines: Time interval of the scaled map
From 0.000000 to 1.024000
TIME vs. DetID plot around the trigger time

Blue+Cyan dotted lines: Time interval of the scaled map
From 0.000000 to 1.024000
100 us light curve (15-350 keV)
Blue+Cyan dotted lines: Time interval of the scaled map
From 0.000000 to 1.024000
Spacecraft aspect plot

Bright source in the pre-burst/pre-slew/post-slew images
Pre-burst image of 15-350 keV band
Time interval of the image:
-239.152000 -0.060000

# RAcent  DECcent POSerr Theta    Phi  PeakCts   SNR AngSep     Name
#  [deg]    [deg]    ['] [deg]  [deg]                   [']
254.6307  35.2927    8.0  28.5    9.6   0.4237   1.4    9.0	Her X-1
268.3209  -1.2611    7.7  25.2  -84.8   0.4625   1.5   11.8	SW J1753.5-0127
273.8621 -14.0258   28.1  35.0 -104.7   0.2551   0.4    8.4	GX 17+2
284.9583 -24.9897   11.5  45.1 -122.3   1.1020   1.0    5.9	HT1900.1-2455
288.7778  10.9414    0.7  11.2 -155.1   3.8527  16.2    1.2	GRS 1915+105
299.5942  35.2109    0.8  21.7  103.5   4.7932  15.1    0.6	Cyg X-1
308.1302  40.9800    3.9  30.5  102.4   1.3397   3.0    1.9	Cyg X-3
320.6448 -22.9007    2.8  57.2 -161.7   5.3887   4.1 ------	UNKNOWN
237.7604   7.6466    3.6  44.5  -38.3   1.6369   3.2 ------	UNKNOWN
226.9698   8.0451    2.6  54.5  -33.0   5.9790   4.4 ------	UNKNOWN
Pre-slew background subtracted image of 15-350 keV band
Time interval of the image:
-0.060000 10.948600

# RAcent  DECcent POSerr Theta    Phi  PeakCts   SNR AngSep     Name
#  [deg]    [deg]    ['] [deg]  [deg]                   [']
254.4243  35.4855   10.5  28.7    9.8  -0.0628  -1.1    8.7	Her X-1
268.1818  -1.5267    0.0  25.5  -84.8  -0.0272  -0.4   12.0	SW J1753.5-0127
273.9609 -14.1399    4.0  35.1 -104.9   0.2644   2.9    6.7	GX 17+2
284.8068 -24.9918  832.8  45.1 -122.1   0.0029   0.0   13.2	HT1900.1-2455
288.9787  10.9610  295.1  11.3 -156.0   0.0019   0.0   10.7	GRS 1915+105
299.4616  35.0940    4.5  21.5  103.5   0.1540   2.5    9.0	Cyg X-1
308.1136  41.1569    0.0  30.6  102.1  -0.0966  -1.0   12.3	Cyg X-3
250.8658  31.7511    0.4  30.2    0.6   1.7226  30.2 ------	UNKNOWN
304.5310  -1.9226    2.2  31.2 -166.2   0.3025   5.3 ------	UNKNOWN
233.8197  10.8775    2.2  47.2  -32.2   0.5467   5.2 ------	UNKNOWN
Post-slew image of 15-350 keV band
Time interval of the image:
68.948600 530.148600

# RAcent  DECcent POSerr Theta    Phi  PeakCts   SNR AngSep     Name
#  [deg]    [deg]    ['] [deg]  [deg]                   [']
254.2896  35.2427    4.9   4.5  138.2  -0.9142  -2.3   10.2	Her X-1
268.3563  -1.5193    7.8  37.2 -109.9   1.4031   1.5    4.1	SW J1753.5-0127
288.8056  10.9361    0.8  40.7 -147.9   9.0200  13.8    0.7	GRS 1915+105
299.5989  35.2045    0.9  40.4  171.3   8.9259  12.5    0.5	Cyg X-1
308.2103  40.8442    5.4  46.3  161.7   2.5666   2.2    7.9	Cyg X-3
205.5587  43.1477    4.7  37.2   40.9   2.0298   2.5 ------	UNKNOWN
193.1677  13.9313    3.6  55.4    5.2   7.6909   3.3 ------	UNKNOWN
244.6453  12.3018    2.8  20.3  -62.3   1.9184   4.2 ------	UNKNOWN
304.0283   7.3293    3.2  55.1 -155.7   5.5845   3.6 ------	UNKNOWN
259.2174  -8.3368    3.8  40.9  -92.8   6.7266   3.1 ------	UNKNOWN
Plot creation:
Thu May 28 13:53:31 EDT 2015