Click here for the BAT GCN circular template
Image
Pre-slew 15.0-350.0 keV image (Event data)

#   RAcent    DECcent   POSerr    Theta     Phi              Peak Cts       SNR   Name
  198.2827     8.1976   0.0067    26.1407    16.5987         3.5298217     28.714 TRIG_00622006

Foreground time interval of the image:
-24.112  16.397 (delta_t =  40.509 [sec])
Background time interval of the image:
-66.603 -24.112 (delta_t =  42.491 [sec])
Lightcurves
Notes:
- 1) The mask-weighted light curves are using the flight position.
- 2) Multiple plots of different time binning/intervals are shown to cover all scenarios of short/long GRBs, rate/image triggers, and real/false positives.
- 3) For all the mask-weighted lightcurves, the y-axis units are counts/sec/det where a det is 0.4 x 0.4 = 0.16 sq cm.
- 4) The verticle lines correspond to following: green dotted lines are T50 interval, black dotted lines are T90 interval, blue solid line(s) is a spacecraft slew start time, and orange solid line(s) is a spacecraft slew end time.
- 5) Time of each bin is in the middle of the bin.
1 s binning
From T0-310 s to T0+310 s
From T100_start - 20 s to T100_end + 30 s

Full time interval

64 ms binning
Full time interval
From T100_start to T100_end
From T0-5 sec to T0+5 sec

16 ms binning
From T100_start-5 s to T100_start+5 s
Blue+Cyan dotted lines: Time interval of the scaled map
From 0.000000 to 1.024000
8 ms binning
From T100_start-3 s to T100_start+3 s

Blue+Cyan dotted lines: Time interval of the scaled map
From 0.000000 to 1.024000
2 ms binning
From T100_start-1 s to T100_start+1 s

Blue+Cyan dotted lines: Time interval of the scaled map
From 0.000000 to 1.024000
SN=5 or 10 sec. binning (whichever binning is satisfied first)

SN=5 or 10 sec. binning (T < 200 sec)
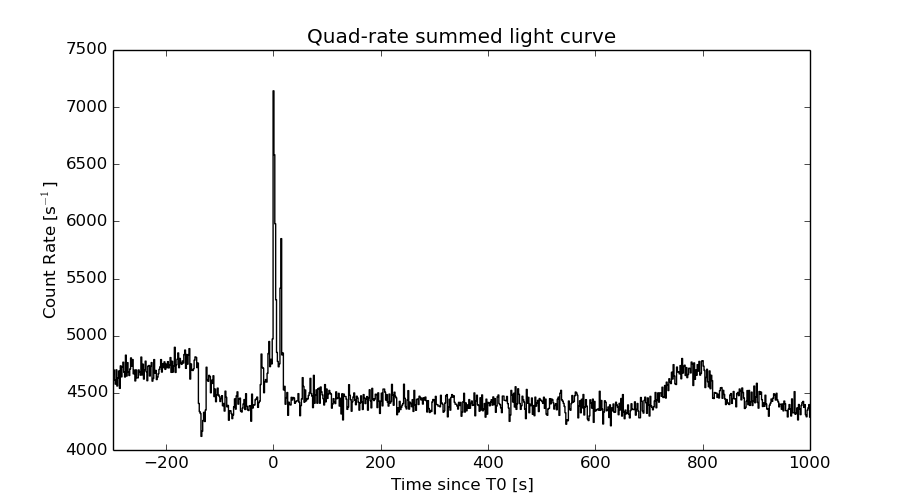
Quad-rate summed light curves (from T0-300s to T0+1000s)
Spectral Evolution

Spectra
Notes:
- 1) The fitting includes the systematic errors.
- 2) When the burst includes telescope slew time periods, the fitting uses an average response file made from multiple 5-s response files through out the slew time plus single time preiod for the non-slew times, and weighted by the total counts in the corresponding time period using addrmf. An average response file is needed becuase a spectral fit using the pre-slew DRM will introduce some errors in both a spectral shape and a normalization if the PHA file contains a lot of the slew/post-slew time interval.
- 3) For fits to more complicated models (e.g. a power-law over a cutoff power-law), the BAT team has decided to require a chi-square improvement of more than 6 for each extra dof.
Time averaged spectrum fit using the average DRM
Power-law model

Time interval is from  -24.112 sec. to   20.332 sec.

Spectral model in power-law:
------------------------------------------------------------
Parameters  : value       lower 90%   higher 90%
Photon index: 1.73620     ( -0.0833918   0.0842692 )
Norm@50keV  : 5.14748E-03    ( -0.000250348   0.000249051 )
------------------------------------------------------------
#Fit statistic : Chi-Squared =          73.00 using 59 PHA bins.
# Reduced chi-squared =          1.281 for     57 degrees of freedom
# Null hypothesis probability =   7.509017e-02

Photon flux (15-150 keV)    in 44.44 sec: 0.692519 ( -0.0324121  0.0324645 ) ph/cm2/s
Energy fluence (15-150 keV)             : 2.11256e-06 ( -1.06762e-07  1.07359e-07 ) ergs/cm2
Cutoff power-law model

Time interval is from  -24.112 sec. to   20.332 sec.
Spectral model in the cutoff power-law:
------------------------------------------------------------
Parameters  : value       lower 90%   higher 90%
Photon index: 1.25567     ( -0.384986   0.351711 )
Epeak [keV] : 72.8343      ( -14.4238 67.5774 )
Norm@50keV  : 9.20439E-03    ( -0.0031285   0.00536025 )
------------------------------------------------------------
#Fit statistic : Chi-Squared =          67.42 using 59 PHA bins.
# Reduced chi-squared =          1.204 for     56 degrees of freedom
# Null hypothesis probability =   1.411597e-01

Photon flux (15-150 keV)    in 44.44 sec: 0.673819 ( -0.035046  0.035025 ) ph/cm2/s
Energy fluence (15-150 keV)             : 2.01951e-06 ( -1.26121e-07  1.26538e-07 ) ergs/cm2
Band function

Time interval is from  -24.112 sec. to   20.332 sec.

Spectral model in the Band function:
------------------------------------------------------------
Parameters  : value       lower 90%   higher 90%
alpha       : -0.984335   ( -0.488504   0.990272 )
beta        : -2.06697    ( 2.06879   0.290726 )
Epeak [keV] : 57.9241      ( -32.9402 34.828 )
Norm@50keV   : 1.33946E-02    ( -0.00623435   126.004 )
------------------------------------------------------------
#Fit statistic : Chi-Squared =          65.44 using 59 PHA bins.
# Reduced chi-squared =          1.190 for     55 degrees of freedom
# Null hypothesis probability =   1.583116e-01

Photon flux (15-150 keV)    in 44.44 sec:  (    ) ph/cm2/s
Energy fluence (15-150 keV)             : 2.02252e-06 ( -2.02221e-06  -1.21255e-07 ) ergs/cm2
Single BB

Spectral model blackbody:
------------------------------------------------------------
Parameters  : value    Lower 90%  Upper 90%
kT [keV]    : 12.6513  (  )
R^2/D10^2   : 0.135351  (   )
(R is the radius in km and D10 is the distance to the source in units of 10 kpc)
------------------------------------------------------------
#Fit statistic : Chi-Squared =         149.49 using 59 PHA bins.
# Reduced chi-squared =         2.6226 for     57 degrees of freedom
# Null hypothesis probability =   3.146027e-10

Energy  Fluence     90% Error
[keV]   [erg/cm2]   [erg/cm2]
15- 25  2.042e-07   1.720e-08
25- 50  6.826e-07   3.555e-08
50-150  6.795e-07   7.377e-08
15-150  1.566e-06   7.777e-08
Thermal bremsstrahlung (OTTB)

Spectral model: thermal bremsstrahlung
------------------------------------------------------------
Parameters  : value         Lower 90%    Upper 90%
kT [keV]    : 111.814       (-18.2097      34.6354)
Norm        : 3.00881       (-0.204604     0.182689)
------------------------------------------------------------
#Fit statistic : Chi-Squared =          67.61 using 59 PHA bins.
# Reduced chi-squared =          1.186 for     57 degrees of freedom
# Null hypothesis probability =   1.588031e-01

Energy  Fluence     90% Error
[keV]   [erg/cm2]   [erg/cm2]
15- 25  3.491e-07   2.869e-08
25- 50  6.166e-07   3.666e-08
50-150  1.062e-06   2.971e-07
15-150  2.028e-06   3.140e-07
Double BB

Spectral model: bbodyrad<1> + bbodyrad<2>
------------------------------------------------------------
Parameters  : value         Lower 90%    Upper 90%
kT1 [keV]   : 6.85896        (-1.41165      1.70516)
R1^2/D10^2  : 0.821503        (-0.396632      0.954585)
kT2 [keV]   : 22.3845        (-4.28759      9.82093)
R2^2/D10^2  : 1.21073E-02    (-0.00889039   0.0163065)
------------------------------------------------------------
#Fit statistic : Chi-Squared =          72.33 using 59 PHA bins.
# Reduced chi-squared =          1.315 for     55 degrees of freedom
# Null hypothesis probability =   5.850651e-02

Energy  Fluence     90% Error
[keV]   [erg/cm2]   [erg/cm2]
15- 25  3.195e-07   5.211e-08
25- 50  6.198e-07   8.021e-08
50-150  1.045e-06   2.693e-07
15-150  1.984e-06   3.946e-07
Peak spectrum fit
Power-law model

Time interval is from   -0.096 sec. to    0.904 sec.

Spectral model in power-law:
------------------------------------------------------------
Parameters  : value       lower 90%   higher 90%
Photon index: 1.13067     ( -0.135538   0.133737 )
Norm@50keV  : 2.62627E-02    ( -0.00199174   0.00199132 )
------------------------------------------------------------
#Fit statistic : Chi-Squared =          63.12 using 59 PHA bins.
# Reduced chi-squared =          1.107 for     57 degrees of freedom
# Null hypothesis probability =   2.689130e-01

Photon flux (15-150 keV)    in 1 sec: 3.05599 ( -0.237548  0.237804 ) ph/cm2/s
Energy fluence (15-150 keV)             : 2.71958e-07 ( -2.30655e-08  2.31901e-08 ) ergs/cm2
Cutoff power-law model

Time interval is from   -0.096 sec. to    0.904 sec.
Spectral model in the cutoff power-law:
------------------------------------------------------------
Parameters  : value       lower 90%   higher 90%
Photon index: 1.08495     ( -0.532616   0.169177 )
Epeak [keV] : 997.895      ( -999.871 -999.871 )
Norm@50keV  : 2.77374E-02    ( -0.00317706   0.0210481 )
------------------------------------------------------------
#Fit statistic : Chi-Squared =          63.13 using 59 PHA bins.
# Reduced chi-squared =          1.127 for     56 degrees of freedom
# Null hypothesis probability =   2.390757e-01

Photon flux (15-150 keV)    in 1 sec: 3.05041 ( -0.2426  0.24233 ) ph/cm2/s
Energy fluence (15-150 keV)             : 2.71162e-07 ( -2.4508e-08  2.4e-08 ) ergs/cm2
Band function
Time interval is from   -0.096 sec. to    0.904 sec.

Spectral model in the Band function:
------------------------------------------------------------
Parameters  : value       lower 90%   higher 90%
alpha       : 0.180039   ( 0.428155   5.14478 )
beta        : -1.20960    ( 1.19653   0.178925 )
Epeak [keV] : 53.0998      ( -53.1323 222.376 )
Norm@50keV   : 0.186305    ( -0.195066   2437.01 )
------------------------------------------------------------
#Fit statistic : Chi-Squared =          62.14 using 59 PHA bins.
# Reduced chi-squared =          1.130 for     55 degrees of freedom
# Null hypothesis probability =   2.368260e-01

Photon flux (15-150 keV)    in 1 sec:  (    ) ph/cm2/s
Energy fluence (15-150 keV)             : 0 ( 0  0 ) ergs/cm2
Single BB

Spectral model blackbody:
------------------------------------------------------------
Parameters  : value    Lower 90%  Upper 90%
kT [keV]    : 18.8938  (-1.94186  2.26771)
R^2/D10^2   : 0.170398  (-0.0526368   0.0729369)
(R is the radius in km and D10 is the distance to the source in units of 10 kpc)
------------------------------------------------------------
#Fit statistic : Chi-Squared =          98.05 using 59 PHA bins.
# Reduced chi-squared =          1.720 for     57 degrees of freedom
# Null hypothesis probability =   5.926883e-04

Energy  Fluence     90% Error
[keV]   [erg/cm2]   [erg/cm2]
15- 25  1.198e-08   2.020e-09
25- 50  5.740e-08   7.000e-09
50-150  1.504e-07   1.940e-08
15-150  2.198e-07   2.160e-08
Thermal bremsstrahlung (OTTB)

Spectral model: thermal bremsstrahlung
------------------------------------------------------------
Parameters  : value         Lower 90%    Upper 90%
kT [keV]    : 200.000       (      )
Norm        : 12.5119       (-0.975992     0.975927)
------------------------------------------------------------
#Fit statistic : Chi-Squared =          89.39 using 59 PHA bins.
# Reduced chi-squared =          1.568 for     57 degrees of freedom
# Null hypothesis probability =   3.944244e-03

Energy  Fluence     90% Error
[keV]   [erg/cm2]   [erg/cm2]
15- 25  3.116e-08   3.155e-09
25- 50  5.994e-08   8.810e-09
50-150  1.315e-07   4.819e-08
15-150  2.226e-07   5.365e-08
Double BB

------------------------------------------------------------
Parameters  : value         Lower 90%    Upper 90%
kT1 [keV]   : 12.3667        (-3.12678      2.30592)
R1^2/D10^2  : 0.544046        (-0.232512      0.689315)
kT2 [keV]   : 199.509        (      )
R2^2/D10^2  : 4.94222E-04    (-0.00011776   0.0173245)
------------------------------------------------------------
#Fit statistic : Chi-Squared =          62.03 using 59 PHA bins.
#Fit statistic : Chi-Squared =          61.96 using 59 PHA bins.
# Reduced chi-squared =          1.128 for     55 degrees of freedom
# Reduced chi-squared =          1.126 for     55 degrees of freedom
# Null hypothesis probability =   2.398643e-01
# Null hypothesis probability =   2.419047e-01

Energy  Fluence     90% Error
[keV]   [erg/cm2]   [erg/cm2]
15- 25  1.891e-08   4.815e-09
25- 50  6.238e-08   1.736e-08
50-150  1.886e-07   1.327e-07
15-150  2.698e-07   1.657e-07
Pre-slew spectrum (Pre-slew PHA with pre-slew DRM)
Power-law model

Spectral model in power-law:
------------------------------------------------------------
Parameters  : value       lower 90%   higher 90%
Photon index: 1.69969     ( -0.0831124   0.0838737 )
Norm@50keV  : 5.45460E-03    ( -0.000261729   0.000260523 )
------------------------------------------------------------
#Fit statistic : Chi-Squared =          68.47 using 59 PHA bins.
# Reduced chi-squared =          1.201 for     57 degrees of freedom
# Null hypothesis probability =   1.420378e-01

Photon flux (15-150 keV)    in 40.51 sec: 0.724356 ( -0.0338817  0.033929 ) ph/cm2/s
Energy fluence (15-150 keV)             : 2.04593e-06 ( -1.03009e-07  1.03557e-07 ) ergs/cm2
Cutoff power-law model

Spectral model in the cutoff power-law:
------------------------------------------------------------
Parameters  : value       lower 90%   higher 90%
Photon index: 1.29582     ( -0.375632   0.343823 )
Epeak [keV] : 82.9623      ( -19.7805 170.896 )
Norm@50keV  : 8.85636E-03    ( -0.00293504   0.00494126 )
------------------------------------------------------------
#Fit statistic : Chi-Squared =          64.41 using 59 PHA bins.
# Reduced chi-squared =          1.150 for     56 degrees of freedom
# Null hypothesis probability =   2.059807e-01

Photon flux (15-150 keV)    in 40.51 sec: 0.707862 ( -0.036578  0.036537 ) ph/cm2/s
Energy fluence (15-150 keV)             : 1.97093e-06 ( -1.21485e-07  1.21465e-07 ) ergs/cm2
Band function

Spectral model in the Band function:
------------------------------------------------------------
Parameters  : value       lower 90%   higher 90%
alpha       : -0.999512   ( -0.508023   0.996602 )
beta        : -1.97670    ( 1.97627   0.267639 )
Epeak [keV] : 60.9496      ( -37.6517 55.6235 )
Norm@50keV   : 1.33165E-02    ( -0.00641721   251.254 )
------------------------------------------------------------
#Fit statistic : Chi-Squared =          62.35 using 59 PHA bins.
# Reduced chi-squared =          1.134 for     55 degrees of freedom
# Null hypothesis probability =   2.313134e-01

Photon flux (15-150 keV)    in 40.51 sec:  (    ) ph/cm2/s
Energy fluence (15-150 keV)             : 1.9707e-06 ( -1.97042e-06  -1.16786e-07 ) ergs/cm2
S(25-50 keV) vs. S(50-100 keV) plot
S(25-50 keV)  = 5.80e-07
S(50-100 keV) = 6.97e-07
T90 vs. Hardness ratio plot

T90                                   = 36.8159999847412 sec.
Hardness ratio (energy fluence ratio) = 1.20172
Color vs. Color plot

Count Ratio  (25-50 keV) / (15-25 keV) = 1.28981
Count Ratio (50-100 keV) / (15-25 keV) = 0.777686
Mask shadow pattern

IMX = 4.703254137966747E-01, IMY = -1.401982135373573E-01
TIME vs. PHA plot around the trigger time

Blue+Cyan dotted lines: Time interval of the scaled map
From 0.000000 to 1.024000
TIME vs. DetID plot around the trigger time

Blue+Cyan dotted lines: Time interval of the scaled map
From 0.000000 to 1.024000
100 us light curve (15-350 keV)

Blue+Cyan dotted lines: Time interval of the scaled map
From 0.000000 to 1.024000
Spacecraft aspect plot

Bright source in the pre-burst/pre-slew/post-slew images
Pre-burst image of 15-350 keV band
Time interval of the image:
-66.603390 -24.112000

# RAcent  DECcent POSerr Theta    Phi  PeakCts   SNR AngSep     Name
#  [deg]    [deg]    ['] [deg]  [deg]                   [']
254.3701  35.2671    6.6  31.8 -154.8   0.1631   1.8    6.2	Her X-1
185.8414 -15.0699    2.5  51.6    5.5   1.0511   4.5 ------	UNKNOWN
234.5494 -18.3945    2.3  45.7  -57.7   1.8838   5.0 ------	UNKNOWN
Pre-slew background subtracted image of 15-350 keV band
Time interval of the image:
-24.112000 16.396600

# RAcent  DECcent POSerr Theta    Phi  PeakCts   SNR AngSep     Name
#  [deg]    [deg]    ['] [deg]  [deg]                   [']
254.5156  35.5474    0.0  32.0 -155.2   0.2154   1.7   12.6	Her X-1
192.0431  46.0526    2.0  30.4  103.6   1.1430   5.6 ------	UNKNOWN
200.8048  52.9555    2.3  31.4  121.0   0.9856   5.0 ------	UNKNOWN
198.2827   8.1976    0.4  26.1   16.6   3.5299  28.7 ------	UNKNOWN
230.4463 -18.4867    2.2  44.7  -52.4   1.8756   5.2 ------	UNKNOWN
Post-slew image of 15-350 keV band
Time interval of the image:
63.596600 645.396610

# RAcent  DECcent POSerr Theta    Phi  PeakCts   SNR AngSep     Name
#  [deg]    [deg]    ['] [deg]  [deg]                   [']
254.4906  35.3580    8.3  57.9 -153.4   4.2442   1.4    1.9	Her X-1
232.6970  55.0447    4.1  54.2  177.0   5.3318   2.8 ------	UNKNOWN
196.0271   0.3009    3.4   8.2  -10.5   1.6334   3.5 ------	UNKNOWN
220.9423  20.5538    2.8  25.1 -148.4   2.0201   4.1 ------	UNKNOWN
251.3387  46.0373    2.7  59.0 -166.1  13.1148   4.3 ------	UNKNOWN
253.6401  38.2412    3.7  58.0 -156.8   9.9217   3.2 ------	UNKNOWN
197.4255 -50.5353    5.2  58.7  -25.9   7.2810   2.2 ------	UNKNOWN
209.2816 -45.2009    2.6  54.3  -36.0  12.7612   4.5 ------	UNKNOWN
244.1125   9.2356    3.7  45.3 -121.4   5.8572   3.1 ------	UNKNOWN
246.8965  14.8077    3.5  48.0 -129.1   8.1050   3.3 ------	UNKNOWN
Plot creation:
Thu May 28 13:49:41 EDT 2015