Click here for the BAT GCN circular template
Image
Pre-slew 15.0-350.0 keV image (Event data)
#   RAcent    DECcent   POSerr    Theta     Phi              Peak Cts       SNR   Name
  131.6746   -48.8959   0.0176    20.0977    65.9568         1.4338336     10.954 TRIG_00623368

Foreground time interval of the image:
  6.056  64.680 (delta_t =  58.624 [sec])
Background time interval of the image:
-239.000   6.056 (delta_t = 245.056 [sec])
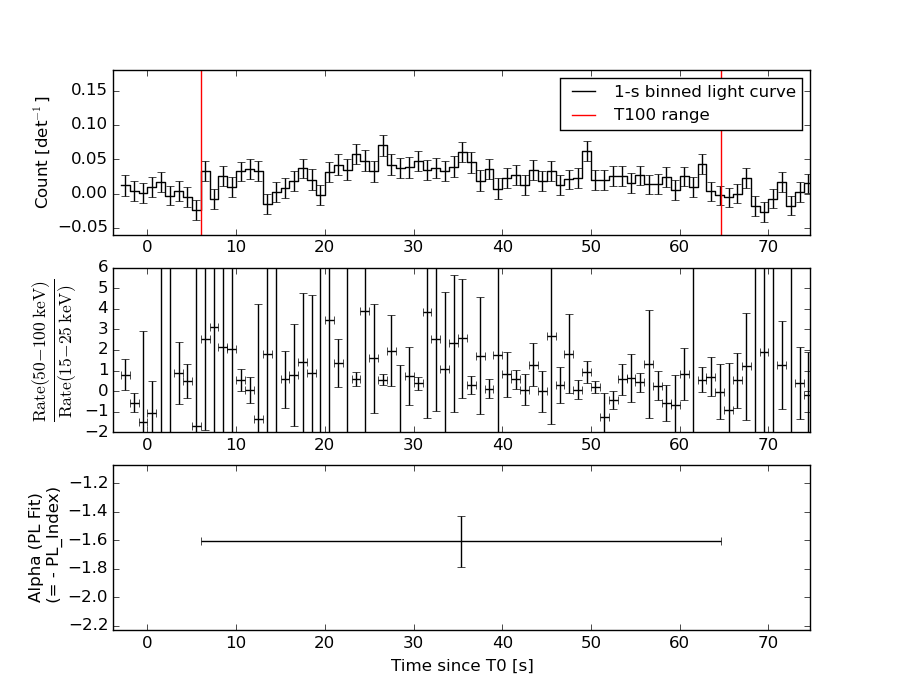
Lightcurves
Notes:
- 1) The mask-weighted light curves are using the flight position.
- 2) Multiple plots of different time binning/intervals are shown to cover all scenarios of short/long GRBs, rate/image triggers, and real/false positives.
- 3) For all the mask-weighted lightcurves, the y-axis units are counts/sec/det where a det is 0.4 x 0.4 = 0.16 sq cm.
- 4) The verticle lines correspond to following: green dotted lines are T50 interval, black dotted lines are T90 interval, blue solid line(s) is a spacecraft slew start time, and orange solid line(s) is a spacecraft slew end time.
- 5) Time of each bin is in the middle of the bin.
1 s binning
From T0-310 s to T0+310 s

From T100_start - 20 s to T100_end + 30 s

Full time interval
64 ms binning
Full time interval
From T100_start to T100_end

From T0-5 sec to T0+5 sec
16 ms binning
From T100_start-5 s to T100_start+5 s
8 ms binning
From T100_start-3 s to T100_start+3 s
2 ms binning
From T100_start-1 s to T100_start+1 s
SN=5 or 10 sec. binning (whichever binning is satisfied first)
SN=5 or 10 sec. binning (T < 200 sec)

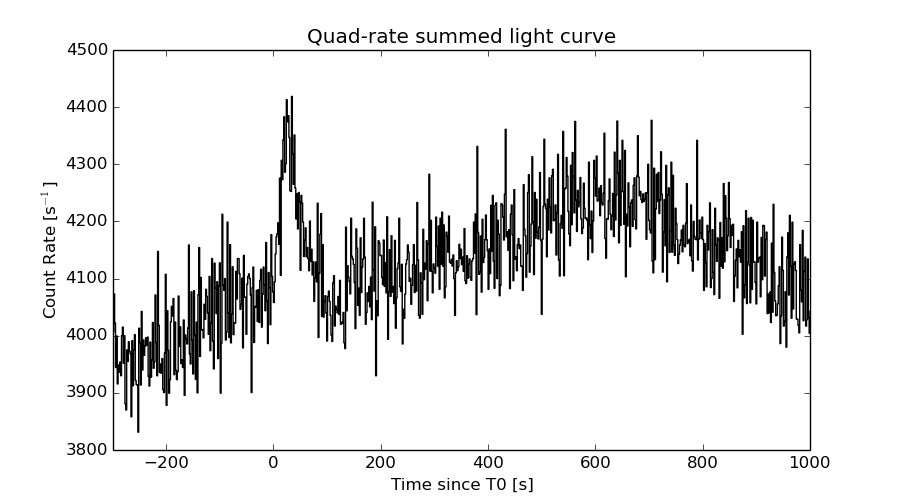
Quad-rate summed light curves (from T0-300s to T0+1000s)
Spectral Evolution
Spectra
Notes:
- 1) The fitting includes the systematic errors.
- 2) When the burst includes telescope slew time periods, the fitting uses an average response file made from multiple 5-s response files through out the slew time plus single time preiod for the non-slew times, and weighted by the total counts in the corresponding time period using addrmf. An average response file is needed becuase a spectral fit using the pre-slew DRM will introduce some errors in both a spectral shape and a normalization if the PHA file contains a lot of the slew/post-slew time interval.
- 3) For fits to more complicated models (e.g. a power-law over a cutoff power-law), the BAT team has decided to require a chi-square improvement of more than 6 for each extra dof.
Time averaged spectrum fit using the average DRM
Power-law model

Time interval is from    6.056 sec. to   64.680 sec.

Spectral model in power-law:
------------------------------------------------------------
Parameters  : value       lower 90%   higher 90%
Photon index: 1.60502     ( -0.175265   0.178122 )
Norm@50keV  : 1.73961E-03    ( -0.000205705   0.000204003 )
------------------------------------------------------------
#Fit statistic : Chi-Squared =          66.37 using 59 PHA bins.
# Reduced chi-squared =          1.164 for     57 degrees of freedom
# Null hypothesis probability =   1.853684e-01

Photon flux (15-150 keV)    in 58.62 sec: 0.223895 ( -0.0247396  0.0247536 ) ph/cm2/s
Energy fluence (15-150 keV)             : 9.53161e-07 ( -1.19817e-07  1.21707e-07 ) ergs/cm2
Cutoff power-law model

Time interval is from    6.056 sec. to   64.680 sec.
Spectral model in the cutoff power-law:
------------------------------------------------------------
Parameters  : value       lower 90%   higher 90%
Photon index: -3.24808E-02     ( -1.12314   0.890548 )
Epeak [keV] : 54.2378      ( -8.44761 17.2256 )
Norm@50keV  : 1.42550E-02    ( -0.0142558   0.0465513 )
------------------------------------------------------------
#Fit statistic : Chi-Squared =          54.69 using 59 PHA bins.
# Reduced chi-squared =         0.9766 for     56 degrees of freedom
# Null hypothesis probability =   5.246134e-01

Photon flux (15-150 keV)    in 58.62 sec: 0.212997 ( -0.025137  0.025245 ) ph/cm2/s
Energy fluence (15-150 keV)             : 8.25076e-07 ( -1.22416e-07  1.32581e-07 ) ergs/cm2
Band function
Time interval is from    6.056 sec. to   64.680 sec.

Spectral model in the Band function:
------------------------------------------------------------
Parameters  : value       lower 90%   higher 90%
alpha       : 3.25035E-02   ( -0.779187   1.03803 )
beta        : -10.0000    ( 10   1.95399e-14 )
Epeak [keV] : 54.2271      ( -7.92225 17.2464 )
Norm@50keV   : 1.42577E-02    ( -0.0142577   0.0466401 )
------------------------------------------------------------
#Fit statistic : Chi-Squared =          54.69 using 59 PHA bins.
# Reduced chi-squared =         0.9943 for     55 degrees of freedom
# Null hypothesis probability =   4.864970e-01

Photon flux (15-150 keV)    in 58.62 sec: 0.212988 (    ) ph/cm2/s
Energy fluence (15-150 keV)             : 8.50266e-07 ( 0  0 ) ergs/cm2
Single BB

Spectral model blackbody:
------------------------------------------------------------
Parameters  : value    Lower 90%  Upper 90%
kT [keV]    : 12.4316  (-1.38928  1.60156)
R^2/D10^2   : 5.13588E-02  (-0.0184746   0.0278836)
(R is the radius in km and D10 is the distance to the source in units of 10 kpc)
------------------------------------------------------------
#Fit statistic : Chi-Squared =          59.46 using 59 PHA bins.
# Reduced chi-squared =          1.043 for     57 degrees of freedom
# Null hypothesis probability =   3.860314e-01

Energy  Fluence     90% Error
[keV]   [erg/cm2]   [erg/cm2]
15- 25  9.862e-08   2.040e-08
25- 50  3.233e-07   4.751e-08
50-150  3.074e-07   7.407e-08
15-150  7.294e-07   1.052e-07
Thermal bremsstrahlung (OTTB)

Spectral model: thermal bremsstrahlung
------------------------------------------------------------
Parameters  : value         Lower 90%    Upper 90%
kT [keV]    : 140.253       (-50.7514      -138.766)
Norm        : 0.943556       (-0.114463     0.139846)
------------------------------------------------------------
#Fit statistic : Chi-Squared =          61.08 using 59 PHA bins.
# Reduced chi-squared =          1.072 for     57 degrees of freedom
# Null hypothesis probability =   3.315368e-01

Energy  Fluence     90% Error
[keV]   [erg/cm2]   [erg/cm2]
15- 25  1.428e-07   4.326e-08
25- 50  2.621e-07   1.102e-07
50-150  5.027e-07   2.933e-07
15-150  9.076e-07   3.653e-07
Double BB

Spectral model: bbodyrad<1> + bbodyrad<2>
------------------------------------------------------------
Parameters  : value         Lower 90%    Upper 90%
kT1 [keV]   : 8.10916        (-3.3198      3.54469)
R1^2/D10^2  : 0.140777        (-0.0828494      0.401965)
kT2 [keV]   : 20.2179        (-11.6247      68.3366)
R2^2/D10^2  : 5.39968E-03    (-0.00535894   0.017024)
------------------------------------------------------------
#Fit statistic : Chi-Squared =          53.38 using 59 PHA bins.
# Reduced chi-squared =         0.9706 for     55 degrees of freedom
# Null hypothesis probability =   5.366695e-01

Energy  Fluence     90% Error
[keV]   [erg/cm2]   [erg/cm2]
15- 25  1.239e-07   6.988e-08
25- 50  3.022e-07   1.682e-07
50-150  4.268e-07   2.244e-07
15-150  8.529e-07   4.273e-07
Peak spectrum fit
Power-law model

Time interval is from   26.324 sec. to   27.324 sec.

Spectral model in power-law:
------------------------------------------------------------
Parameters  : value       lower 90%   higher 90%
Photon index: 2.14673     ( -0.548754   0.668697 )
Norm@50keV  : 3.17762E-03    ( -0.00153036   0.00152652 )
------------------------------------------------------------
#Fit statistic : Chi-Squared =          50.87 using 59 PHA bins.
# Reduced chi-squared =         0.8924 for     57 degrees of freedom
# Null hypothesis probability =   7.031567e-01

Photon flux (15-150 keV)    in 1 sec: 0.511527 ( -0.186906  0.187454 ) ph/cm2/s
Energy fluence (15-150 keV)             : 2.95712e-08 ( -1.24752e-08  1.36072e-08 ) ergs/cm2
Cutoff power-law model

Time interval is from   26.324 sec. to   27.324 sec.
Spectral model in the cutoff power-law:
------------------------------------------------------------
Parameters  : value       lower 90%   higher 90%
Photon index: -1.15450     ( 1.19587   2.8009 )
Epeak [keV] : 34.9768      ( -11.1789 15.7411 )
Norm@50keV  : 0.379899    ( -0.444962   1.27105e+06 )
------------------------------------------------------------
#Fit statistic : Chi-Squared =          46.49 using 59 PHA bins.
# Reduced chi-squared =         0.8301 for     56 degrees of freedom
# Null hypothesis probability =   8.136693e-01

Photon flux (15-150 keV)    in 1 sec: 0.519839 ( -0.177864  0.179861 ) ph/cm2/s
Energy fluence (15-150 keV)             : 2.62405e-08 ( -1.01797e-08  1.16544e-08 ) ergs/cm2
Band function
Time interval is from   26.324 sec. to   27.324 sec.

Spectral model in the Band function:
------------------------------------------------------------
Parameters  : value       lower 90%   higher 90%
alpha       : 5.00000   ( -6.48742   -5 )
beta        : -3.33010    ( 3.3305   1.17066 )
Epeak [keV] : 28.6440      ( -7.75897 8.23413 )
Norm@50keV   : 311.860    ( -102.81   1982.44 )
------------------------------------------------------------
#Fit statistic : Chi-Squared =          46.25 using 59 PHA bins.
# Reduced chi-squared =         0.8410 for     55 degrees of freedom
# Null hypothesis probability =   7.933987e-01

Photon flux (15-150 keV)    in 1 sec: 0.527277 ( 6.47272  -0.186707 ) ph/cm2/s
Energy fluence (15-150 keV)             : 2.71908e-08 ( 0  0 ) ergs/cm2
Single BB
Spectral model blackbody:
------------------------------------------------------------
Parameters  : value    Lower 90%  Upper 90%
kT [keV]    : 8.94357  (-2.51173  3.38109)
R^2/D10^2   : 0.429569  (-0.429569   1.09646)
(R is the radius in km and D10 is the distance to the source in units of 10 kpc)
------------------------------------------------------------
#Fit statistic : Chi-Squared =          46.54 using 59 PHA bins.
# Reduced chi-squared =         0.8164 for     57 degrees of freedom
# Null hypothesis probability =   8.373854e-01

Energy  Fluence     90% Error
[keV]   [erg/cm2]   [erg/cm2]
15- 25  6.668e-09   4.168e-09
25- 50  1.403e-08   8.500e-09
50-150  5.251e-09   3.889e-09
15-150  2.595e-08   1.594e-08
Thermal bremsstrahlung (OTTB)
Spectral model: thermal bremsstrahlung
------------------------------------------------------------
Parameters  : value         Lower 90%    Upper 90%
kT [keV]    : 44.5524       (-23.0795      71.3955)
Norm        : 3.29457       (-1.44839     2.43682)
------------------------------------------------------------
#Fit statistic : Chi-Squared =          48.60 using 59 PHA bins.
# Reduced chi-squared =         0.8527 for     57 degrees of freedom
# Null hypothesis probability =   7.779613e-01

Energy  Fluence     90% Error
[keV]   [erg/cm2]   [erg/cm2]
15- 25  7.822e-09   4.923e-09
25- 50  1.076e-08   6.685e-09
50-150  9.327e-09   7.975e-09
15-150  2.791e-08   1.899e-08
Double BB

Spectral model: bbodyrad<1> + bbodyrad<2>
------------------------------------------------------------
Parameters  : value         Lower 90%    Upper 90%
kT1 [keV]   : 6.48284        (-6.54597      -6.54597)
R1^2/D10^2  : 0.483318        (-0.506546      -0.506546)
kT2 [keV]   : 10.2667        (-10.4545      189.521)
R2^2/D10^2  : 0.179902    (-0.156261   -0.156261)
------------------------------------------------------------
#Fit statistic : Chi-Squared =          46.47 using 59 PHA bins.
# Reduced chi-squared =         0.8448 for     55 degrees of freedom
# Null hypothesis probability =   7.868759e-01

Energy  Fluence     90% Error
[keV]   [erg/cm2]   [erg/cm2]
15- 25  6.887e-09   3.696e-07
25- 50  1.356e-08   3.668e-06
50-150  6.093e-09   3.381e-05
15-150  2.654e-08   3.360e-05
Pre-slew spectrum (Pre-slew PHA with pre-slew DRM)
Power-law model
Spectral model in power-law:
------------------------------------------------------------
Parameters  : value       lower 90%   higher 90%
Photon index: 1.60502     ( -0.175265   0.178122 )
Norm@50keV  : 1.73961E-03    ( -0.000205705   0.000204003 )
------------------------------------------------------------
#Fit statistic : Chi-Squared =          66.37 using 59 PHA bins.
# Reduced chi-squared =          1.164 for     57 degrees of freedom
# Null hypothesis probability =   1.853684e-01

Photon flux (15-150 keV)    in 58.62 sec: 0.223895 ( -0.0247396  0.0247536 ) ph/cm2/s
Energy fluence (15-150 keV)             : 9.53161e-07 ( -1.19817e-07  1.21707e-07 ) ergs/cm2
Cutoff power-law model

Spectral model in the cutoff power-law:
------------------------------------------------------------
Parameters  : value       lower 90%   higher 90%
Photon index: -3.24808E-02     ( -1.12314   0.890548 )
Epeak [keV] : 54.2378      ( -8.44761 17.2256 )
Norm@50keV  : 1.42550E-02    ( -0.0142558   0.0465513 )
------------------------------------------------------------
#Fit statistic : Chi-Squared =          54.69 using 59 PHA bins.
# Reduced chi-squared =         0.9766 for     56 degrees of freedom
# Null hypothesis probability =   5.246134e-01

Photon flux (15-150 keV)    in 58.62 sec: 0.212997 ( -0.025137  0.025245 ) ph/cm2/s
Energy fluence (15-150 keV)             : 8.25076e-07 ( -1.22416e-07  1.32581e-07 ) ergs/cm2
Band function

Spectral model in the Band function:
------------------------------------------------------------
Parameters  : value       lower 90%   higher 90%
alpha       : 3.25035E-02   ( -0.779187   1.03803 )
beta        : -10.0000    ( 10   4.9738e-14 )
Epeak [keV] : 54.2271      ( -7.92225 17.2464 )
Norm@50keV   : 1.42577E-02    ( -0.0142577   0.0466401 )
------------------------------------------------------------
#Fit statistic : Chi-Squared =          54.69 using 59 PHA bins.
# Reduced chi-squared =         0.9943 for     55 degrees of freedom
# Null hypothesis probability =   4.864970e-01

Photon flux (15-150 keV)    in 58.62 sec: 0.212988 (    ) ph/cm2/s
Energy fluence (15-150 keV)             : 8.50266e-07 ( 0  0 ) ergs/cm2
S(25-50 keV) vs. S(50-100 keV) plot
S(25-50 keV)  = 2.48e-07
S(50-100 keV) = 3.26e-07
T90 vs. Hardness ratio plot
T90                                   = 49.0879999995232 sec.
Hardness ratio (energy fluence ratio) = 1.31452
Color vs. Color plot
Count Ratio  (25-50 keV) / (15-25 keV) = 1.62489
Count Ratio (50-100 keV) / (15-25 keV) = 1.0103
Mask shadow pattern
IMX = 1.490781412126486E-01, IMY = -3.341563400959436E-01
TIME vs. PHA plot around the trigger time
TIME vs. DetID plot around the trigger time
100 us light curve (15-350 keV)
Spacecraft aspect plot

Bright source in the pre-burst/pre-slew/post-slew images
Pre-burst image of 15-350 keV band
Time interval of the image:
-239.000000 6.056000

# RAcent  DECcent POSerr Theta    Phi  PeakCts   SNR AngSep     Name
#  [deg]    [deg]    ['] [deg]  [deg]                   [']
135.4557 -40.7513    0.0  24.8   84.9   0.6168   1.7   12.3	Vela X-1
170.2589 -60.6566    1.5   4.6 -116.7   1.9247   7.9    2.6	Cen X-3
186.5106 -62.7968    2.0  12.5 -107.8   1.3545   5.9    4.3	GX 301-2
171.0256  -9.6052    2.4  50.6  149.3   6.2049   4.8 ------	UNKNOWN
169.6193 -17.1487    2.7  42.9  148.6   2.6864   4.3 ------	UNKNOWN
178.3621 -13.3757    2.7  48.0  159.4   3.2106   4.2 ------	UNKNOWN
 35.6032 -57.7234    2.2  55.1  -11.3   3.8517   5.2 ------	UNKNOWN
323.1878 -71.8634    2.2  47.9  -50.7   5.5100   5.2 ------	UNKNOWN
Pre-slew background subtracted image of 15-350 keV band
Time interval of the image:
6.056000 64.680000

# RAcent  DECcent POSerr Theta    Phi  PeakCts   SNR AngSep     Name
#  [deg]    [deg]    ['] [deg]  [deg]                   [']
135.6317 -40.4061    5.6  25.0   85.6  -0.3284  -2.1   10.1	Vela X-1
170.3524 -60.4522    6.4   4.6 -119.4   0.1902   1.8   10.3	Cen X-3
186.7299 -62.7751    3.3  12.6 -108.0  -0.3634  -3.5    2.0	GX 301-2
 90.9759 -47.9042    2.7  41.0   30.9   0.8740   4.3 ------	UNKNOWN
131.6747 -48.8959    1.1  20.1   66.0   1.4338  11.0 ------	UNKNOWN
170.9116 -41.0083    2.7  19.6  159.0   0.4150   4.3 ------	UNKNOWN
 40.9499 -80.1244    2.7  36.2  -28.7   0.5551   4.3 ------	UNKNOWN
214.9057 -36.1717    2.6  41.3 -143.2   0.7777   4.4 ------	UNKNOWN
222.5152 -61.7894    2.0  28.9 -102.2   0.7915   5.7 ------	UNKNOWN
242.4844 -54.6694    2.1  41.5 -102.7   2.2884   5.5 ------	UNKNOWN
Post-slew image of 15-350 keV band
Time interval of the image:
114.900600 963.014200

# RAcent  DECcent POSerr Theta    Phi  PeakCts   SNR AngSep     Name
#  [deg]    [deg]    ['] [deg]  [deg]                   [']
135.3294 -40.5895   10.5   8.7  134.9   0.6917   1.1    9.3	Vela X-1
170.3374 -60.6165    1.5  24.7 -111.1   5.7401   7.7    0.7	Cen X-3
186.7635 -62.6661    4.2  32.6 -108.2   2.9722   2.8    6.9	GX 301-2
 50.1470 -40.5634    3.8  55.7    1.6   9.7065   3.0 ------	UNKNOWN
 44.2272 -42.3414    3.5  58.0   -3.3  13.8634   3.3 ------	UNKNOWN
149.6663 -48.2358    3.6  11.9 -150.3   1.8101   3.2 ------	UNKNOWN
128.3648 -62.1663    2.3  13.4  -57.2   3.0303   5.0 ------	UNKNOWN
 24.0355 -56.5301    4.6  58.7  -25.9  11.2422   2.6 ------	UNKNOWN
Plot creation:
Thu May 28 13:44:25 EDT 2015