Click here for the BAT GCN circular template
Image
Pre-slew 15.0-350.0 keV image (Event data)
#   RAcent    DECcent   POSerr    Theta     Phi              Peak Cts       SNR   Name
  289.3734    32.5282   0.0085    13.0251    25.8165         0.9308752     22.695 TRIG_00624606

Foreground time interval of the image:
 -7.940   3.772 (delta_t =  11.712 [sec])
Background time interval of the image:
-239.072  -7.940 (delta_t = 231.132 [sec])
Lightcurves
Notes:
- 1) The mask-weighted light curves are using the flight position.
- 2) Multiple plots of different time binning/intervals are shown to cover all scenarios of short/long GRBs, rate/image triggers, and real/false positives.
- 3) For all the mask-weighted lightcurves, the y-axis units are counts/sec/det where a det is 0.4 x 0.4 = 0.16 sq cm.
- 4) The verticle lines correspond to following: green dotted lines are T50 interval, black dotted lines are T90 interval, blue solid line(s) is a spacecraft slew start time, and orange solid line(s) is a spacecraft slew end time.
- 5) Time of each bin is in the middle of the bin.
1 s binning
From T0-310 s to T0+310 s
From T100_start - 20 s to T100_end + 30 s

Full time interval
64 ms binning
Full time interval
From T100_start to T100_end

From T0-5 sec to T0+5 sec
16 ms binning
From T100_start-5 s to T100_start+5 s

Blue+Cyan dotted lines: Time interval of the scaled map
From 0.000000 to 1.024000
8 ms binning
From T100_start-3 s to T100_start+3 s

Blue+Cyan dotted lines: Time interval of the scaled map
From 0.000000 to 1.024000
2 ms binning
From T100_start-1 s to T100_start+1 s

Blue+Cyan dotted lines: Time interval of the scaled map
From 0.000000 to 1.024000
SN=5 or 10 sec. binning (whichever binning is satisfied first)

SN=5 or 10 sec. binning (T < 200 sec)
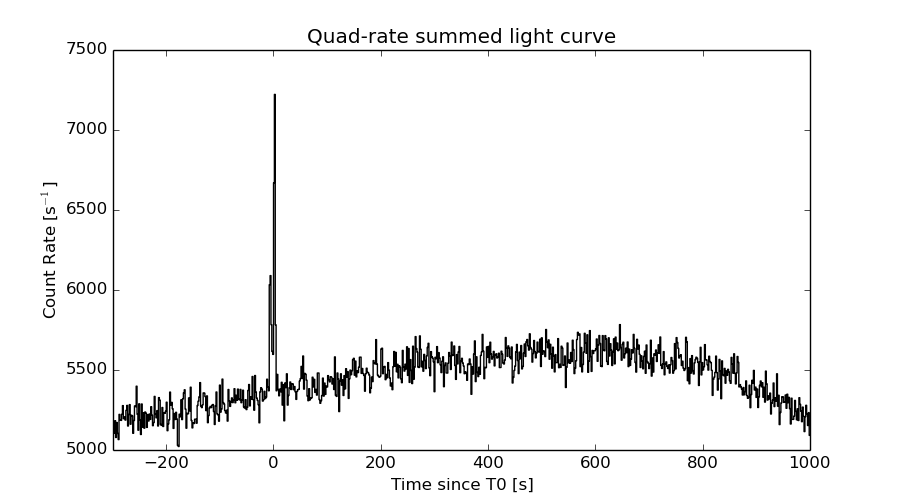
Quad-rate summed light curves (from T0-300s to T0+1000s)
Spectral Evolution

Spectra
Notes:
- 1) The fitting includes the systematic errors.
- 2) When the burst includes telescope slew time periods, the fitting uses an average response file made from multiple 5-s response files through out the slew time plus single time preiod for the non-slew times, and weighted by the total counts in the corresponding time period using addrmf. An average response file is needed becuase a spectral fit using the pre-slew DRM will introduce some errors in both a spectral shape and a normalization if the PHA file contains a lot of the slew/post-slew time interval.
- 3) For fits to more complicated models (e.g. a power-law over a cutoff power-law), the BAT team has decided to require a chi-square improvement of more than 6 for each extra dof.
Time averaged spectrum fit using the average DRM
Power-law model

Time interval is from   -7.940 sec. to    3.772 sec.

Spectral model in power-law:
------------------------------------------------------------
Parameters  : value       lower 90%   higher 90%
Photon index: 1.88697     ( -0.131264   0.135232 )
Norm@50keV  : 4.56756E-03    ( -0.000388535   0.000383116 )
------------------------------------------------------------
#Fit statistic : Chi-Squared =          49.71 using 59 PHA bins.
# Reduced chi-squared =         0.8722 for     57 degrees of freedom
# Null hypothesis probability =   7.424069e-01

Photon flux (15-150 keV)    in 11.71 sec: 0.651896 ( -0.046872  0.0468991 ) ph/cm2/s
Energy fluence (15-150 keV)             : 4.91698e-07 ( -4.11405e-08  4.16705e-08 ) ergs/cm2
Cutoff power-law model
Time interval is from   -7.940 sec. to    3.772 sec.
Spectral model in the cutoff power-law:
------------------------------------------------------------
Parameters  : value       lower 90%   higher 90%
Photon index: 1.29384     ( -0.624433   0.542655 )
Epeak [keV] : 51.6539      ( -11.3912 73.7336 )
Norm@50keV  : 9.81828E-03    ( -0.00486014   0.0120564 )
------------------------------------------------------------
#Fit statistic : Chi-Squared =          46.19 using 59 PHA bins.
# Reduced chi-squared =         0.8249 for     56 degrees of freedom
# Null hypothesis probability =   8.219657e-01

Photon flux (15-150 keV)    in 11.71 sec: 0.634659 ( -0.049317  0.049325 ) ph/cm2/s
Energy fluence (15-150 keV)             : 4.63087e-07 ( -4.73541e-08  4.86902e-08 ) ergs/cm2
Band function

Time interval is from   -7.940 sec. to    3.772 sec.

Spectral model in the Band function:
------------------------------------------------------------
Parameters  : value       lower 90%   higher 90%
alpha       : -1.29384   ( 1.38551   0.362679 )
beta        : -10.00000    ( 10   7.10543e-15 )
Epeak [keV] : 51.6439      ( -11.1342 73.7086 )
Norm@50keV   : 9.81702E-03    ( -0.00069641   0.0120864 )
------------------------------------------------------------
#Fit statistic : Chi-Squared =          46.19 using 59 PHA bins.
# Reduced chi-squared =         0.8399 for     55 degrees of freedom
# Null hypothesis probability =   7.951992e-01

Photon flux (15-150 keV)    in 11.71 sec:  (    ) ph/cm2/s
Energy fluence (15-150 keV)             : 4.641e-07 ( 0  0 ) ergs/cm2
Single BB
Spectral model blackbody:
------------------------------------------------------------
Parameters  : value    Lower 90%  Upper 90%
kT [keV]    : 10.7842  (-0.931289  1.02847)
R^2/D10^2   : 0.227849  (-0.0663955   0.0930847)
(R is the radius in km and D10 is the distance to the source in units of 10 kpc)
------------------------------------------------------------
#Fit statistic : Chi-Squared =          81.11 using 59 PHA bins.
# Reduced chi-squared =          1.423 for     57 degrees of freedom
# Null hypothesis probability =   1.964929e-02

Energy  Fluence     90% Error
[keV]   [erg/cm2]   [erg/cm2]
15- 25  6.456e-08   8.419e-09
25- 50  1.779e-07   1.470e-08
50-150  1.151e-07   2.169e-08
15-150  3.576e-07   3.267e-08
Thermal bremsstrahlung (OTTB)
Spectral model: thermal bremsstrahlung
------------------------------------------------------------
Parameters  : value         Lower 90%    Upper 90%
kT [keV]    : 81.5551       (-17.8005      26.6977)
Norm        : 3.03642       (-0.323784     0.375504)
------------------------------------------------------------
#Fit statistic : Chi-Squared =          46.16 using 59 PHA bins.
# Reduced chi-squared =         0.8098 for     57 degrees of freedom
# Null hypothesis probability =   8.472146e-01

Energy  Fluence     90% Error
[keV]   [erg/cm2]   [erg/cm2]
15- 25  9.237e-08   9.450e-09
25- 50  1.528e-07   1.200e-08
50-150  2.184e-07   6.891e-08
15-150  4.636e-07   7.471e-08
Double BB
Spectral model: bbodyrad<1> + bbodyrad<2>
------------------------------------------------------------
Parameters  : value         Lower 90%    Upper 90%
kT1 [keV]   : 6.10950        (-1.28478      1.42043)
R1^2/D10^2  : 1.28486        (-0.6407      1.69929)
kT2 [keV]   : 19.6038        (-4.02427      7.45392)
R2^2/D10^2  : 1.69438E-02    (-0.012227   0.0272958)
------------------------------------------------------------
#Fit statistic : Chi-Squared =          45.37 using 59 PHA bins.
# Reduced chi-squared =         0.8249 for     55 degrees of freedom
# Null hypothesis probability =   8.195005e-01

Energy  Fluence     90% Error
[keV]   [erg/cm2]   [erg/cm2]
15- 25  9.136e-08   2.839e-08
25- 50  1.522e-07   4.141e-08
50-150  2.146e-07   1.084e-07
15-150  4.582e-07   1.523e-07
Peak spectrum fit
Power-law model

Time interval is from    1.736 sec. to    2.736 sec.

Spectral model in power-law:
------------------------------------------------------------
Parameters  : value       lower 90%   higher 90%
Photon index: 1.35791     ( -0.195977   0.195974 )
Norm@50keV  : 1.13097E-02    ( -0.00131682   0.00131204 )
------------------------------------------------------------
#Fit statistic : Chi-Squared =          44.84 using 59 PHA bins.
# Reduced chi-squared =         0.7866 for     57 degrees of freedom
# Null hypothesis probability =   8.786311e-01

Photon flux (15-150 keV)    in 1 sec: 1.36473 ( -0.15813  0.158279 ) ph/cm2/s
Energy fluence (15-150 keV)             : 1.10265e-07 ( -1.43524e-08  1.45249e-08 ) ergs/cm2
Cutoff power-law model
Time interval is from    1.736 sec. to    2.736 sec.
Spectral model in the cutoff power-law:
------------------------------------------------------------
Parameters  : value       lower 90%   higher 90%
Photon index: 0.946666     ( -0.900925   0.512136 )
Epeak [keV] : 126.865      ( -60.5227 -126.876 )
Norm@50keV  : 1.83868E-02    ( -0.00813564   0.0337032 )
------------------------------------------------------------
#Fit statistic : Chi-Squared =          44.00 using 59 PHA bins.
# Reduced chi-squared =         0.7857 for     56 degrees of freedom
# Null hypothesis probability =   8.774929e-01

Photon flux (15-150 keV)    in 1 sec: 1.34366 ( -0.16244  0.16302 ) ph/cm2/s
Energy fluence (15-150 keV)             : 1.06615e-07 ( -1.62149e-08  1.606e-08 ) ergs/cm2
Band function

Time interval is from    1.736 sec. to    2.736 sec.

Spectral model in the Band function:
------------------------------------------------------------
Parameters  : value       lower 90%   higher 90%
alpha       : 4.74507   ( -4.74507   -4.74507 )
beta        : -1.52933    ( -0.26884   0.246181 )
Epeak [keV] : 29.0190      ( -7.19131 6.41074 )
Norm@50keV   : 299.797    ( -34.0623   3.73081e+06 )
------------------------------------------------------------
#Fit statistic : Chi-Squared =          42.51 using 59 PHA bins.
# Reduced chi-squared =         0.7728 for     55 degrees of freedom
# Null hypothesis probability =   8.907912e-01

Photon flux (15-150 keV)    in 1 sec:  (    ) ph/cm2/s
Energy fluence (15-150 keV)             : 1.07255e-07 ( -1.07248e-07  -1.50666e-08 ) ergs/cm2
Single BB

Spectral model blackbody:
------------------------------------------------------------
Parameters  : value    Lower 90%  Upper 90%
kT [keV]    : 15.5628  (-2.21346  2.66381)
R^2/D10^2   : 0.140677  (-0.058755   0.0979338)
(R is the radius in km and D10 is the distance to the source in units of 10 kpc)
------------------------------------------------------------
#Fit statistic : Chi-Squared =          57.75 using 59 PHA bins.
# Reduced chi-squared =          1.013 for     57 degrees of freedom
# Null hypothesis probability =   4.473533e-01

Energy  Fluence     90% Error
[keV]   [erg/cm2]   [erg/cm2]
15- 25  7.086e-09   1.543e-09
25- 50  2.911e-08   4.595e-09
50-150  4.874e-08   1.148e-08
15-150  8.493e-08   1.347e-08
Thermal bremsstrahlung (OTTB)
Spectral model: thermal bremsstrahlung
------------------------------------------------------------
Parameters  : value         Lower 90%    Upper 90%
kT [keV]    : 200.000       (      )
Norm        : 5.62176       (-0.645051     0.645018)
------------------------------------------------------------
#Fit statistic : Chi-Squared =          46.50 using 59 PHA bins.
# Reduced chi-squared =         0.8157 for     57 degrees of freedom
# Null hypothesis probability =   8.384846e-01

Energy  Fluence     90% Error
[keV]   [erg/cm2]   [erg/cm2]
15- 25  1.400e-08   7.805e-09
25- 50  2.693e-08   1.495e-08
50-150  5.906e-08   3.244e-08
15-150  9.999e-08   5.545e-08
Double BB
Spectral model: bbodyrad<1> + bbodyrad<2>
------------------------------------------------------------
Parameters  : value         Lower 90%    Upper 90%
kT1 [keV]   : 8.33261        (-3.11849      4.31935)
R1^2/D10^2  : 0.771076        (-0.524746      1.04176)
kT2 [keV]   : 31.1748        (-11.7388      -31.3013)
R2^2/D10^2  : 1.00109E-02    (-0.00926365   0.0450233)
------------------------------------------------------------
#Fit statistic : Chi-Squared =          43.55 using 59 PHA bins.
# Reduced chi-squared =         0.7918 for     55 degrees of freedom
# Null hypothesis probability =   8.672781e-01

Energy  Fluence     90% Error
[keV]   [erg/cm2]   [erg/cm2]
15- 25  1.145e-08   6.100e-09
25- 50  2.800e-08   1.290e-08
50-150  6.850e-08   3.686e-08
15-150  1.079e-07   5.510e-08
Pre-slew spectrum (Pre-slew PHA with pre-slew DRM)
Power-law model
Spectral model in power-law:
------------------------------------------------------------
Parameters  : value       lower 90%   higher 90%
Photon index: 1.88697     ( -0.131264   0.135232 )
Norm@50keV  : 4.56756E-03    ( -0.000388535   0.000383116 )
------------------------------------------------------------
#Fit statistic : Chi-Squared =          49.71 using 59 PHA bins.
# Reduced chi-squared =         0.8722 for     57 degrees of freedom
# Null hypothesis probability =   7.424069e-01

Photon flux (15-150 keV)    in 11.71 sec: 0.651896 ( -0.046872  0.0468991 ) ph/cm2/s
Energy fluence (15-150 keV)             : 4.91698e-07 ( -4.11405e-08  4.16705e-08 ) ergs/cm2
Cutoff power-law model

Spectral model in the cutoff power-law:
------------------------------------------------------------
Parameters  : value       lower 90%   higher 90%
Photon index: 1.29384     ( -0.624433   0.542655 )
Epeak [keV] : 51.6539      ( -11.3912 73.7336 )
Norm@50keV  : 9.81828E-03    ( -0.00486014   0.0120564 )
------------------------------------------------------------
#Fit statistic : Chi-Squared =          46.19 using 59 PHA bins.
# Reduced chi-squared =         0.8249 for     56 degrees of freedom
# Null hypothesis probability =   8.219657e-01

Photon flux (15-150 keV)    in 11.71 sec: 0.634659 ( -0.049317  0.049325 ) ph/cm2/s
Energy fluence (15-150 keV)             : 4.63087e-07 ( -4.73541e-08  4.86902e-08 ) ergs/cm2
Band function
Spectral model in the Band function:
------------------------------------------------------------
Parameters  : value       lower 90%   higher 90%
alpha       : -1.29384   ( 1.38551   0.362679 )
beta        : -10.00000    ( 10   5.50671e-14 )
Epeak [keV] : 51.6439      ( -11.1342 73.7086 )
Norm@50keV   : 9.81702E-03    ( -0.00069641   0.0120864 )
------------------------------------------------------------
#Fit statistic : Chi-Squared =          46.19 using 59 PHA bins.
# Reduced chi-squared =         0.8399 for     55 degrees of freedom
# Null hypothesis probability =   7.951992e-01

Photon flux (15-150 keV)    in 11.71 sec:  (    ) ph/cm2/s
Energy fluence (15-150 keV)             : 4.641e-07 ( 0  0 ) ergs/cm2
S(25-50 keV) vs. S(50-100 keV) plot

S(25-50 keV)  = 1.43e-07
S(50-100 keV) = 1.54e-07
T90 vs. Hardness ratio plot
T90                                   = 10.5799999833107 sec.
Hardness ratio (energy fluence ratio) = 1.07692
Color vs. Color plot
Count Ratio  (25-50 keV) / (15-25 keV) = 1.16083
Count Ratio (50-100 keV) / (15-25 keV) = 0.636006
Mask shadow pattern

IMX = 2.082417405171726E-01, IMY = -1.007420848035764E-01
TIME vs. PHA plot around the trigger time
Blue+Cyan dotted lines: Time interval of the scaled map
From 0.000000 to 1.024000
TIME vs. DetID plot around the trigger time
Blue+Cyan dotted lines: Time interval of the scaled map
From 0.000000 to 1.024000
100 us light curve (15-350 keV)
Blue+Cyan dotted lines: Time interval of the scaled map
From 0.000000 to 1.024000
Spacecraft aspect plot
Bright source in the pre-burst/pre-slew/post-slew images
Pre-burst image of 15-350 keV band
Time interval of the image:
-239.072000 -7.940000

# RAcent  DECcent POSerr Theta    Phi  PeakCts   SNR AngSep     Name
#  [deg]    [deg]    ['] [deg]  [deg]                   [']
254.4765  35.3722    2.9  41.9   20.8   1.7946   4.0    2.0	Her X-1
268.2726  -1.4290   22.1  43.7  -37.9   0.1813   0.5    5.9	SW J1753.5-0127
288.7918  10.9322    0.7  20.7  -50.7   3.3020  15.6    0.9	GRS 1915+105
299.5873  35.2032    0.4   8.8   68.9   6.5573  30.5    0.2	Cyg X-1
308.1246  40.9526    1.9  14.7  102.5   1.3552   6.2    0.7	Cyg X-3
326.0878  38.4050    4.1  22.6  140.3   0.7052   2.8    6.4	Cyg X-2
329.7395  -2.6541    2.2  39.3 -138.6   1.6248   5.2 ------	UNKNOWN
305.0155  -3.3717    2.6  30.3  -97.4   1.3518   4.5 ------	UNKNOWN
354.4824  -4.2992    3.4  58.7 -159.3   4.9156   3.4  419.4	UNKNOWN
Pre-slew background subtracted image of 15-350 keV band
Time interval of the image:
-7.940000 3.772000

# RAcent  DECcent POSerr Theta    Phi  PeakCts   SNR AngSep     Name
#  [deg]    [deg]    ['] [deg]  [deg]                   [']
254.4088  35.1861    6.1  42.0   20.6  -0.1588  -1.9    9.7	Her X-1
268.3603  -1.5783    6.8  43.8  -38.2   0.1273   1.7    7.6	SW J1753.5-0127
288.7335  10.8525    3.9  20.8  -50.7  -0.1225  -3.0    6.8	GRS 1915+105
299.4592  35.2830    3.0   8.9   68.4   0.1545   3.9    8.1	Cyg X-1
308.0074  41.1122    6.1  14.9  102.0   0.0826   1.9   10.6	Cyg X-3
326.2841  38.4434    5.7  22.7  140.3  -0.0979  -2.0    9.0	Cyg X-2
289.3734  32.5282    0.5  13.0   25.8   0.9310  22.7 ------	UNKNOWN
348.6143   7.5567    2.4  47.4 -167.8   0.3569   4.8 ------	UNKNOWN
256.3014   1.6397    1.8  51.3  -24.6   0.6413   6.4 ------	UNKNOWN
Post-slew image of 15-350 keV band
Time interval of the image:
45.028600 962.975100

# RAcent  DECcent POSerr Theta    Phi  PeakCts   SNR AngSep     Name
#  [deg]    [deg]    ['] [deg]  [deg]                   [']
254.4730  35.3656    1.5  28.9   18.6   6.1520   7.8    1.6	Her X-1
268.3487  -1.4498    9.2  39.3  -52.4   1.4489   1.3    1.2	SW J1753.5-0127
288.7940  10.9596    0.7  21.6  -85.3  12.7646  17.1    0.9	GRS 1915+105
299.5864  35.2051    0.3   8.9  162.8  24.9694  43.1    0.3	Cyg X-1
308.0607  40.9494    1.5  17.1  148.4   5.2745   7.8    2.3	Cyg X-3
326.1675  38.2737    2.3  30.3  161.8   4.6631   5.1    2.9	Cyg X-2
301.8170  36.6465    2.6  11.0  157.8   2.5384   4.5 ------	UNKNOWN
347.7662   8.3058    4.0  59.0 -166.3  12.5741   2.9 ------	UNKNOWN
319.4540  -6.0340    3.1  48.0 -128.9   9.9584   3.8 ------	UNKNOWN
Plot creation:
Thu May 28 13:42:16 EDT 2015