Click here for the BAT GCN circular template
Image
Pre-slew 15.0-350.0 keV image (Event data)

#   RAcent    DECcent   POSerr    Theta     Phi              Peak Cts       SNR   Name
   39.3072     8.0643   0.0208    37.2135   146.5094         0.9767557      9.287 TRIG_00627170

Foreground time interval of the image:
-17.636  10.544 (delta_t =  28.180 [sec])
Background time interval of the image:
-63.603 -17.636 (delta_t =  45.967 [sec])
Lightcurves
Notes:
- 1) The mask-weighted light curves are using the flight position.
- 2) Multiple plots of different time binning/intervals are shown to cover all scenarios of short/long GRBs, rate/image triggers, and real/false positives.
- 3) For all the mask-weighted lightcurves, the y-axis units are counts/sec/det where a det is 0.4 x 0.4 = 0.16 sq cm.
- 4) The verticle lines correspond to following: green dotted lines are T50 interval, black dotted lines are T90 interval, blue solid line(s) is a spacecraft slew start time, and orange solid line(s) is a spacecraft slew end time.
- 5) Time of each bin is in the middle of the bin.
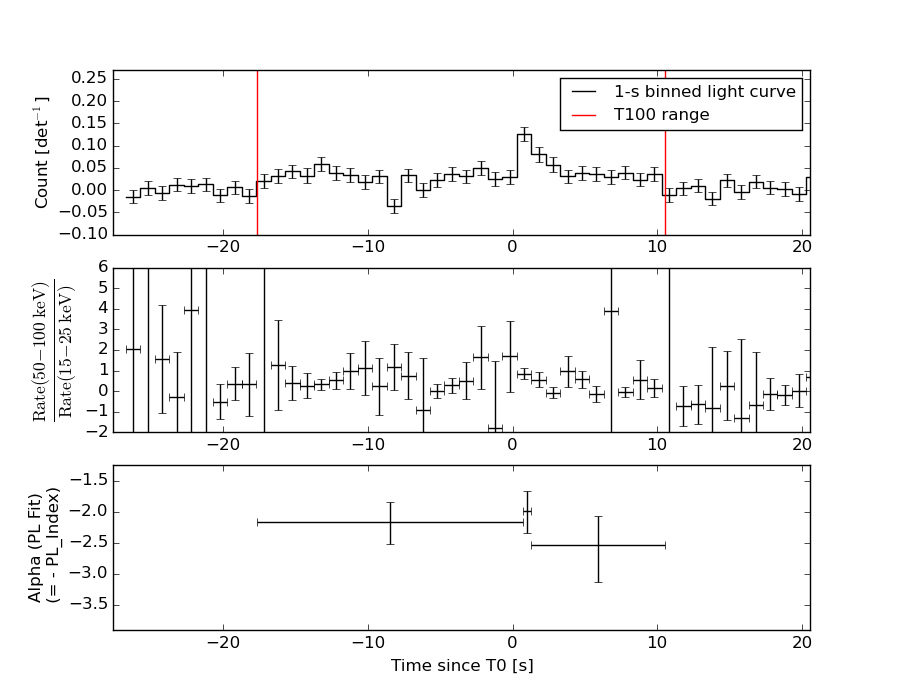
1 s binning
From T0-310 s to T0+310 s
From T100_start - 20 s to T100_end + 30 s
Full time interval

64 ms binning
Full time interval

From T100_start to T100_end

From T0-5 sec to T0+5 sec
16 ms binning
From T100_start-5 s to T100_start+5 s

8 ms binning
From T100_start-3 s to T100_start+3 s

2 ms binning
From T100_start-1 s to T100_start+1 s

SN=5 or 10 sec. binning (whichever binning is satisfied first)
SN=5 or 10 sec. binning (T < 200 sec)
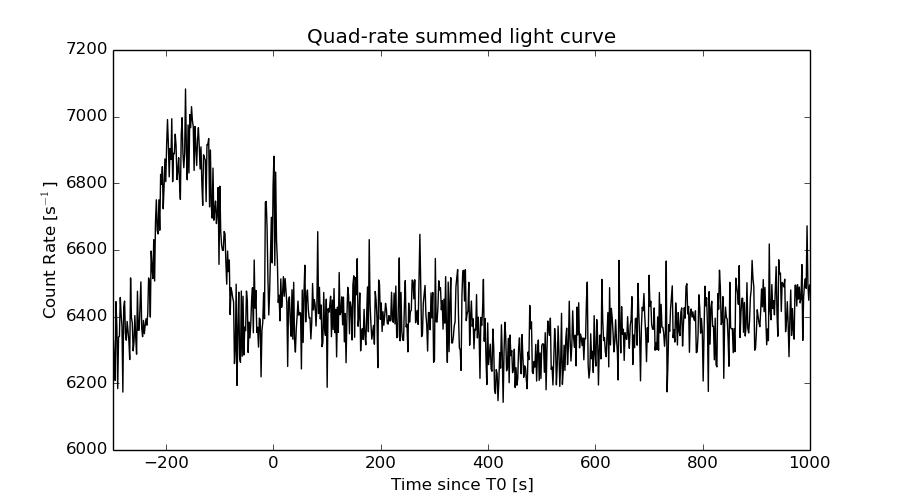
Quad-rate summed light curves (from T0-300s to T0+1000s)
Spectral Evolution
Spectra
Notes:
- 1) The fitting includes the systematic errors.
- 2) When the burst includes telescope slew time periods, the fitting uses an average response file made from multiple 5-s response files through out the slew time plus single time preiod for the non-slew times, and weighted by the total counts in the corresponding time period using addrmf. An average response file is needed becuase a spectral fit using the pre-slew DRM will introduce some errors in both a spectral shape and a normalization if the PHA file contains a lot of the slew/post-slew time interval.
- 3) For fits to more complicated models (e.g. a power-law over a cutoff power-law), the BAT team has decided to require a chi-square improvement of more than 6 for each extra dof.
Time averaged spectrum fit using the average DRM
Power-law model
Time interval is from  -17.636 sec. to   10.544 sec.

Spectral model in power-law:
------------------------------------------------------------
Parameters  : value       lower 90%   higher 90%
Photon index: 2.23627     ( -0.24687   0.270794 )
Norm@50keV  : 2.00490E-03    ( -0.000376279   0.000366019 )
------------------------------------------------------------
#Fit statistic : Chi-Squared =          46.93 using 59 PHA bins.
# Reduced chi-squared =         0.8232 for     57 degrees of freedom
# Null hypothesis probability =   8.269769e-01

Photon flux (15-150 keV)    in 28.18 sec: 0.338378 ( -0.0436548  0.0436584 ) ph/cm2/s
Energy fluence (15-150 keV)             : 5.34073e-07 ( -8.34875e-08  8.59651e-08 ) ergs/cm2
Cutoff power-law model
Time interval is from  -17.636 sec. to   10.544 sec.
Spectral model in the cutoff power-law:
------------------------------------------------------------
Parameters  : value       lower 90%   higher 90%
Photon index: 1.54098     ( -1.33028   0.44862 )
Epeak [keV] : 25.7908      (   )
Norm@50keV  : 5.26667E-03    (     )
------------------------------------------------------------
#Fit statistic : Chi-Squared =          45.63 using 59 PHA bins.
# Reduced chi-squared =         0.8148 for     56 degrees of freedom
# Null hypothesis probability =   8.374539e-01

Photon flux (15-150 keV)    in 28.18 sec: 0.331343 ( -0.044697  0.044795 ) ph/cm2/s
Energy fluence (15-150 keV)             : 5.00781e-07 ( -8.94969e-08  9.82806e-08 ) ergs/cm2
Band function

Time interval is from  -17.636 sec. to   10.544 sec.

Spectral model in the Band function:
------------------------------------------------------------
Parameters  : value       lower 90%   higher 90%
alpha       : -1.51849   ( 1.51851   1.51851 )
beta        : -3.28384    ( 3.35556   10.7045 )
Epeak [keV] : 26.0878      ( -26.0904 16.554 )
Norm@50keV   : 5.44304E-03    ( -0.00314694   0 )
------------------------------------------------------------
#Fit statistic : Chi-Squared =          45.62 using 59 PHA bins.
# Reduced chi-squared =         0.8295 for     55 degrees of freedom
# Null hypothesis probability =   8.122778e-01

Photon flux (15-150 keV)    in 28.18 sec:  (    ) ph/cm2/s
Energy fluence (15-150 keV)             : 0 ( 0  0 ) ergs/cm2
Single BB

Spectral model blackbody:
------------------------------------------------------------
Parameters  : value    Lower 90%  Upper 90%
kT [keV]    : 8.50107  (-1.2491  1.45457)
R^2/D10^2   : 0.290719  (-0.135263   0.25781)
(R is the radius in km and D10 is the distance to the source in units of 10 kpc)
------------------------------------------------------------
#Fit statistic : Chi-Squared =          56.03 using 59 PHA bins.
# Reduced chi-squared =         0.9830 for     57 degrees of freedom
# Null hypothesis probability =   5.114797e-01

Energy  Fluence     90% Error
[keV]   [erg/cm2]   [erg/cm2]
15- 25  1.116e-07   2.841e-08
25- 50  2.164e-07   3.725e-08
50-150  6.914e-08   2.743e-08
15-150  3.972e-07   7.059e-08
Thermal bremsstrahlung (OTTB)
Spectral model: thermal bremsstrahlung
------------------------------------------------------------
Parameters  : value         Lower 90%    Upper 90%
kT [keV]    : 45.5334       (-13.2072      21.8135)
Norm        : 2.02399       (-0.430347     0.595225)
------------------------------------------------------------
#Fit statistic : Chi-Squared =          45.72 using 59 PHA bins.
# Reduced chi-squared =         0.8022 for     57 degrees of freedom
# Null hypothesis probability =   8.580298e-01

Energy  Fluence     90% Error
[keV]   [erg/cm2]   [erg/cm2]
15- 25  1.362e-07   2.347e-08
25- 50  1.890e-07   3.404e-08
50-150  1.675e-07   6.221e-08
15-150  4.927e-07   9.412e-08
Double BB

Spectral model: bbodyrad<1> + bbodyrad<2>
------------------------------------------------------------
Parameters  : value         Lower 90%    Upper 90%
kT1 [keV]   : 4.98842        (-2.38729      2.18002)
R1^2/D10^2  : 1.65391        (-1.18674      28.987)
kT2 [keV]   : 15.0035        (-5.00251      13.8255)
R2^2/D10^2  : 2.05005E-02    (-0.0192134   0.111623)
------------------------------------------------------------
#Fit statistic : Chi-Squared =          45.91 using 59 PHA bins.
# Reduced chi-squared =         0.8347 for     55 degrees of freedom
# Null hypothesis probability =   8.037887e-01

Energy  Fluence     90% Error
[keV]   [erg/cm2]   [erg/cm2]
15- 25  1.395e-07   7.585e-08
25- 50  1.811e-07   9.653e-08
50-150  1.687e-07   9.547e-08
15-150  4.893e-07   2.570e-07
Peak spectrum fit
Power-law model
Time interval is from    0.584 sec. to    1.584 sec.

Spectral model in power-law:
------------------------------------------------------------
Parameters  : value       lower 90%   higher 90%
Photon index: 1.93752     ( -0.341447   0.381415 )
Norm@50keV  : 8.36696E-03    ( -0.00200835   0.00191167 )
------------------------------------------------------------
#Fit statistic : Chi-Squared =          60.28 using 59 PHA bins.
# Reduced chi-squared =          1.058 for     57 degrees of freedom
# Null hypothesis probability =   3.580096e-01

Photon flux (15-150 keV)    in 1 sec: 1.22033 ( -0.240574  0.240791 ) ph/cm2/s
Energy fluence (15-150 keV)             : 7.69717e-08 ( -1.73864e-08  1.77062e-08 ) ergs/cm2
Cutoff power-law model

Time interval is from    0.584 sec. to    1.584 sec.
Spectral model in the cutoff power-law:
------------------------------------------------------------
Parameters  : value       lower 90%   higher 90%
Photon index: 1.68241     ( -1.98152   0.517149 )
Epeak [keV] : 57.0932      (   )
Norm@50keV  : 1.15544E-02    (     )
------------------------------------------------------------
#Fit statistic : Chi-Squared =          60.21 using 59 PHA bins.
# Reduced chi-squared =          1.075 for     56 degrees of freedom
# Null hypothesis probability =   3.260391e-01

Photon flux (15-150 keV)    in 1 sec: 1.21176 ( -0.247394  0.2448 ) ph/cm2/s
Energy fluence (15-150 keV)             : 7.5786e-08 ( -1.86027e-08  1.86666e-08 ) ergs/cm2
Band function

Time interval is from    0.584 sec. to    1.584 sec.

Spectral model in the Band function:
------------------------------------------------------------
Parameters  : value       lower 90%   higher 90%
alpha       : -1.55334   ( 1.2786   1.2786 )
beta        : -2.25525    ( 2.25345   2.57112 )
Epeak [keV] : 52.8474      ( -52.673 -52.673 )
Norm@50keV   : 1.35946E-02    ( -0.00679973   0 )
------------------------------------------------------------
#Fit statistic : Chi-Squared =          60.14 using 59 PHA bins.
# Reduced chi-squared =          1.093 for     55 degrees of freedom
# Null hypothesis probability =   2.951763e-01

Photon flux (15-150 keV)    in 1 sec:  (    ) ph/cm2/s
Energy fluence (15-150 keV)             : 0 ( 0  0 ) ergs/cm2
Single BB

Spectral model blackbody:
------------------------------------------------------------
Parameters  : value    Lower 90%  Upper 90%
kT [keV]    : 11.8878  (-2.39884  2.80536)
R^2/D10^2   : 0.307031  (-0.170454   0.398831)
(R is the radius in km and D10 is the distance to the source in units of 10 kpc)
------------------------------------------------------------
#Fit statistic : Chi-Squared =          65.85 using 59 PHA bins.
# Reduced chi-squared =          1.155 for     57 degrees of freedom
# Null hypothesis probability =   1.972637e-01

Energy  Fluence     90% Error
[keV]   [erg/cm2]   [erg/cm2]
15- 25  9.169e-09   3.092e-09
25- 50  2.854e-08   9.510e-09
50-150  2.410e-08   1.156e-08
15-150  6.181e-08   1.992e-08
Thermal bremsstrahlung (OTTB)

Spectral model: thermal bremsstrahlung
------------------------------------------------------------
Parameters  : value         Lower 90%    Upper 90%
kT [keV]    : 80.5607       (-35.7369      103.96)
Norm        : 5.73171       (-1.50102     2.04755)
------------------------------------------------------------
#Fit statistic : Chi-Squared =          60.36 using 59 PHA bins.
# Reduced chi-squared =          1.059 for     57 degrees of freedom
# Null hypothesis probability =   3.552472e-01

Energy  Fluence     90% Error
[keV]   [erg/cm2]   [erg/cm2]
15- 25  1.488e-08   4.058e-09
25- 50  2.454e-08   7.240e-09
50-150  3.480e-08   2.371e-08
15-150  7.421e-08   2.987e-08
Double BB

Spectral model: bbodyrad<1> + bbodyrad<2>
------------------------------------------------------------
Parameters  : value         Lower 90%    Upper 90%
kT1 [keV]   : 2.44608        (-2.10413      3.01323)
R1^2/D10^2  : 193.301        (-190.462      -193.336)
kT2 [keV]   : 13.9998        (-3.12806      5.1875)
R2^2/D10^2  : 0.150063    (-0.110007   0.138608)
------------------------------------------------------------
#Fit statistic : Chi-Squared =          58.54 using 59 PHA bins.
# Reduced chi-squared =          1.064 for     55 degrees of freedom
# Null hypothesis probability =   3.467274e-01

Energy  Fluence     90% Error
[keV]   [erg/cm2]   [erg/cm2]
15- 25  1.525e-08   7.532e-09
25- 50  2.371e-08   1.221e-08
50-150  2.982e-08   1.904e-08
15-150  6.878e-08   3.104e-08
Pre-slew spectrum (Pre-slew PHA with pre-slew DRM)
Power-law model
Spectral model in power-law:
------------------------------------------------------------
Parameters  : value       lower 90%   higher 90%
Photon index: 2.23627     ( -0.24687   0.270794 )
Norm@50keV  : 2.00490E-03    ( -0.000376279   0.000366019 )
------------------------------------------------------------
#Fit statistic : Chi-Squared =          46.93 using 59 PHA bins.
# Reduced chi-squared =         0.8232 for     57 degrees of freedom
# Null hypothesis probability =   8.269769e-01

Photon flux (15-150 keV)    in 28.18 sec: 0.338378 ( -0.0436548  0.0436584 ) ph/cm2/s
Energy fluence (15-150 keV)             : 5.34073e-07 ( -8.34875e-08  8.59651e-08 ) ergs/cm2
Cutoff power-law model

Spectral model in the cutoff power-law:
------------------------------------------------------------
Parameters  : value       lower 90%   higher 90%
Photon index: 1.54098     ( -1.33028   0.44862 )
Epeak [keV] : 25.7908      (   )
Norm@50keV  : 5.26667E-03    (     )
------------------------------------------------------------
#Fit statistic : Chi-Squared =          45.63 using 59 PHA bins.
# Reduced chi-squared =         0.8148 for     56 degrees of freedom
# Null hypothesis probability =   8.374539e-01

Photon flux (15-150 keV)    in 28.18 sec: 0.331343 ( -0.044697  0.044795 ) ph/cm2/s
Energy fluence (15-150 keV)             : 5.00781e-07 ( -8.94969e-08  9.82806e-08 ) ergs/cm2
Band function

Spectral model in the Band function:
------------------------------------------------------------
Parameters  : value       lower 90%   higher 90%
alpha       : -1.51849   ( 1.51851   1.51851 )
beta        : -3.28384    ( 3.35556   10.7045 )
Epeak [keV] : 26.0878      ( -26.0904 16.554 )
Norm@50keV   : 5.44304E-03    ( -0.00314694   0 )
------------------------------------------------------------
#Fit statistic : Chi-Squared =          45.62 using 59 PHA bins.
# Reduced chi-squared =         0.8295 for     55 degrees of freedom
# Null hypothesis probability =   8.122778e-01

Photon flux (15-150 keV)    in 28.18 sec:  (    ) ph/cm2/s
Energy fluence (15-150 keV)             : 0 ( 0  0 ) ergs/cm2
S(25-50 keV) vs. S(50-100 keV) plot

S(25-50 keV)  = 1.70e-07
S(50-100 keV) = 1.45e-07
T90 vs. Hardness ratio plot

T90                                   = 24.3359999656677 sec.
Hardness ratio (energy fluence ratio) = 0.852941
Color vs. Color plot
Count Ratio  (25-50 keV) / (15-25 keV) = 0.990103
Count Ratio (50-100 keV) / (15-25 keV) = 0.480681
Mask shadow pattern
IMX = -6.333327799551866E-01, IMY = -4.190438209869349E-01
TIME vs. PHA plot around the trigger time

TIME vs. DetID plot around the trigger time
100 us light curve (15-350 keV)
Spacecraft aspect plot
Bright source in the pre-burst/pre-slew/post-slew images
Pre-burst image of 15-350 keV band
Time interval of the image:
-63.603400 -17.636000

# RAcent  DECcent POSerr Theta    Phi  PeakCts   SNR AngSep     Name
#  [deg]    [deg]    ['] [deg]  [deg]                   [']
308.2660  40.9006   10.5  48.7  -43.7  -0.2463  -1.1    7.7	Cyg X-3
326.1872  38.1970    6.0  35.6  -51.2   0.1852   1.9    7.5	Cyg X-2
 40.4090  62.6001    2.5  34.2   43.2   0.4799   4.6 ------	UNKNOWN
 27.0051  -3.5422    2.6  40.7  173.0   0.4505   4.4 ------	UNKNOWN
 23.6430 -22.8729    2.7  58.3 -175.4   1.6455   4.3 ------	UNKNOWN
Pre-slew background subtracted image of 15-350 keV band
Time interval of the image:
-17.636000 10.544000

# RAcent  DECcent POSerr Theta    Phi  PeakCts   SNR AngSep     Name
#  [deg]    [deg]    ['] [deg]  [deg]                   [']
308.1059  40.9036    5.3  48.8  -43.6   0.4538   2.2    2.9	Cyg X-3
326.3884  38.3210    6.6  35.4  -51.0  -0.1517  -1.8   10.2	Cyg X-2
 58.2308  35.0339    1.9  39.1   93.5   1.4603   6.0 ------	UNKNOWN
 39.3072   8.0643    1.2  37.2  146.5   0.9765   9.3 ------	UNKNOWN
Post-slew image of 15-350 keV band
Time interval of the image:
411.896610 962.324800

# RAcent  DECcent POSerr Theta    Phi  PeakCts   SNR AngSep     Name
#  [deg]    [deg]    ['] [deg]  [deg]                   [']
 21.0265  40.6988    2.6  36.4   -4.2   1.7602   4.4 ------	UNKNOWN
 26.2867  31.2668    3.5  26.2   -6.4   0.9661   3.3 ------	UNKNOWN
 57.8779 -47.8163    2.8  58.3 -175.2   7.4336   4.1 ------	UNKNOWN
  6.6485 -20.8370    2.2  43.2 -113.2   7.2336   5.2 ------	UNKNOWN
Plot creation:
Thu May 28 13:38:12 EDT 2015