Special notes of this burst
Image
15.0-350.0 keV image (Event data with DETECTION mask)
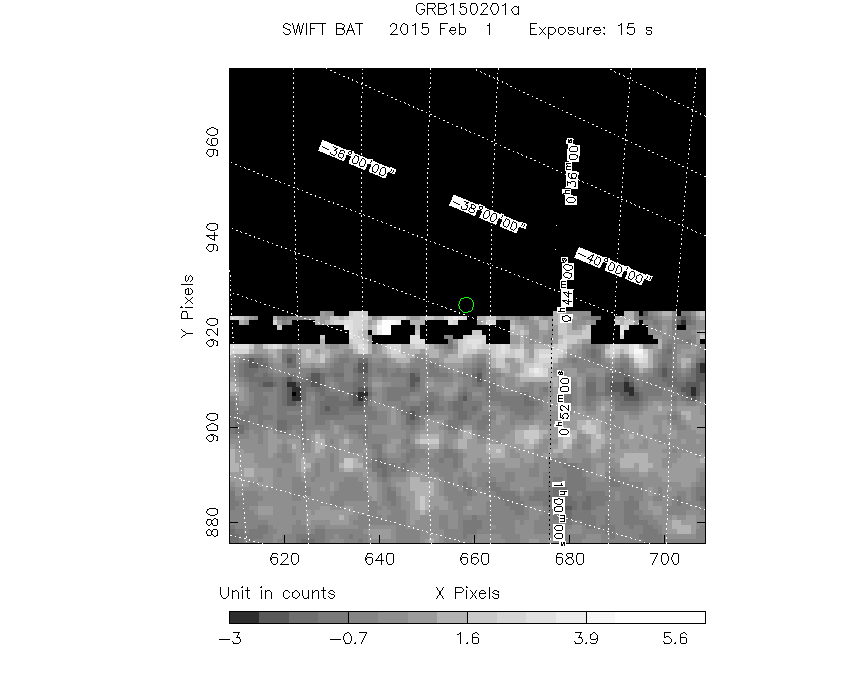
#RAcent DECcent POSerr Theta  Phi  Peak_Cts  SNR Name
11.822 -37.621 0.017 46.453 -63.754 22.535 11.442 TRIG_00629302

Image time interval: -2.772 to 23.820 [sec]
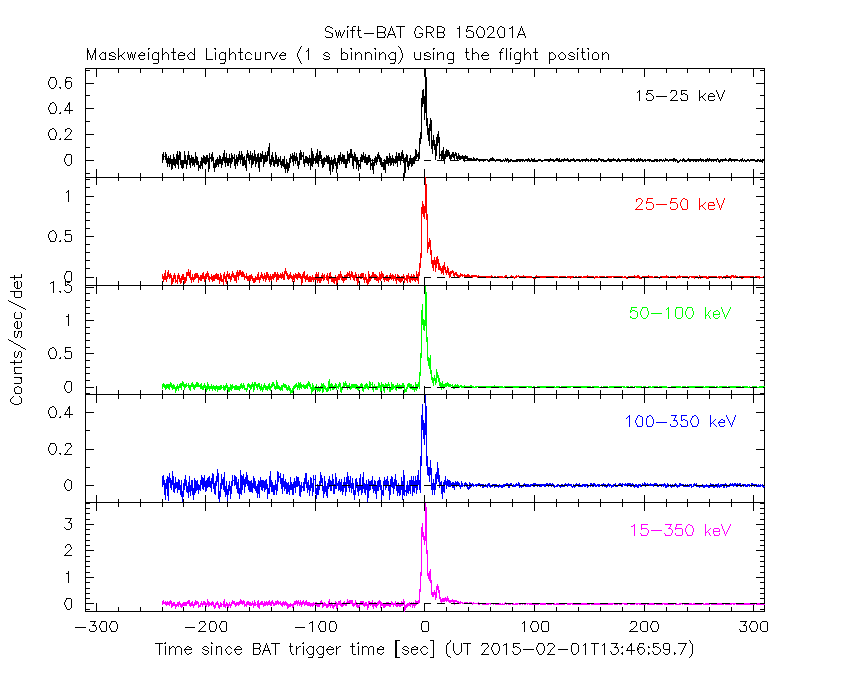
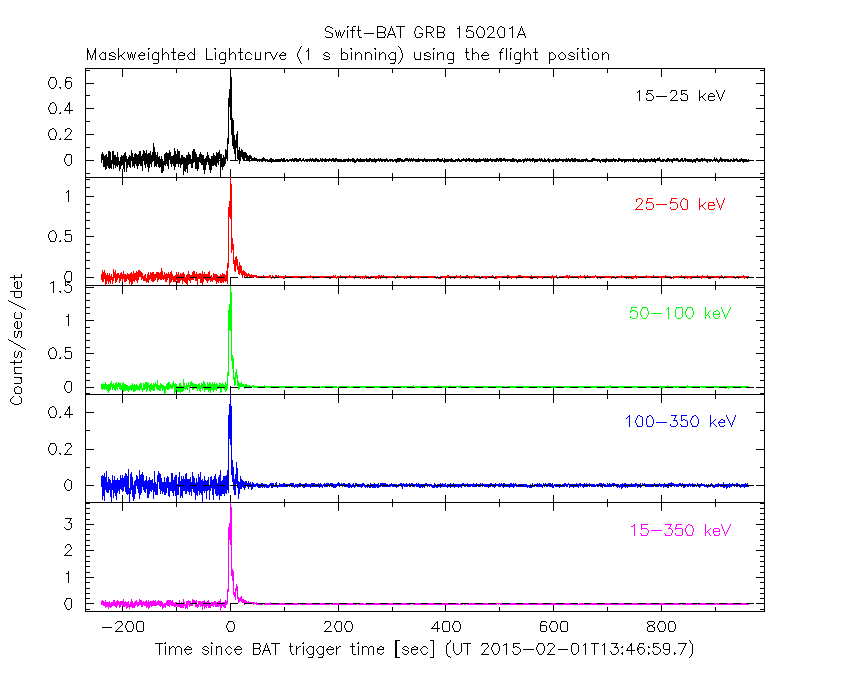
Lightcurves
Notes:
- 1) The mask-weighted lightcurves have units of either count/det or counts/sec/det, where a det is 0.4 x 0.4 = 0.16 sq cm.
- 2) The verticle lines correspond to following: green dotted lines are T50 interval, black dotted lines are T90 interval, blue solid line(s) is a spacecraft slew start time, and orange solid line(s) is a spacecraft slew end time (for the best duration plot, slew times are marked by green arrows).
- 3) For lightcurves in unit of count rate, time of each bin is in the middle of the bin.
1 s binning
From T0-310 s to T0+310 s
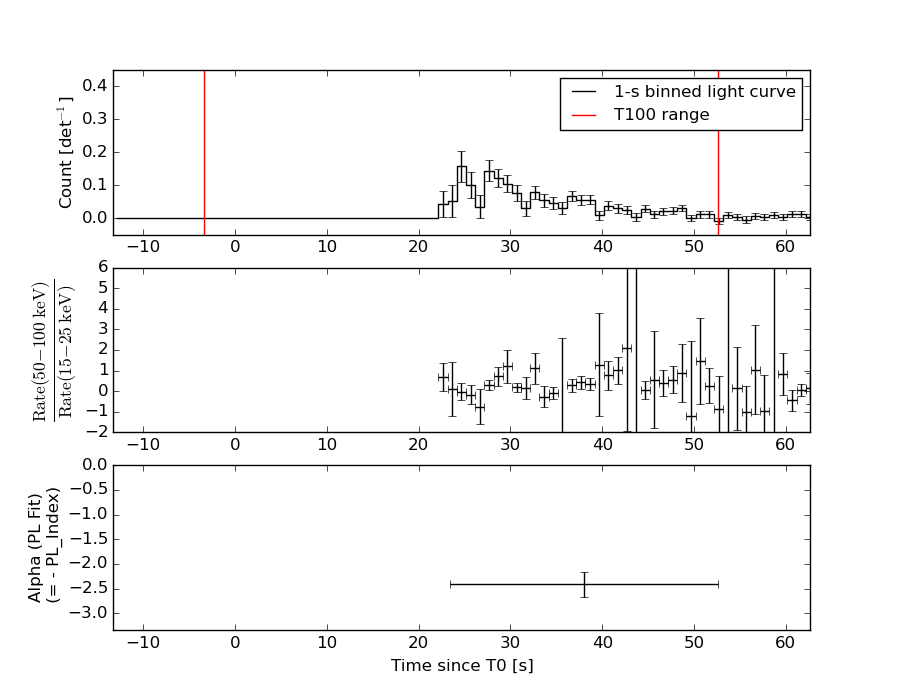
From T100_start - 20 s to T100_end + 30 s
Full time interval
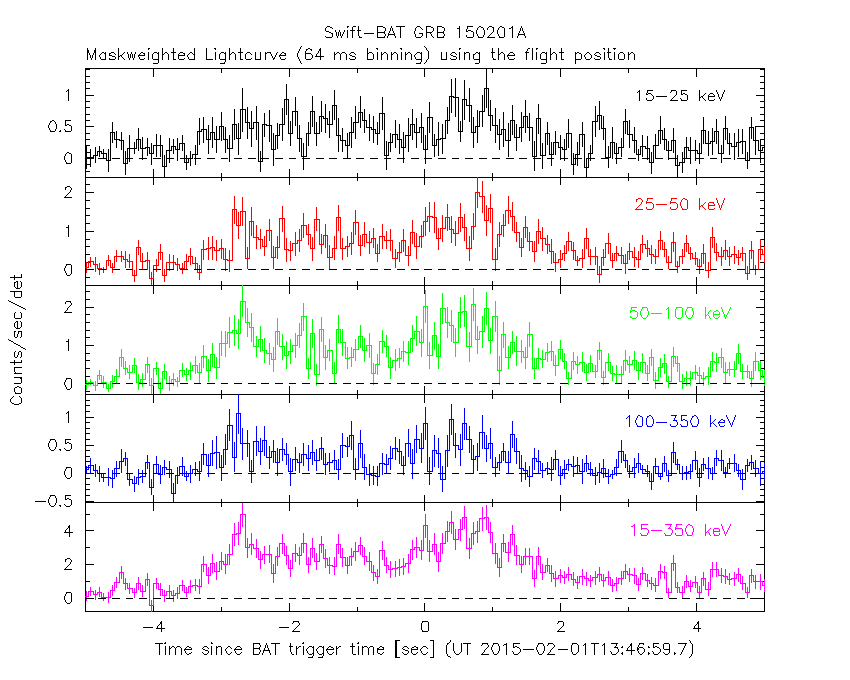
64 ms binning
Full time interval

From T100_start to T100_end

From T0-5 sec to T0+5 sec
16 ms binning
From T100_start-5 s to T100_start+5 s

Blue+Cyan dotted lines: Time interval of the scaled map
From 0.000000 to 1.024000
8 ms binning
From T100_start-3 s to T100_start+3 s

Blue+Cyan dotted lines: Time interval of the scaled map
From 0.000000 to 1.024000
2 ms binning
From T100_start-1 s to T100_start+1 s

Blue+Cyan dotted lines: Time interval of the scaled map
From 0.000000 to 1.024000
SN=5 or 10 sec. binning (whichever binning is satisfied first)
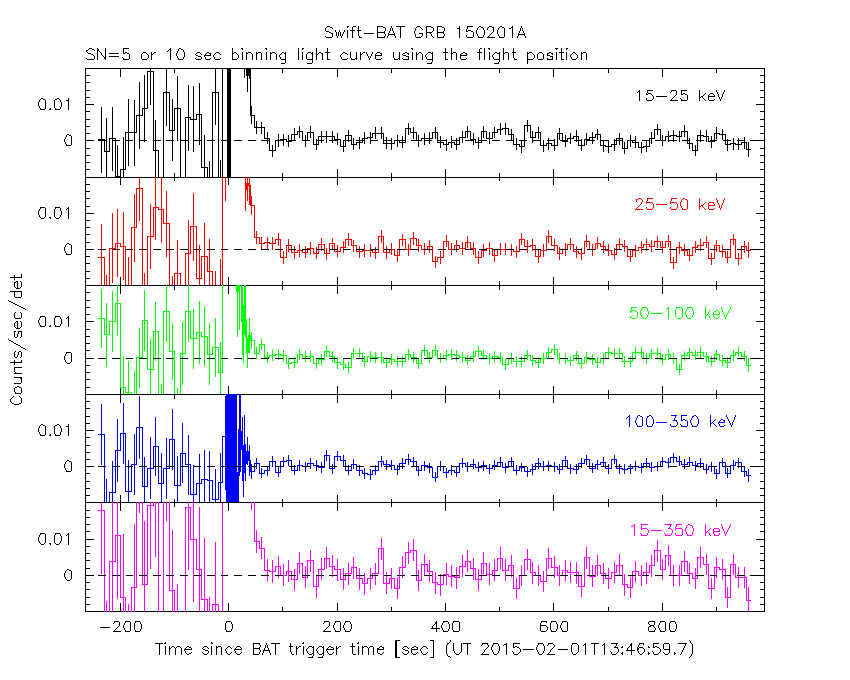
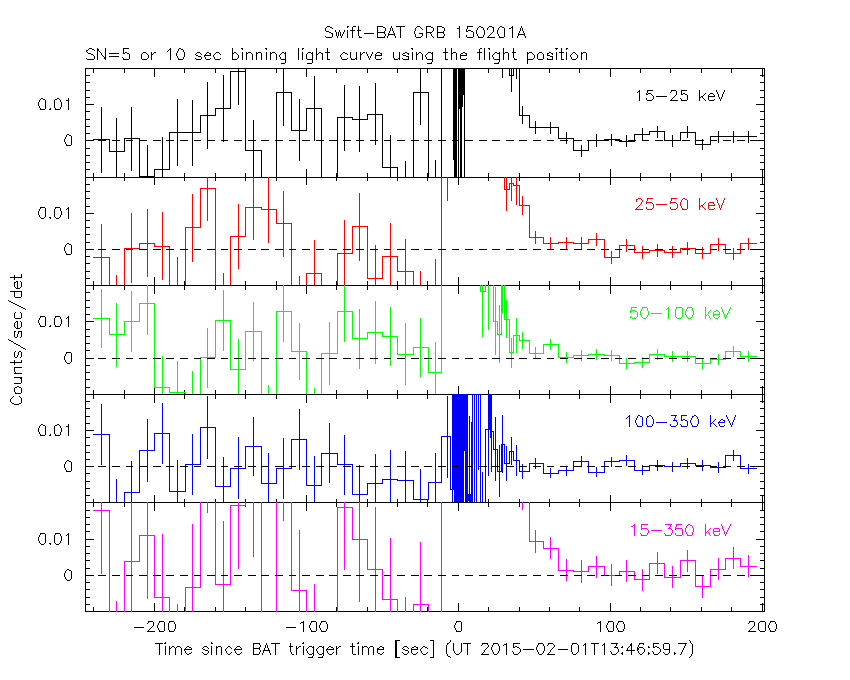
SN=5 or 10 sec. binning (T < 200 sec)
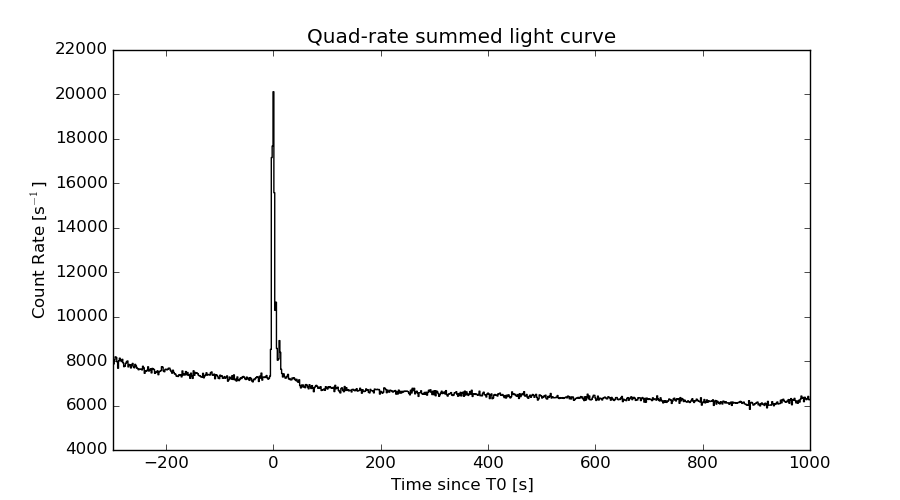
Quad-rate summed light curves (from T0-300s to T0+1000s)
Spectral Evolution
Spectra
Notes:
- 1) The fitting includes the systematic errors.
- 2) For long bursts, a spectral fit of the pre-slew DRM will introduce some errors in both a spectral shape and a normalization if the PHA file contains a lot of the slew/post-slew time interval.
- 3) For fits to more complicated models (e.g. a power-law over a cutoff power-law), the BAT team has decided to require a chi-square improvement of more than 6 for each extra dof.
- 4) For short bursts (T90<1sec), the specrtum is also fit with Blackbody, OTTB, and Double Blackbody.
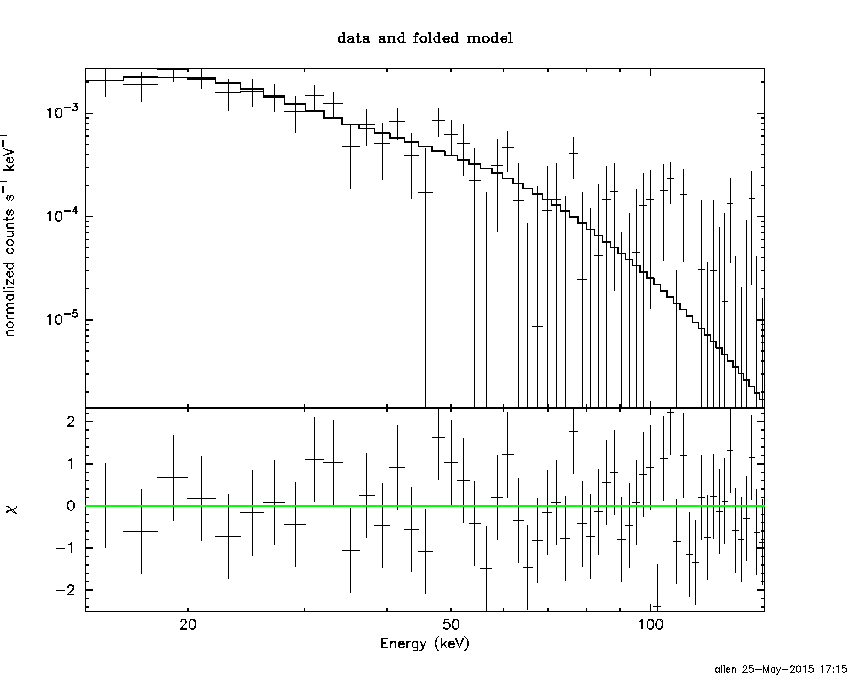
Time averaged spectrum fit using an average DRM
Power-law model
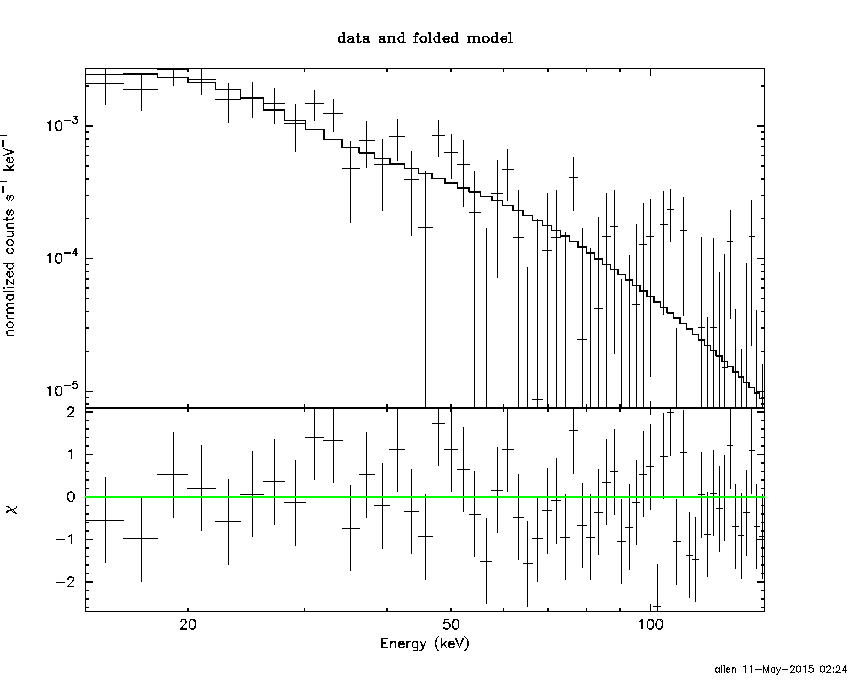
Time interval is from   22.592 sec. to   52.624 sec.

Spectral model in power-law:
------------------------------------------------------------
Parameters  : value       lower 90%   higher 90%
Photon index: 2.34999     ( -0.246928   0.271947 )
Norm@50keV  : 2.68540E-03    ( -0.000526324   0.000517181 )
------------------------------------------------------------
#Fit statistic : Chi-Squared =          52.97 using 59 PHA bins.
# Reduced chi-squared =         0.9293 for     57 degrees of freedom
# Null hypothesis probability =   6.270367e-01

Photon flux (15-150 keV)    in 30.03 sec: 0.482706 ( -0.0623266  0.0623268 ) ph/cm2/s
Energy fluence (15-150 keV)             : 7.78173e-07 ( -1.21524e-07  1.25524e-07 ) ergs/cm2
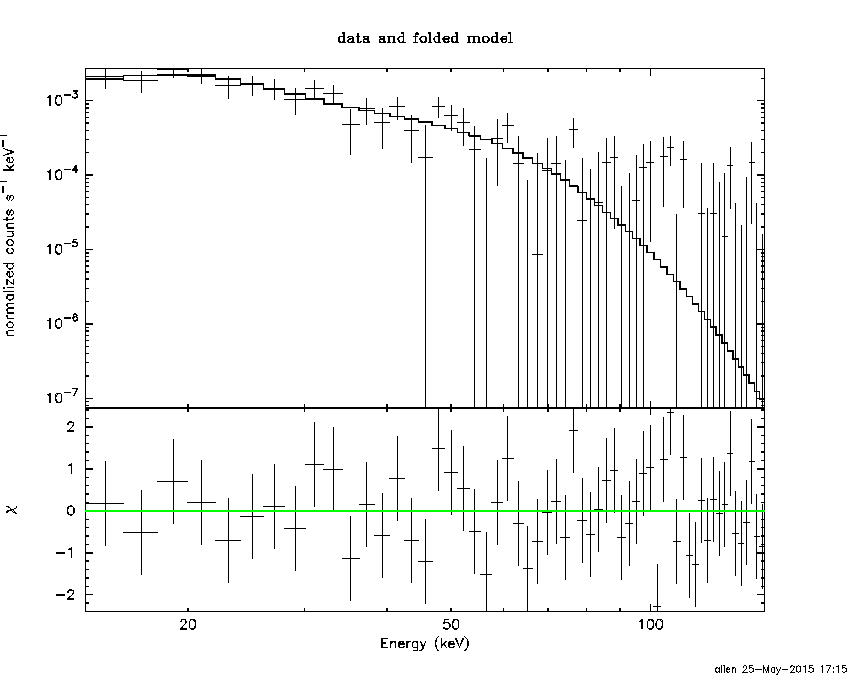
Cutoff power-law model
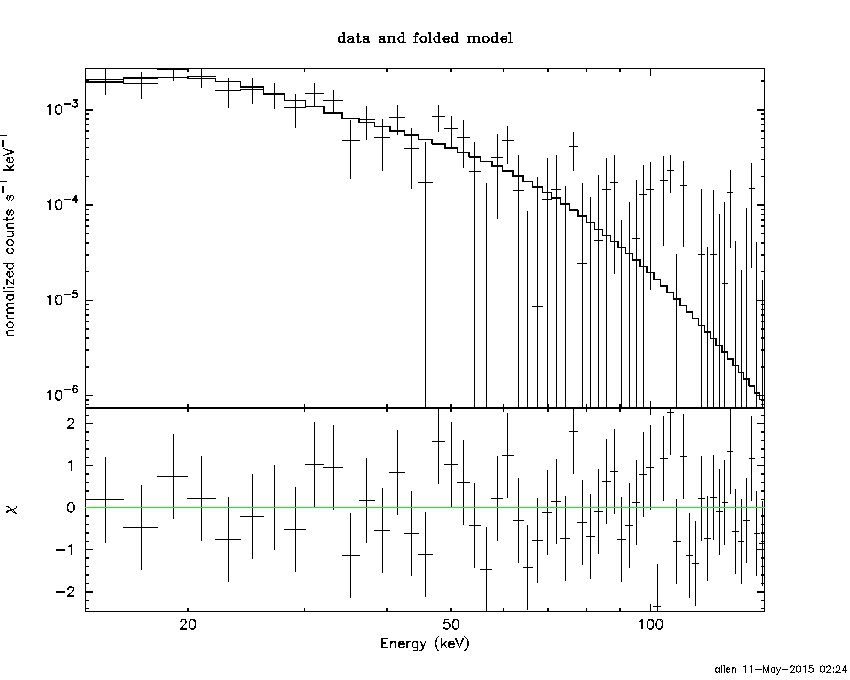
Time interval is from   22.592 sec. to   52.624 sec.
Spectral model in the cutoff power-law:
------------------------------------------------------------
Parameters  : value       lower 90%   higher 90%
Photon index: 0.976344     ( -1.67935   0.981604 )
Epeak [keV] : 27.3386      ( -26.4347 8.79763 )
Norm@50keV  : 1.93180E-02    ( -0.019318   0.211489 )
------------------------------------------------------------
#Fit statistic : Chi-Squared =          49.19 using 59 PHA bins.
# Reduced chi-squared =         0.8784 for     56 degrees of freedom
# Null hypothesis probability =   7.283677e-01

Photon flux (15-150 keV)    in 30.03 sec: 0.467244 ( -0.063023  0.063306 ) ph/cm2/s
Energy fluence (15-150 keV)             : 6.97576e-07 ( -1.17369e-07  1.35778e-07 ) ergs/cm2
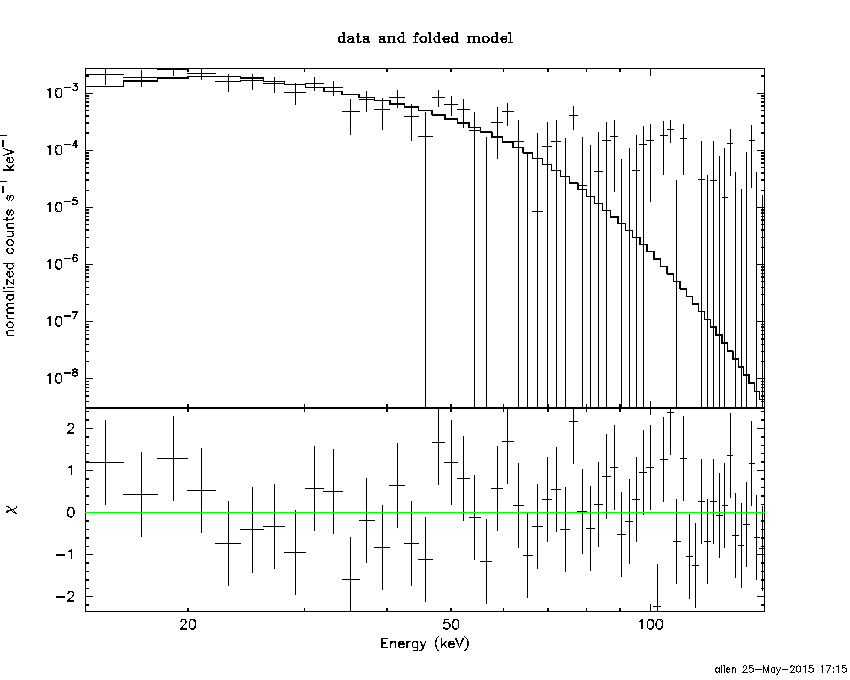
Band function

Time interval is from   22.592 sec. to   52.624 sec.

Spectral model in the Band function:
------------------------------------------------------------
Parameters  : value       lower 90%   higher 90%
alpha       : -0.979428   ( -0.705719   1.20413 )
beta        : -10.0000    ( 10   1.06581e-14 )
Epeak [keV] : 27.3179      ( -8.99462 8.81133 )
Norm@50keV   : 1.92284E-02    ( -0.0192284   0.211946 )
------------------------------------------------------------
#Fit statistic : Chi-Squared =          49.19 using 59 PHA bins.
# Reduced chi-squared =         0.8944 for     55 degrees of freedom
# Null hypothesis probability =   6.951748e-01

Photon flux (15-150 keV)    in 30.03 sec: 0.467653 ( 6.53235  -0.063433 ) ph/cm2/s
Energy fluence (15-150 keV)             : 7.07807e-07 ( 0  0 ) ergs/cm2
Single BB
Spectral model blackbody:
------------------------------------------------------------
Parameters  : value    Lower 90%  Upper 90%
kT [keV]    : 8.09888  (-1.07385  1.21047)
R^2/D10^2   : 0.513524  (-0.221834   0.401156)
(R is the radius in km and D10 is the distance to the source in units of 10 kpc)
------------------------------------------------------------
#Fit statistic : Chi-Squared =          54.81 using 59 PHA bins.
# Reduced chi-squared =         0.9615 for     57 degrees of freedom
# Null hypothesis probability =   5.578026e-01

Energy  Fluence     90% Error
[keV]   [erg/cm2]   [erg/cm2]
15- 25  1.846e-07   3.991e-08
25- 50  3.299e-07   6.335e-08
50-150  9.019e-08   3.847e-08
15-150  6.047e-07   1.057e-07
Thermal bremsstrahlung (OTTB)
Spectral model: thermal bremsstrahlung
------------------------------------------------------------
Parameters  : value         Lower 90%    Upper 90%
kT [keV]    : 38.0477       (-10.0979      15.3825)
Norm        : 3.26304       (-0.730046     0.982586)
------------------------------------------------------------
#Fit statistic : Chi-Squared =          49.38 using 59 PHA bins.
# Reduced chi-squared =         0.8663 for     57 degrees of freedom
# Null hypothesis probability =   7.533735e-01

Energy  Fluence     90% Error
[keV]   [erg/cm2]   [erg/cm2]
15- 25  2.211e-07   3.486e-08
25- 50  2.845e-07   4.523e-08
50-150  2.082e-07   7.947e-08
15-150  7.139e-07   1.359e-07
Double BB
Spectral model: bbodyrad<1> + bbodyrad<2>
------------------------------------------------------------
Parameters  : value         Lower 90%    Upper 90%
kT1 [keV]   : 3.96053        (-2.59741      24.5722)
R1^2/D10^2  : 4.84307        (-4.22197      5014.61)
kT2 [keV]   : 10.7479        (-2.64458      20.7351)
R2^2/D10^2  : 0.126431    (-0.125539   0.217113)
------------------------------------------------------------
#Fit statistic : Chi-Squared =          49.33 using 59 PHA bins.
# Reduced chi-squared =         0.8969 for     55 degrees of freedom
# Null hypothesis probability =   6.900706e-01

Energy  Fluence     90% Error
[keV]   [erg/cm2]   [erg/cm2]
15- 25  2.172e-07   1.126e-07
25- 50  2.944e-07   1.535e-07
50-150  1.608e-07   9.584e-08
15-150  6.724e-07   3.410e-07
S(25-50 keV) vs. S(50-100 keV) plot

S(25-50 keV)  = 2.53e-07
S(50-100 keV) = 1.99e-07
T90 vs. Hardness ratio plot

T90                                   = 26.5919999480247 sec.
Hardness ratio (energy fluence ratio) = 0.786561
Color vs. Color plot

Count Ratio  (25-50 keV) / (15-25 keV) = 1.22399
Count Ratio (50-100 keV) / (15-25 keV) = 0.320988
Mask shadow pattern (with DETECTION mask)

IMX = 0.465234641665, IMY = 0.943580991133
TIME vs. PHA plot around the beginning of event data (event_start to event_start+0.64s) with DETECTION mask
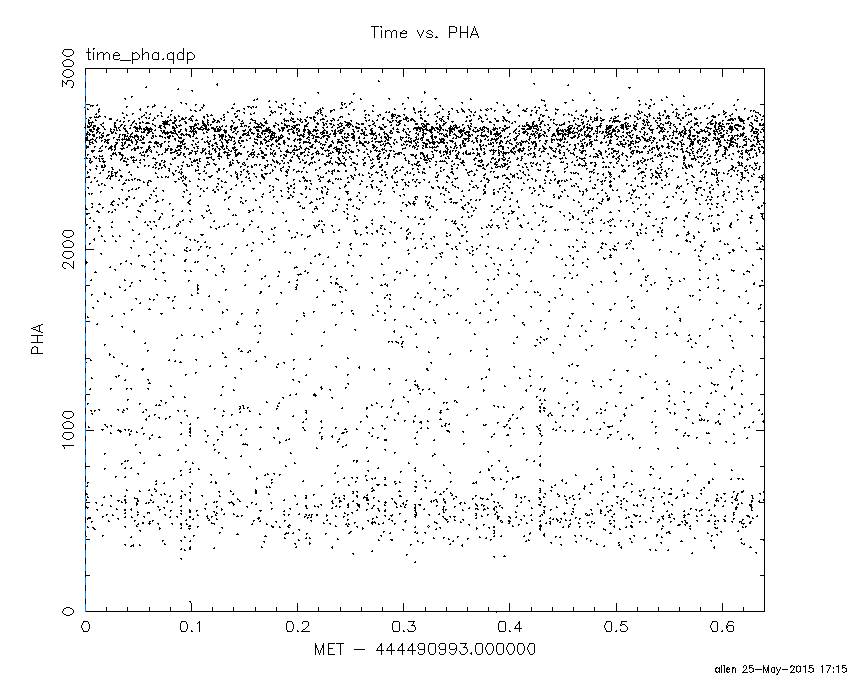
Blue+Cyan dotted lines: Time interval of the scaled map
From 0.000000 to 1.024000
TIME vs. DetID plot around the beginning of event data (event_start to event_start+0.64s) with DETECTION mask
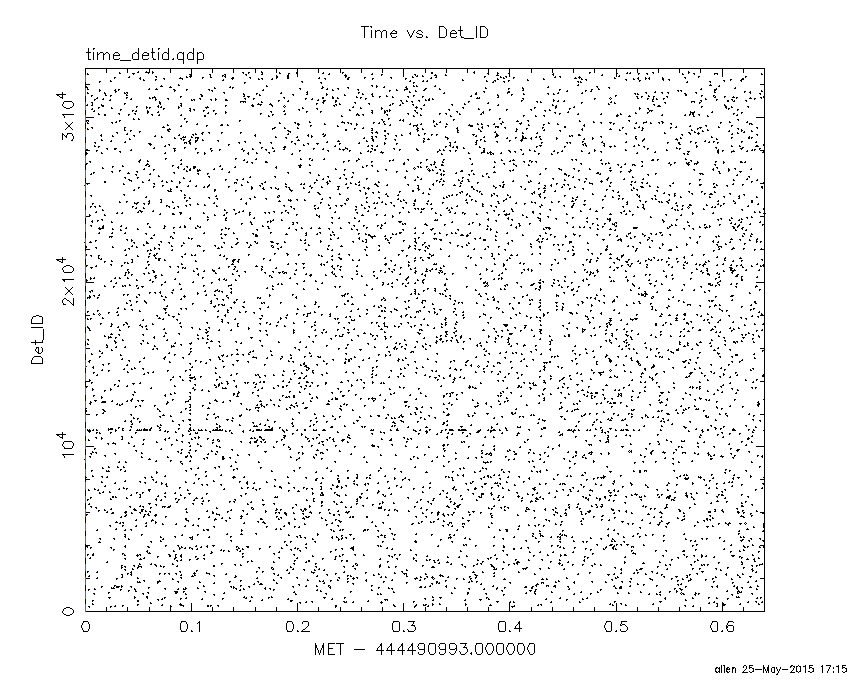
Blue+Cyan dotted lines: Time interval of the scaled map
From 0.000000 to 1.024000
100 us light curve (15-350 keV; (event_start to event_start+0.64s)

Blue+Cyan dotted lines: Time interval of the scaled map
From 0.000000 to 1.024000
Spacecraft aspect plot

Bright source in the event data image
Event data image of 15-350 keV band
Time interval of the image:
-3.328000 11.468580

# RAcent  DECcent POSerr Theta    Phi  PeakCts   SNR AngSep     Name
#  [deg]    [deg]    ['] [deg]  [deg]                   [']
135.3554 -40.3769    0.0  41.9  137.8   0.0826   0.6   13.3	Vela X-1
170.6851 -60.6323    0.0  50.5  177.6  -0.2488  -1.1   10.9	Cen X-3
186.7517 -62.8401    3.9  55.2 -174.4   0.8958   3.0    4.9	GX 301-2
100.2535 -12.1713    2.4  42.4   73.6   1.0792   4.7 ------	UNKNOWN
Webpage updated on:
Mon May 25 17:15:49 EDT 2015
