Special notes of this burst
Image
Pre-slew 15.0-350.0 keV image (Event data)

#   RAcent    DECcent   POSerr    Theta     Phi              Peak Cts       SNR   Name
  285.4911    47.3849   0.0075    20.5249   -94.3089         1.4508378     25.933 TRIG_00630876

Foreground time interval of the image:
 -0.296  19.480 (delta_t =  19.776 [sec])
Background time interval of the image:
-239.224  -0.296 (delta_t = 238.928 [sec])
Lightcurves
Notes:
- 1) The mask-weighted light curves are using the flight position.
- 2) Multiple plots of different time binning/intervals are shown to cover all scenarios of short/long GRBs, rate/image triggers, and real/false positives.
- 3) For all the mask-weighted lightcurves, the y-axis units are counts/sec/det where a det is 0.4 x 0.4 = 0.16 sq cm.
- 4) The verticle lines correspond to following: green dotted lines are T50 interval, black dotted lines are T90 interval, blue solid line(s) is a spacecraft slew start time, and orange solid line(s) is a spacecraft slew end time.
- 5) Time of each bin is in the middle of the bin.
1 s binning
From T0-310 s to T0+310 s

From T100_start - 20 s to T100_end + 30 s

Full time interval

64 ms binning
Full time interval

From T100_start to T100_end

From T0-5 sec to T0+5 sec

16 ms binning
From T100_start-5 s to T100_start+5 s

Blue+Cyan dotted lines: Time interval of the scaled map
From 0.000000 to 0.512000
8 ms binning
From T100_start-3 s to T100_start+3 s

Blue+Cyan dotted lines: Time interval of the scaled map
From 0.000000 to 0.512000
2 ms binning
From T100_start-1 s to T100_start+1 s

Blue+Cyan dotted lines: Time interval of the scaled map
From 0.000000 to 0.512000
SN=5 or 10 sec. binning (whichever binning is satisfied first)

SN=5 or 10 sec. binning (T < 200 sec)

Quad-rate summed light curves (from T0-300s to T0+1000s)

Spectral Evolution

Spectra
Notes:
- 1) The fitting includes the systematic errors.
- 2) When the burst includes telescope slew time periods, the fitting uses an average response file made from multiple 5-s response files through out the slew time plus single time preiod for the non-slew times, and weighted by the total counts in the corresponding time period using addrmf. An average response file is needed becuase a spectral fit using the pre-slew DRM will introduce some errors in both a spectral shape and a normalization if the PHA file contains a lot of the slew/post-slew time interval.
- 3) For fits to more complicated models (e.g. a power-law over a cutoff power-law), the BAT team has decided to require a chi-square improvement of more than 6 for each extra dof.
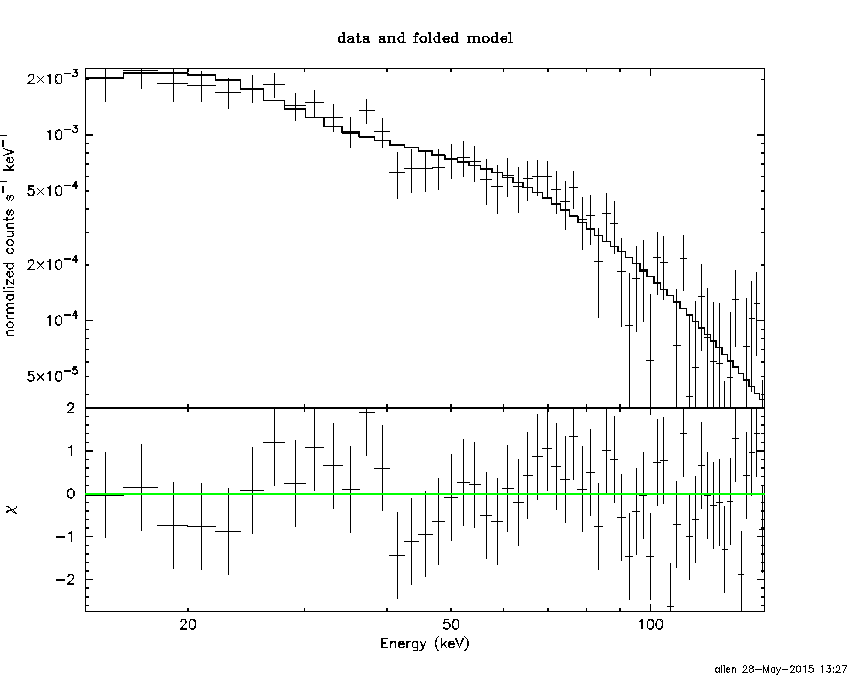
Time averaged spectrum fit using the average DRM
Power-law model

Time interval is from   -0.296 sec. to   19.480 sec.

Spectral model in power-law:
------------------------------------------------------------
Parameters  : value       lower 90%   higher 90%
Photon index: 1.49259     ( -0.106851   0.107551 )
Norm@50keV  : 4.79094E-03    ( -0.000291598   0.000290601 )
------------------------------------------------------------
#Fit statistic : Chi-Squared =          49.19 using 59 PHA bins.
# Reduced chi-squared =         0.8629 for     57 degrees of freedom
# Null hypothesis probability =   7.595896e-01

Photon flux (15-150 keV)    in 19.78 sec: 0.596914 ( -0.0361199  0.0361615 ) ph/cm2/s
Energy fluence (15-150 keV)             : 9.00083e-07 ( -6.03733e-08  6.07766e-08 ) ergs/cm2
Cutoff power-law model

Time interval is from   -0.296 sec. to   19.480 sec.
Spectral model in the cutoff power-law:
------------------------------------------------------------
Parameters  : value       lower 90%   higher 90%
Photon index: 1.28219     ( -0.431355   0.265955 )
Epeak [keV] : 171.848      (   )
Norm@50keV  : 6.10932E-03    (     )
------------------------------------------------------------
#Fit statistic : Chi-Squared =          48.38 using 59 PHA bins.
# Reduced chi-squared =         0.8640 for     56 degrees of freedom
# Null hypothesis probability =   7.553575e-01

Photon flux (15-150 keV)    in 19.78 sec: 0.590406 ( -0.038086  0.038061 ) ph/cm2/s
Energy fluence (15-150 keV)             : 8.85169e-07 ( -6.73549e-08  6.70918e-08 ) ergs/cm2
Band function

Time interval is from   -0.296 sec. to   19.480 sec.

Spectral model in the Band function:
------------------------------------------------------------
Parameters  : value       lower 90%   higher 90%
alpha       : -0.633221   ( 0.935309   0.935309 )
beta        : -1.57045    ( 1.55832   0.148663 )
Epeak [keV] : 52.5725      ( -52.6799 691.417 )
Norm@50keV   : 1.69621E-02    ( -0.016803   407915 )
------------------------------------------------------------
#Fit statistic : Chi-Squared =          48.12 using 59 PHA bins.
# Reduced chi-squared =         0.8749 for     55 degrees of freedom
# Null hypothesis probability =   7.327579e-01

Photon flux (15-150 keV)    in 19.78 sec:  (    ) ph/cm2/s
Energy fluence (15-150 keV)             : 0 ( 0  0 ) ergs/cm2
Single BB

Spectral model blackbody:
------------------------------------------------------------
Parameters  : value    Lower 90%  Upper 90%
kT [keV]    : 15.2583  (  )
R^2/D10^2   : 6.26417E-02  (   )
(R is the radius in km and D10 is the distance to the source in units of 10 kpc)
------------------------------------------------------------
#Fit statistic : Chi-Squared =         115.20 using 59 PHA bins.
# Reduced chi-squared =         2.0211 for     57 degrees of freedom
# Null hypothesis probability =   8.081170e-06

Energy  Fluence     90% Error
[keV]   [erg/cm2]   [erg/cm2]
15- 25  6.022e-08   7.002e-09
25- 50  2.430e-07   1.929e-08
50-150  3.879e-07   4.797e-08
15-150  6.912e-07   5.360e-08
Thermal bremsstrahlung (OTTB)

Spectral model: thermal bremsstrahlung
------------------------------------------------------------
Parameters  : value         Lower 90%    Upper 90%
kT [keV]    : 200.000       (      )
Norm        : 2.43371       (-0.144076     0.144077)
------------------------------------------------------------
#Fit statistic : Chi-Squared =          49.54 using 59 PHA bins.
# Reduced chi-squared =         0.8692 for     57 degrees of freedom
# Null hypothesis probability =   7.480221e-01

Energy  Fluence     90% Error
[keV]   [erg/cm2]   [erg/cm2]
15- 25  1.202e-07   8.693e-09
25- 50  2.312e-07   1.711e-08
50-150  5.072e-07   9.544e-08
15-150  8.586e-07   1.029e-07
Double BB

Spectral model: bbodyrad<1> + bbodyrad<2>
------------------------------------------------------------
Parameters  : value         Lower 90%    Upper 90%
kT1 [keV]   : 6.68314        (-1.15072      1.31818)
R1^2/D10^2  : 0.706731        (-0.320666      0.685593)
kT2 [keV]   : 25.7754        (-3.98507      6.28614)
R2^2/D10^2  : 8.25193E-03    (-0.00439024   0.00693865)
------------------------------------------------------------
#Fit statistic : Chi-Squared =          46.88 using 59 PHA bins.
# Reduced chi-squared =         0.8523 for     55 degrees of freedom
# Null hypothesis probability =   7.739185e-01

Energy  Fluence     90% Error
[keV]   [erg/cm2]   [erg/cm2]
15- 25  1.139e-07   3.039e-08
25- 50  2.259e-07   4.030e-08
50-150  5.400e-07   1.503e-07
15-150  8.798e-07   1.629e-07
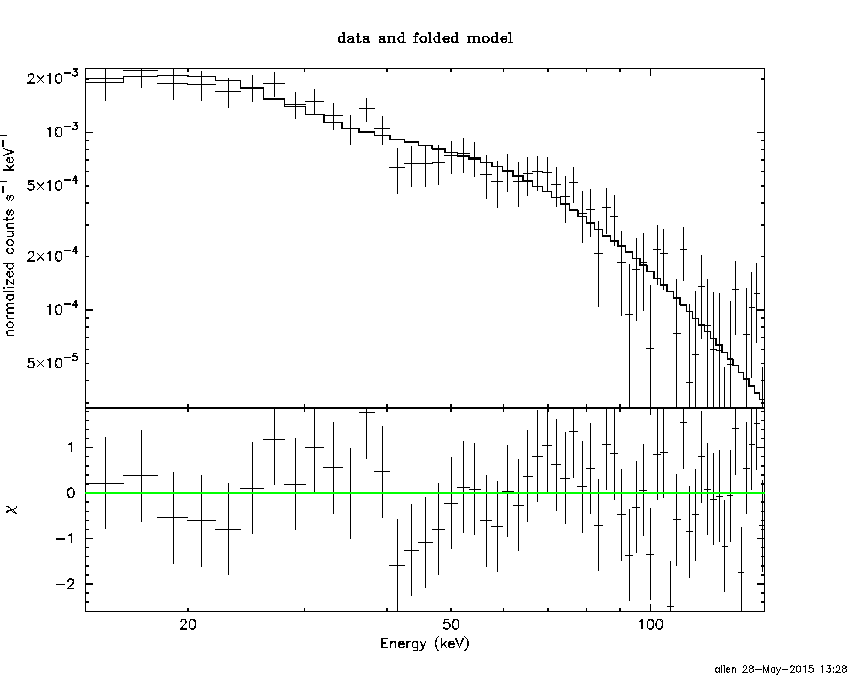
Peak spectrum fit
Power-law model

Time interval is from    0.828 sec. to    1.828 sec.

Spectral model in power-law:
------------------------------------------------------------
Parameters  : value       lower 90%   higher 90%
Photon index: 1.25949     ( -0.154234   0.153424 )
Norm@50keV  : 1.60366E-02    ( -0.00145105   0.00144809 )
------------------------------------------------------------
#Fit statistic : Chi-Squared =          62.76 using 59 PHA bins.
# Reduced chi-squared =          1.101 for     57 degrees of freedom
# Null hypothesis probability =   2.794857e-01

Photon flux (15-150 keV)    in 1 sec: 1.89965 ( -0.173207  0.173347 ) ph/cm2/s
Energy fluence (15-150 keV)             : 1.60092e-07 ( -1.63419e-08  1.64741e-08 ) ergs/cm2
Cutoff power-law model

Time interval is from    0.828 sec. to    1.828 sec.
Spectral model in the cutoff power-law:
------------------------------------------------------------
Parameters  : value       lower 90%   higher 90%
Photon index: 1.05484     ( -0.656394   0.285308 )
Epeak [keV] : 235.787      ( -235.868 -235.868 )
Norm@50keV  : 2.03312E-02    ( -0.00556783   0.0223217 )
------------------------------------------------------------
#Fit statistic : Chi-Squared =          62.42 using 59 PHA bins.
# Reduced chi-squared =          1.115 for     56 degrees of freedom
# Null hypothesis probability =   2.588426e-01

Photon flux (15-150 keV)    in 1 sec: 1.88638 ( -0.17773  0.17727 ) ph/cm2/s
Energy fluence (15-150 keV)             : 1.57739e-07 ( -1.8119e-08  1.7831e-08 ) ergs/cm2
Band function

Time interval is from    0.828 sec. to    1.828 sec.

Spectral model in the Band function:
------------------------------------------------------------
Parameters  : value       lower 90%   higher 90%
alpha       : 1.29644   ( -0.450813   -0.450813 )
beta        : -1.42793    ( 1.41363   0.223593 )
Epeak [keV] : 40.3864      ( -14.7535 186.053 )
Norm@50keV   : 0.774812    ( -0.898941   150.041 )
------------------------------------------------------------
#Fit statistic : Chi-Squared =          59.94 using 59 PHA bins.
# Reduced chi-squared =          1.090 for     55 degrees of freedom
# Null hypothesis probability =   3.011531e-01

Photon flux (15-150 keV)    in 1 sec:  (    ) ph/cm2/s
Energy fluence (15-150 keV)             : 0 ( 0  0 ) ergs/cm2
Single BB

Spectral model blackbody:
------------------------------------------------------------
Parameters  : value    Lower 90%  Upper 90%
kT [keV]    : 16.6447  (-1.95472  2.29573)
R^2/D10^2   : 0.158477  (-0.0558417   0.0832241)
(R is the radius in km and D10 is the distance to the source in units of 10 kpc)
------------------------------------------------------------
#Fit statistic : Chi-Squared =          88.54 using 59 PHA bins.
# Reduced chi-squared =          1.553 for     57 degrees of freedom
# Null hypothesis probability =   4.696096e-03

Energy  Fluence     90% Error
[keV]   [erg/cm2]   [erg/cm2]
15- 25  8.992e-09   1.545e-09
25- 50  3.911e-08   5.285e-09
50-150  7.683e-08   1.246e-08
15-150  1.249e-07   1.450e-08
Thermal bremsstrahlung (OTTB)

Spectral model: thermal bremsstrahlung
------------------------------------------------------------
Parameters  : value         Lower 90%    Upper 90%
kT [keV]    : 200.000       (      )
Norm        : 7.79426       (-0.709591     0.709566)
------------------------------------------------------------
#Fit statistic : Chi-Squared =          71.54 using 59 PHA bins.
# Reduced chi-squared =          1.255 for     57 degrees of freedom
# Null hypothesis probability =   9.304604e-02

Energy  Fluence     90% Error
[keV]   [erg/cm2]   [erg/cm2]
15- 25  1.941e-08   4.990e-09
25- 50  3.733e-08   1.457e-08
50-150  8.187e-08   3.803e-08
15-150  1.386e-07   6.766e-08
Double BB

Spectral model: bbodyrad<1> + bbodyrad<2>
------------------------------------------------------------
Parameters  : value         Lower 90%    Upper 90%
kT1 [keV]   : 9.17839        (-2.29342      2.8727)
R1^2/D10^2  : 0.803206        (-0.414247      1.00288)
kT2 [keV]   : 40.7334        (-15.7707      -42.2034)
R2^2/D10^2  : 6.59089E-03    (-0.00516804   0.0121495)
------------------------------------------------------------
#Fit statistic : Chi-Squared =          59.98 using 59 PHA bins.
# Reduced chi-squared =          1.091 for     55 degrees of freedom
# Null hypothesis probability =   3.000087e-01

Energy  Fluence     90% Error
[keV]   [erg/cm2]   [erg/cm2]
15- 25  1.470e-08   5.955e-09
25- 50  3.870e-08   1.419e-08
50-150  1.051e-07   5.149e-08
15-150  1.585e-07   6.932e-08
Pre-slew spectrum (Pre-slew PHA with pre-slew DRM)
Power-law model
Spectral model in power-law:
------------------------------------------------------------
Parameters  : value       lower 90%   higher 90%
Photon index: 1.49259     ( -0.106851   0.107551 )
Norm@50keV  : 4.79094E-03    ( -0.000291598   0.000290601 )
------------------------------------------------------------
#Fit statistic : Chi-Squared =          49.19 using 59 PHA bins.
# Reduced chi-squared =         0.8629 for     57 degrees of freedom
# Null hypothesis probability =   7.595896e-01

Photon flux (15-150 keV)    in 19.78 sec: 0.596914 ( -0.0361199  0.0361615 ) ph/cm2/s
Energy fluence (15-150 keV)             : 9.00083e-07 ( -6.03733e-08  6.07766e-08 ) ergs/cm2
Cutoff power-law model
Spectral model in the cutoff power-law:
------------------------------------------------------------
Parameters  : value       lower 90%   higher 90%
Photon index: 1.28219     ( -0.431355   0.265955 )
Epeak [keV] : 171.848      (   )
Norm@50keV  : 6.10932E-03    (     )
------------------------------------------------------------
#Fit statistic : Chi-Squared =          48.38 using 59 PHA bins.
# Reduced chi-squared =         0.8640 for     56 degrees of freedom
# Null hypothesis probability =   7.553575e-01

Photon flux (15-150 keV)    in 19.78 sec: 0.590406 ( -0.038086  0.038061 ) ph/cm2/s
Energy fluence (15-150 keV)             : 8.85169e-07 ( -6.73549e-08  6.70918e-08 ) ergs/cm2
Band function

Spectral model in the Band function:
------------------------------------------------------------
Parameters  : value       lower 90%   higher 90%
alpha       : -0.633221   ( 0.935309   0.935309 )
beta        : -1.57045    ( 1.55832   0.148668 )
Epeak [keV] : 52.5725      ( -52.6799 695.031 )
Norm@50keV   : 1.69621E-02    ( -0.016803   407915 )
------------------------------------------------------------
#Fit statistic : Chi-Squared =          48.12 using 59 PHA bins.
# Reduced chi-squared =         0.8749 for     55 degrees of freedom
# Null hypothesis probability =   7.327579e-01

Photon flux (15-150 keV)    in 19.78 sec:  (    ) ph/cm2/s
Energy fluence (15-150 keV)             : 0 ( 0  0 ) ergs/cm2
S(25-50 keV) vs. S(50-100 keV) plot

S(25-50 keV)  = 2.22e-07
S(50-100 keV) = 3.15e-07
T90 vs. Hardness ratio plot

T90                                   = 15.4880000352859 sec.
Hardness ratio (energy fluence ratio) = 1.41892
Color vs. Color plot

Count Ratio  (25-50 keV) / (15-25 keV) = 1.48818
Count Ratio (50-100 keV) / (15-25 keV) = 1.15903
Mask shadow pattern
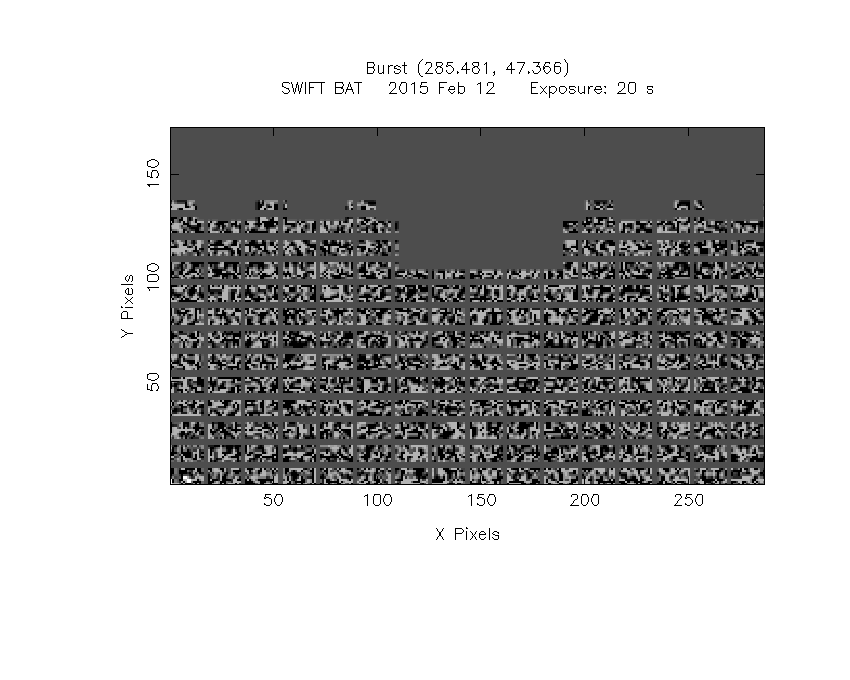
IMX = -2.812855980010357E-02, IMY = 3.733217457240708E-01
TIME vs. PHA plot around the trigger time

Blue+Cyan dotted lines: Time interval of the scaled map
From 0.000000 to 0.512000
TIME vs. DetID plot around the trigger time

Blue+Cyan dotted lines: Time interval of the scaled map
From 0.000000 to 0.512000
100 us light curve (15-350 keV)

Blue+Cyan dotted lines: Time interval of the scaled map
From 0.000000 to 0.512000
Spacecraft aspect plot

Bright source in the pre-burst/pre-slew/post-slew images
Pre-burst image of 15-350 keV band
Time interval of the image:
-239.224000 -0.296000

# RAcent  DECcent POSerr Theta    Phi  PeakCts   SNR AngSep     Name
#  [deg]    [deg]    ['] [deg]  [deg]                   [']
254.4621  35.3655    2.1  20.0  -13.5   1.0125   5.6    1.4	Her X-1
299.5619  35.2264    3.2  36.4  -89.8   2.0389   3.6    2.0	Cyg X-1
308.1079  41.0677    8.1  37.2 -104.6   0.7448   1.4    6.9	Cyg X-3
148.6109  73.0882    2.4  42.2  141.0   2.3280   4.8 ------	UNKNOWN
229.8842  27.8002    2.4  32.9   29.0   1.1288   4.7 ------	UNKNOWN
 33.6154  66.6898    4.1  54.1 -175.6   1.8896   3.3 ------	UNKNOWN
 33.6663  66.5227    4.0  54.2 -175.5   2.3375   3.9 ------	UNKNOWN
250.7563  10.6427    2.9  44.9   -8.7   1.1350   4.0 ------	UNKNOWN
321.9477  42.5494    2.9  44.0 -116.7   3.1052   4.0 ------	UNKNOWN
326.3319  44.0717    2.9  45.4 -121.3   3.1702   4.0 ------	UNKNOWN
Pre-slew background subtracted image of 15-350 keV band
Time interval of the image:
-0.296000 19.480000

# RAcent  DECcent POSerr Theta    Phi  PeakCts   SNR AngSep     Name
#  [deg]    [deg]    ['] [deg]  [deg]                   [']
254.5337  35.4560   18.8  19.9  -13.7   0.0281   0.6    7.8	Her X-1
299.5412  35.1610   13.1  36.5  -89.7  -0.1087  -0.9    3.4	Cyg X-1
307.9865  40.9247   21.3  37.2 -104.3   0.0644   0.5    5.9	Cyg X-3
 10.0311  71.6610    2.8  45.2 -170.7   0.3316   4.1 ------	UNKNOWN
285.4911  47.3849    0.4  20.5  -94.3   1.4507  25.9 ------	UNKNOWN
283.1896  43.4638    2.4  21.7  -83.0   0.2719   4.8 ------	UNKNOWN
308.6136  49.5152    2.3  32.4 -116.9   0.3529   4.9 ------	UNKNOWN
Post-slew image of 15-350 keV band
Time interval of the image:
337.876600 422.876000

# RAcent  DECcent POSerr Theta    Phi  PeakCts   SNR AngSep     Name
#  [deg]    [deg]    ['] [deg]  [deg]                   [']
254.5212  35.1435    4.7  26.1   25.0  -2.6852  -2.4   12.3	Her X-1
268.5411  -1.3943    8.7  51.0  -26.2   3.4258   1.3   11.0	SW J1753.5-0127
288.9160  11.0171    6.8  36.5  -53.9   2.7558   1.7    8.1	GRS 1915+105
299.6754  35.0681    8.6  16.3  -94.0  -1.3723  -1.3    9.0	Cyg X-1
308.1789  41.0101    6.0  17.4 -125.0  -2.0494  -1.9    4.6	Cyg X-3
326.1677  38.3140  204.2  30.8 -136.1  -0.0752  -0.1    0.5	Cyg X-2
277.2423  67.3413    2.8  20.4  122.7   4.4349   4.1 ------	UNKNOWN
327.8847  68.7809    3.6  29.9  161.2   3.6608   3.2 ------	UNKNOWN
266.2253  44.6534    2.6  13.6   37.2   3.9103   4.4 ------	UNKNOWN
262.6061  -5.3124    2.5  56.4  -20.5  17.8770   4.7 ------	UNKNOWN
290.5685   1.2534    2.1  46.4  -55.2  26.6171   5.5 ------	UNKNOWN
Plot creation:
Thu May 28 13:28:51 EDT 2015