Special notes of this burst
Image
Pre-slew 15.0-350.0 keV image (Event data)
#   RAcent    DECcent   POSerr    Theta     Phi              Peak Cts       SNR   Name
  244.2802   -48.7319   0.0154    16.1008    21.7106         0.1239649     12.484 TRIG_00632995

Foreground time interval of the image:
  0.000   0.560 (delta_t =   0.560 [sec])
Background time interval of the image:
-239.884   0.000 (delta_t = 239.884 [sec])
Lightcurves
Notes:
- 1) The mask-weighted light curves are using the flight position.
- 2) Multiple plots of different time binning/intervals are shown to cover all scenarios of short/long GRBs, rate/image triggers, and real/false positives.
- 3) For all the mask-weighted lightcurves, the y-axis units are counts/sec/det where a det is 0.4 x 0.4 = 0.16 sq cm.
- 4) The verticle lines correspond to following: green dotted lines are T50 interval, black dotted lines are T90 interval, blue solid line(s) is a spacecraft slew start time, and orange solid line(s) is a spacecraft slew end time.
- 5) Time of each bin is in the middle of the bin.
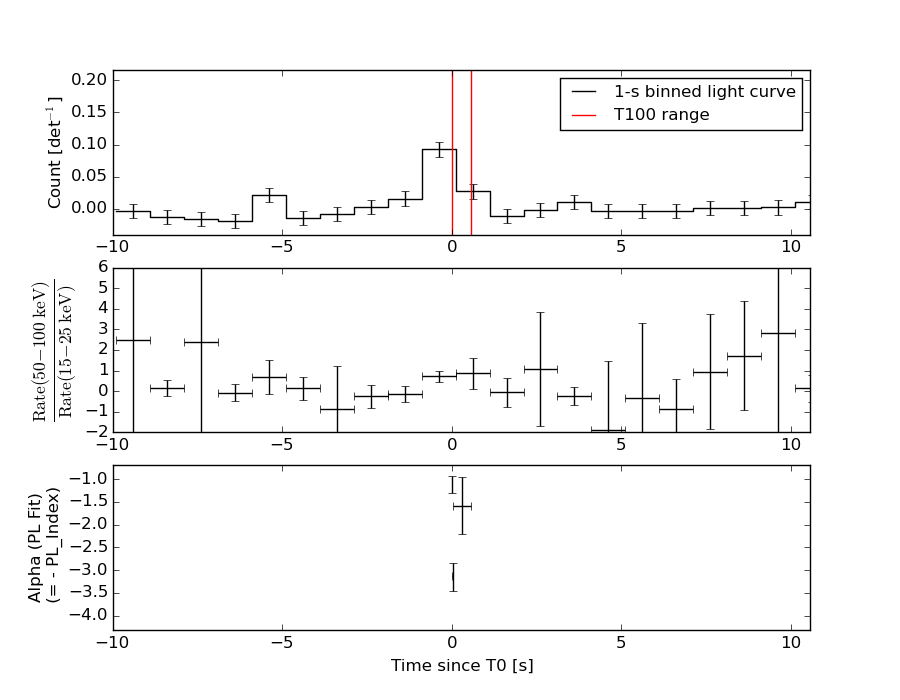
1 s binning
From T0-310 s to T0+310 s

From T100_start - 20 s to T100_end + 30 s
Full time interval
64 ms binning
Full time interval
From T100_start to T100_end

From T0-5 sec to T0+5 sec
16 ms binning
From T100_start-5 s to T100_start+5 s
Blue+Cyan dotted lines: Time interval of the scaled map
From 0.000000 to 0.032000
8 ms binning
From T100_start-3 s to T100_start+3 s
Blue+Cyan dotted lines: Time interval of the scaled map
From 0.000000 to 0.032000
2 ms binning
From T100_start-1 s to T100_start+1 s
Blue+Cyan dotted lines: Time interval of the scaled map
From 0.000000 to 0.032000
SN=5 or 10 sec. binning (whichever binning is satisfied first)
SN=5 or 10 sec. binning (T < 200 sec)
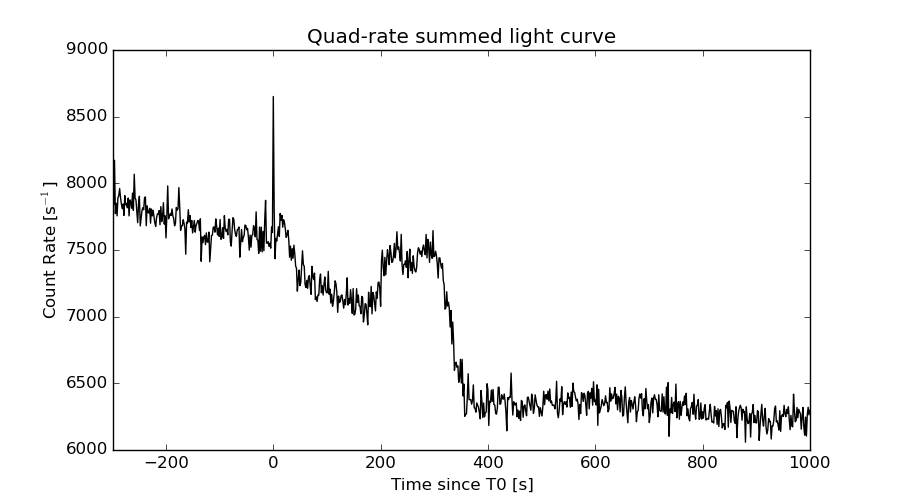
Quad-rate summed light curves (from T0-300s to T0+1000s)
Spectral Evolution
Spectra
Notes:
- 1) The fitting includes the systematic errors.
- 2) When the burst includes telescope slew time periods, the fitting uses an average response file made from multiple 5-s response files through out the slew time plus single time preiod for the non-slew times, and weighted by the total counts in the corresponding time period using addrmf. An average response file is needed becuase a spectral fit using the pre-slew DRM will introduce some errors in both a spectral shape and a normalization if the PHA file contains a lot of the slew/post-slew time interval.
- 3) For fits to more complicated models (e.g. a power-law over a cutoff power-law), the BAT team has decided to require a chi-square improvement of more than 6 for each extra dof.
Time averaged spectrum fit using the average DRM
Power-law model

Time interval is from    0.000 sec. to    0.560 sec.

Spectral model in power-law:
------------------------------------------------------------
Parameters  : value       lower 90%   higher 90%
Photon index: 1.44013     ( -0.23317   0.23122 )
Norm@50keV  : 1.37091E-02    ( -0.00173368   0.00172683 )
------------------------------------------------------------
#Fit statistic : Chi-Squared =          53.93 using 59 PHA bins.
# Reduced chi-squared =         0.9461 for     57 degrees of freedom
# Null hypothesis probability =   5.909914e-01

Photon flux (15-150 keV)    in 0.56 sec: 1.68538 ( -0.21791  0.218708 ) ph/cm2/s
Energy fluence (15-150 keV)             : 7.35991e-08 ( -1.02301e-08  1.035e-08 ) ergs/cm2
Cutoff power-law model

Time interval is from    0.000 sec. to    0.560 sec.
Spectral model in the cutoff power-law:
------------------------------------------------------------
Parameters  : value       lower 90%   higher 90%
Photon index: 1.44114     ( -0.627442   0.228896 )
Epeak [keV] : 9999.27      ( -9999.36 -9999.36 )
Norm@50keV  : 1.37487E-02    ( -0.0108119   0.0139601 )
------------------------------------------------------------
#Fit statistic : Chi-Squared =          53.94 using 59 PHA bins.
# Reduced chi-squared =         0.9632 for     56 degrees of freedom
# Null hypothesis probability =   5.533153e-01

Photon flux (15-150 keV)    in 0.56 sec: 1.68742 ( -0.22032  0.21608 ) ph/cm2/s
Energy fluence (15-150 keV)             : 7.32323e-08 ( -9.97192e-09  1.05185e-08 ) ergs/cm2
Band function
Time interval is from    0.000 sec. to    0.560 sec.

Spectral model in the Band function:
------------------------------------------------------------
Parameters  : value       lower 90%   higher 90%
alpha       : 4.81982   ( -4.81982   -4.81982 )
beta        : -1.48246    ( -0.259544   0.24914 )
Epeak [keV] : 22.0987      ( -22.0987 7.67335 )
Norm@50keV   : 2128.55    ( -264.679   7.00699e+06 )
------------------------------------------------------------
#Fit statistic : Chi-Squared =          53.57 using 59 PHA bins.
# Reduced chi-squared =         0.9740 for     55 degrees of freedom
# Null hypothesis probability =   5.293100e-01

Photon flux (15-150 keV)    in 0.56 sec:  (    ) ph/cm2/s
Energy fluence (15-150 keV)             : 0 ( 0  0 ) ergs/cm2
Single BB
Spectral model blackbody:
------------------------------------------------------------
Parameters  : value    Lower 90%  Upper 90%
kT [keV]    : 15.1402  (-2.51196  3.349)
R^2/D10^2   : 0.179853  (-0.0897298   0.163106)
(R is the radius in km and D10 is the distance to the source in units of 10 kpc)
------------------------------------------------------------
#Fit statistic : Chi-Squared =          74.41 using 59 PHA bins.
# Reduced chi-squared =          1.305 for     57 degrees of freedom
# Null hypothesis probability =   6.056801e-02

Energy  Fluence     90% Error
[keV]   [erg/cm2]   [erg/cm2]
15- 25  4.826e-09   1.261e-09
25- 50  1.934e-08   4.088e-09
50-150  3.029e-08   7.773e-09
15-150  5.446e-08   9.699e-09
Thermal bremsstrahlung (OTTB)
Spectral model: thermal bremsstrahlung
------------------------------------------------------------
Parameters  : value         Lower 90%    Upper 90%
kT [keV]    : 200.000       (      )
Norm        : 6.92627       (-0.866402     0.866325)
------------------------------------------------------------
#Fit statistic : Chi-Squared =          55.55 using 59 PHA bins.
# Reduced chi-squared =         0.9746 for     57 degrees of freedom
# Null hypothesis probability =   5.295214e-01

Energy  Fluence     90% Error
[keV]   [erg/cm2]   [erg/cm2]
15- 25  9.661e-09   5.432e-09
25- 50  1.859e-08   1.025e-08
50-150  4.076e-08   2.244e-08
15-150  6.901e-08   3.833e-08
Double BB
Spectral model: bbodyrad<1> + bbodyrad<2>
------------------------------------------------------------
Parameters  : value         Lower 90%    Upper 90%
kT1 [keV]   : 8.18561        (-3.05761      1.74922)
R1^2/D10^2  : 1.17130        (-0.788006      4.67807)
kT2 [keV]   : 44.1588        (-21.5791      -44.4843)
R2^2/D10^2  : 4.55991E-03    (-0.00426177   0.018973)
------------------------------------------------------------
#Fit statistic : Chi-Squared =          54.37 using 59 PHA bins.
# Reduced chi-squared =         0.9885 for     55 degrees of freedom
# Null hypothesis probability =   4.987376e-01

Energy  Fluence     90% Error
[keV]   [erg/cm2]   [erg/cm2]
15- 25  8.677e-09   4.841e-09
25- 50  1.890e-08   8.620e-09
50-150  4.914e-08   2.649e-08
15-150  7.671e-08   3.574e-08
Peak spectrum fit
Power-law model

Time interval is from   -0.220 sec. to    0.780 sec.

Spectral model in power-law:
------------------------------------------------------------
Parameters  : value       lower 90%   higher 90%
Photon index: 1.60652     ( -0.2892   0.293618 )
Norm@50keV  : 7.49984E-03    ( -0.00126236   0.00124054 )
------------------------------------------------------------
#Fit statistic : Chi-Squared =          46.88 using 59 PHA bins.
# Reduced chi-squared =         0.8225 for     57 degrees of freedom
# Null hypothesis probability =   8.281827e-01

Photon flux (15-150 keV)    in 1 sec: 0.965718 ( -0.154762  0.155225 ) ph/cm2/s
Energy fluence (15-150 keV)             : 7.00846e-08 ( -1.25364e-08  1.27955e-08 ) ergs/cm2
Cutoff power-law model
Time interval is from   -0.220 sec. to    0.780 sec.
Spectral model in the cutoff power-law:
------------------------------------------------------------
Parameters  : value       lower 90%   higher 90%
Photon index: 1.60468     ( -1.10554   1.27153 )
Epeak [keV] : 9996.18      (   )
Norm@50keV  : 7.51742E-03    ( -0.00127027   0.0240853 )
------------------------------------------------------------
#Fit statistic : Chi-Squared =          46.88 using 59 PHA bins.
# Reduced chi-squared =         0.8372 for     56 degrees of freedom
# Null hypothesis probability =   8.021939e-01

Photon flux (15-150 keV)    in 1 sec: 0.965618 ( -0.160145  0.152012 ) ph/cm2/s
Energy fluence (15-150 keV)             : 7.00012e-08 ( -7.263e-09  1.28016e-08 ) ergs/cm2
Band function
Time interval is from   -0.220 sec. to    0.780 sec.

Spectral model in the Band function:
------------------------------------------------------------
Parameters  : value       lower 90%   higher 90%
alpha       : 4.63767   ( -4.63767   -4.63767 )
beta        : -1.68107    ( -0.354694   0.321171 )
Epeak [keV] : 22.9538      ( -22.9538 8.5925 )
Norm@50keV   : 784.543    ( -122.801   5.72993e+06 )
------------------------------------------------------------
#Fit statistic : Chi-Squared =          46.45 using 59 PHA bins.
# Reduced chi-squared =         0.8445 for     55 degrees of freedom
# Null hypothesis probability =   7.874126e-01

Photon flux (15-150 keV)    in 1 sec:  (    ) ph/cm2/s
Energy fluence (15-150 keV)             : 0 ( 0  0 ) ergs/cm2
Single BB
Spectral model blackbody:
------------------------------------------------------------
Parameters  : value    Lower 90%  Upper 90%
kT [keV]    : 12.7951  (-2.45137  3.28168)
R^2/D10^2   : 0.183537  (-0.103837   0.218211)
(R is the radius in km and D10 is the distance to the source in units of 10 kpc)
------------------------------------------------------------
#Fit statistic : Chi-Squared =          57.89 using 59 PHA bins.
# Reduced chi-squared =          1.016 for     57 degrees of freedom
# Null hypothesis probability =   4.420942e-01

Energy  Fluence     90% Error
[keV]   [erg/cm2]   [erg/cm2]
15- 25  6.373e-09   2.111e-09
25- 50  2.157e-08   5.430e-09
50-150  2.212e-08   8.005e-09
15-150  5.007e-08   1.211e-08
Thermal bremsstrahlung (OTTB)
Spectral model: thermal bremsstrahlung
------------------------------------------------------------
Parameters  : value         Lower 90%    Upper 90%
kT [keV]    : 180.998       (      )
Norm        : 3.91087       (-0.632158     0.890898)
------------------------------------------------------------
#Fit statistic : Chi-Squared =          47.20 using 59 PHA bins.
# Reduced chi-squared =         0.8280 for     57 degrees of freedom
# Null hypothesis probability =   8.194477e-01

Energy  Fluence     90% Error
[keV]   [erg/cm2]   [erg/cm2]
15- 25  9.776e-09   5.540e-09
25- 50  1.869e-08   1.031e-08
50-150  4.030e-08   2.241e-08
15-150  6.877e-08   3.826e-08
Double BB
Spectral model: bbodyrad<1> + bbodyrad<2>
------------------------------------------------------------
Parameters  : value         Lower 90%    Upper 90%
kT1 [keV]   : 7.73730        (-3.24421      3.52768)
R1^2/D10^2  : 0.867476        (-0.612384      4.8403)
kT2 [keV]   : 36.5608        (-32.3224      -36.8309)
R2^2/D10^2  : 3.73940E-03    (-0.00333988   0.0442384)
------------------------------------------------------------
#Fit statistic : Chi-Squared =          46.82 using 59 PHA bins.
# Reduced chi-squared =         0.8512 for     55 degrees of freedom
# Null hypothesis probability =   7.758914e-01

Energy  Fluence     90% Error
[keV]   [erg/cm2]   [erg/cm2]
15- 25  9.837e-09   5.535e-09
25- 50  1.966e-08   1.046e-08
50-150  4.235e-08   2.467e-08
15-150  7.185e-08   3.664e-08
Pre-slew spectrum (Pre-slew PHA with pre-slew DRM)
Power-law model

Spectral model in power-law:
------------------------------------------------------------
Parameters  : value       lower 90%   higher 90%
Photon index: 1.44013     ( -0.23317   0.23122 )
Norm@50keV  : 1.37091E-02    ( -0.00173368   0.00172683 )
------------------------------------------------------------
#Fit statistic : Chi-Squared =          53.93 using 59 PHA bins.
# Reduced chi-squared =         0.9461 for     57 degrees of freedom
# Null hypothesis probability =   5.909914e-01

Photon flux (15-150 keV)    in 0.56 sec: 1.68538 ( -0.21791  0.218708 ) ph/cm2/s
Energy fluence (15-150 keV)             : 7.35991e-08 ( -1.02301e-08  1.035e-08 ) ergs/cm2
Cutoff power-law model

Spectral model in the cutoff power-law:
------------------------------------------------------------
Parameters  : value       lower 90%   higher 90%
Photon index: 1.44114     ( -0.627442   0.228896 )
Epeak [keV] : 9999.27      ( -9999.36 -9999.36 )
Norm@50keV  : 1.37487E-02    ( -0.0108887   0.0139601 )
------------------------------------------------------------
#Fit statistic : Chi-Squared =          53.94 using 59 PHA bins.
# Reduced chi-squared =         0.9632 for     56 degrees of freedom
# Null hypothesis probability =   5.533153e-01

Photon flux (15-150 keV)    in 0.56 sec: 1.68742 ( -0.22032  0.21608 ) ph/cm2/s
Energy fluence (15-150 keV)             : 7.32323e-08 ( -9.97192e-09  1.05185e-08 ) ergs/cm2
Band function

Spectral model in the Band function:
------------------------------------------------------------
Parameters  : value       lower 90%   higher 90%
alpha       : 4.81982   ( -4.81982   -4.81982 )
beta        : -1.48246    ( -0.259544   0.24914 )
Epeak [keV] : 22.0987      ( -22.0987 7.67335 )
Norm@50keV   : 2128.55    ( -264.679   7.00699e+06 )
------------------------------------------------------------
#Fit statistic : Chi-Squared =          53.57 using 59 PHA bins.
# Reduced chi-squared =         0.9740 for     55 degrees of freedom
# Null hypothesis probability =   5.293100e-01

Photon flux (15-150 keV)    in 0.56 sec:  (    ) ph/cm2/s
Energy fluence (15-150 keV)             : 0 ( 0  0 ) ergs/cm2
S(25-50 keV) vs. S(50-100 keV) plot
S(25-50 keV)  = 1.77e-08
S(50-100 keV) = 2.60e-08
T90 vs. Hardness ratio plot

T90                                   = 0.483999967575073 sec.
Hardness ratio (energy fluence ratio) = 1.46893
Color vs. Color plot
Count Ratio  (25-50 keV) / (15-25 keV) = 1.15218
Count Ratio (50-100 keV) / (15-25 keV) = 0.879347
Mask shadow pattern

IMX = 2.681746765815812E-01, IMY = -1.067771607370521E-01
TIME vs. PHA plot around the trigger time
Blue+Cyan dotted lines: Time interval of the scaled map
From 0.000000 to 0.032000
TIME vs. DetID plot around the trigger time
Blue+Cyan dotted lines: Time interval of the scaled map
From 0.000000 to 0.032000
100 us light curve (15-350 keV)
Blue+Cyan dotted lines: Time interval of the scaled map
From 0.000000 to 0.032000
Spacecraft aspect plot

Bright source in the pre-burst/pre-slew/post-slew images
Pre-burst image of 15-350 keV band
Time interval of the image:
-239.884000 0.000000

# RAcent  DECcent POSerr Theta    Phi  PeakCts   SNR AngSep     Name
#  [deg]    [deg]    ['] [deg]  [deg]                   [']
186.8257 -62.5685    7.9  49.8   27.5   1.3143   1.5   13.0	GX 301-2
244.9951 -15.6438    0.3  21.7  143.9  10.3645  42.0    0.9	Sco X-1
255.9964 -37.8422    0.7   2.8   -9.1   3.8330  17.8    0.5	4U 1700-377
256.4931 -36.4027    1.6   1.4  -28.0   1.5642   7.1    3.0	GX 349+2
262.9192 -24.7252    3.2  12.0 -154.4   0.8676   3.7    5.0	GX 1+4
264.5326 -44.5092    8.1  11.5  -39.4  -0.3310  -1.4    9.7	4U 1735-44
268.3444  -1.4855   12.8  35.6 -165.0   0.2814   0.9    2.4	SW J1753.5-0127
270.2649 -25.2125    7.9  15.9 -131.4   0.3754   1.6    8.1	GX 5-1
270.3191 -25.7116    5.5  15.6 -129.8   0.6163   2.5    2.1	GRS 1758-258
274.0064 -14.0359    2.8  26.6 -144.4   1.0604   4.0    0.0	GX 17+2
275.9979 -30.4071    4.9  17.5 -106.6   0.5931   2.4    4.5	H1820-303
285.0812 -24.9359   14.4  27.1 -110.7   0.2785   0.8    2.6	HT1900.1-2455
263.1775 -33.6930    0.0   6.2 -107.7   0.5929   2.6   12.7	GX 354-0
270.9836 -34.3155    2.2  12.4  -96.0   1.2220   5.2 ------	UNKNOWN
282.6026 -69.4234    2.7  37.4  -21.9   1.2566   4.3 ------	UNKNOWN
312.9517 -46.2110    3.2  43.7  -64.0   4.3807   3.6 ------	UNKNOWN
Pre-slew background subtracted image of 15-350 keV band
Time interval of the image:
0.000000 0.560000

# RAcent  DECcent POSerr Theta    Phi  PeakCts   SNR AngSep     Name
#  [deg]    [deg]    ['] [deg]  [deg]                   [']
186.6559 -62.8316    3.4  49.9   27.1  -0.1313  -3.4    3.7	GX 301-2
245.0919 -15.8023    9.0  21.6  143.9  -0.0132  -1.3   11.7	Sco X-1
255.9178 -37.9887    3.6   2.9   -7.7  -0.0295  -3.2    9.3	4U 1700-377
256.6052 -36.2875    5.3   1.4  -33.3  -0.0202  -2.2   11.5	GX 349+2
262.8606 -24.8009   12.5  11.9 -154.4   0.0086   0.9    8.7	GX 1+4
264.5506 -44.5974    8.2  11.6  -39.1   0.0127   1.4   12.1	4U 1735-44
268.3668  -1.3034    3.9  35.7 -165.0   0.0344   2.9    8.9	SW J1753.5-0127
270.2029 -25.0460   18.7  15.9 -131.9  -0.0058  -0.6    4.8	GX 5-1
270.3485 -25.8381    9.8  15.5 -129.4   0.0111   1.2    6.2	GRS 1758-258
274.0741 -14.1837    5.2  26.6 -144.1   0.0237   2.2    9.7	GX 17+2
276.0894 -30.2729    7.4  17.7 -106.9  -0.0158  -1.6   10.2	H1820-303
284.8933 -24.7970  246.6  27.1 -111.2   0.0006   0.0   10.7	HT1900.1-2455
263.1614 -33.9911    0.0   6.1 -105.0   0.0187   2.0   12.7	GX 354-0
244.2801 -48.7319    0.9  16.1   21.7   0.1240  12.5 ------	UNKNOWN
258.7123 -17.8667    2.3  17.4 -177.7   0.0475   5.0 ------	UNKNOWN
 10.0730 -84.0385    2.3  57.5  -13.2   0.2163   5.1 ------	UNKNOWN
Post-slew image of 15-350 keV band
Time interval of the image:
47.216600 179.016600

# RAcent  DECcent POSerr Theta    Phi  PeakCts   SNR AngSep     Name
#  [deg]    [deg]    ['] [deg]  [deg]                   [']
170.1116 -60.8051   28.8  42.0   34.2   0.1393   0.4   12.5	Cen X-3
186.8127 -62.8824    3.6  33.9   33.2   0.7333   3.2    8.0	GX 301-2
244.9678 -15.6362    0.4  33.1  170.7   5.7362  28.9    0.7	Sco X-1
255.9832 -37.8308    1.9  13.8 -148.3   0.9275   6.1    0.8	4U 1700-377
256.3792 -36.4182    3.6  15.1 -150.3   0.4977   3.2    2.7	GX 349+2
262.9499 -24.7019    5.3  28.1 -152.4   0.3327   2.2    4.2	GX 1+4
264.7075 -44.4470   24.6  14.6 -109.7  -0.0702  -0.5    1.5	4U 1735-44
268.3963  -1.4530   81.2  51.6 -159.0   0.0561   0.1    1.7	SW J1753.5-0127
270.4098 -24.9347    0.0  31.3 -140.3   0.7171   3.7   11.0	GX 5-1
270.2405 -25.7896    6.7  30.5 -139.6   0.3247   1.7    4.4	GRS 1758-258
274.0046 -14.0375   22.3  42.4 -145.0   0.1430   0.5    0.1	GX 17+2
275.9371 -30.4097    6.1  30.1 -126.1   0.3967   1.9    2.6	H1820-303
285.1472 -24.7924    5.0  39.8 -122.4   0.7367   2.3    9.8	HT1900.1-2455
262.8264 -33.9817    0.0  20.1 -140.6   0.3015   2.2   12.0	GX 354-0
191.5128 -37.5391    3.5  39.3   75.8   2.2112   3.3 ------	UNKNOWN
157.9671 -55.4762    3.2  50.0   37.2   3.0416   3.6 ------	UNKNOWN
227.4586  -2.7410    3.1  48.2  146.7   2.3335   3.8 ------	UNKNOWN
122.8623 -69.2730    2.7  54.5   11.4   3.1651   4.2 ------	UNKNOWN
120.5436 -73.1069    2.2  52.2    7.4   2.5600   5.4 ------	UNKNOWN
Plot creation:
Thu May 28 13:23:28 EDT 2015