Special notes of this burst
Image
Pre-slew 15.0-350.0 keV image (Event data)
#   RAcent    DECcent   POSerr    Theta     Phi              Peak Cts       SNR   Name
   11.3161    41.8559   0.0184    21.9008  -103.8776         0.4924719     10.524 TRIG_00633105

Foreground time interval of the image:
 -0.596  14.940 (delta_t =  15.536 [sec])
Background time interval of the image:
-239.392  -0.596 (delta_t = 238.796 [sec])
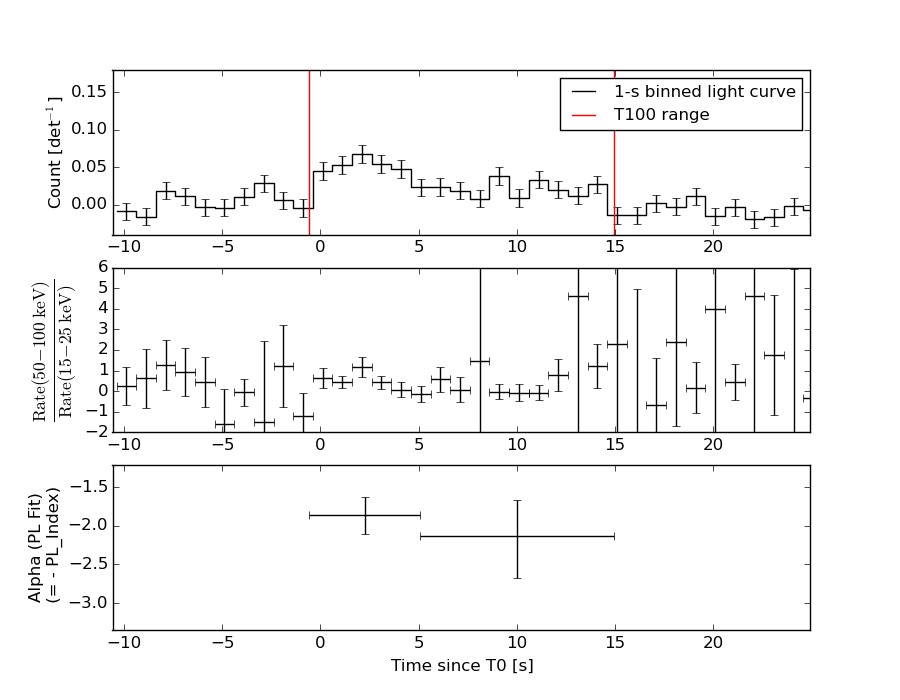
Lightcurves
Notes:
- 1) The mask-weighted light curves are using the flight position.
- 2) Multiple plots of different time binning/intervals are shown to cover all scenarios of short/long GRBs, rate/image triggers, and real/false positives.
- 3) For all the mask-weighted lightcurves, the y-axis units are counts/sec/det where a det is 0.4 x 0.4 = 0.16 sq cm.
- 4) The verticle lines correspond to following: green dotted lines are T50 interval, black dotted lines are T90 interval, blue solid line(s) is a spacecraft slew start time, and orange solid line(s) is a spacecraft slew end time.
- 5) Time of each bin is in the middle of the bin.
1 s binning
From T0-310 s to T0+310 s
From T100_start - 20 s to T100_end + 30 s
Full time interval
64 ms binning
Full time interval
From T100_start to T100_end
From T0-5 sec to T0+5 sec
16 ms binning
From T100_start-5 s to T100_start+5 s
Blue+Cyan dotted lines: Time interval of the scaled map
From 0.000000 to 4.096000
8 ms binning
From T100_start-3 s to T100_start+3 s
Blue+Cyan dotted lines: Time interval of the scaled map
From 0.000000 to 4.096000
2 ms binning
From T100_start-1 s to T100_start+1 s
Blue+Cyan dotted lines: Time interval of the scaled map
From 0.000000 to 4.096000
SN=5 or 10 sec. binning (whichever binning is satisfied first)
SN=5 or 10 sec. binning (T < 200 sec)

Quad-rate summed light curves (from T0-300s to T0+1000s)

Spectral Evolution
Spectra
Notes:
- 1) The fitting includes the systematic errors.
- 2) When the burst includes telescope slew time periods, the fitting uses an average response file made from multiple 5-s response files through out the slew time plus single time preiod for the non-slew times, and weighted by the total counts in the corresponding time period using addrmf. An average response file is needed becuase a spectral fit using the pre-slew DRM will introduce some errors in both a spectral shape and a normalization if the PHA file contains a lot of the slew/post-slew time interval.
- 3) For fits to more complicated models (e.g. a power-law over a cutoff power-law), the BAT team has decided to require a chi-square improvement of more than 6 for each extra dof.
Time averaged spectrum fit using the average DRM
Power-law model
Time interval is from   -0.596 sec. to   14.940 sec.

Spectral model in power-law:
------------------------------------------------------------
Parameters  : value       lower 90%   higher 90%
Photon index: 1.96269     ( -0.236262   0.252464 )
Norm@50keV  : 1.83862E-03    ( -0.000337573   0.000332145 )
------------------------------------------------------------
#Fit statistic : Chi-Squared =          80.85 using 59 PHA bins.
# Reduced chi-squared =          1.419 for     57 degrees of freedom
# Null hypothesis probability =   2.056080e-02

Photon flux (15-150 keV)    in 15.54 sec: 0.271165 ( -0.0389326  0.0389354 ) ph/cm2/s
Energy fluence (15-150 keV)             : 2.63013e-07 ( -4.56275e-08  4.72581e-08 ) ergs/cm2
Cutoff power-law model

Time interval is from   -0.596 sec. to   14.940 sec.
Spectral model in the cutoff power-law:
------------------------------------------------------------
Parameters  : value       lower 90%   higher 90%
Photon index: -0.893459     ( -2.15487   1.55838 )
Epeak [keV] : 38.0901      ( -5.17062 7.0252 )
Norm@50keV  : 0.101874    ( -0.112724   2.25803 )
------------------------------------------------------------
#Fit statistic : Chi-Squared =          68.40 using 59 PHA bins.
# Reduced chi-squared =          1.221 for     56 degrees of freedom
# Null hypothesis probability =   1.236737e-01

Photon flux (15-150 keV)    in 15.54 sec: 0.257187 ( -0.037999  0.038297 ) ph/cm2/s
Energy fluence (15-150 keV)             : 2.14413e-07 ( -3.65516e-08  4.22626e-08 ) ergs/cm2
Band function
Time interval is from   -0.596 sec. to   14.940 sec.

Spectral model in the Band function:
------------------------------------------------------------
Parameters  : value       lower 90%   higher 90%
alpha       : 1.14653   ( -2.15237   -1.43592 )
beta        : -9.99649    ( 9.99649   19.9949 )
Epeak [keV] : 37.8436      ( -4.94776 7.25079 )
Norm@50keV   : 0.147729    ( -0.0202652   2.27633 )
------------------------------------------------------------
#Fit statistic : Chi-Squared =          68.40 using 59 PHA bins.
# Reduced chi-squared =          1.244 for     55 degrees of freedom
# Null hypothesis probability =   1.057903e-01

Photon flux (15-150 keV)    in 15.54 sec:  (    ) ph/cm2/s
Energy fluence (15-150 keV)             : 0 ( 0  0 ) ergs/cm2
Single BB
Spectral model blackbody:
------------------------------------------------------------
Parameters  : value    Lower 90%  Upper 90%
kT [keV]    : 9.68645  (-1.20657  1.38511)
R^2/D10^2   : 0.156886  (-0.0635147   0.104165)
(R is the radius in km and D10 is the distance to the source in units of 10 kpc)
------------------------------------------------------------
#Fit statistic : Chi-Squared =          68.71 using 59 PHA bins.
# Reduced chi-squared =          1.205 for     57 degrees of freedom
# Null hypothesis probability =   1.376292e-01

Energy  Fluence     90% Error
[keV]   [erg/cm2]   [erg/cm2]
15- 25  4.605e-08   1.125e-08
25- 50  1.094e-07   2.131e-08
50-150  5.201e-08   1.874e-08
15-150  2.074e-07   3.908e-08
Thermal bremsstrahlung (OTTB)

Spectral model: thermal bremsstrahlung
------------------------------------------------------------
Parameters  : value         Lower 90%    Upper 90%
kT [keV]    : 60.2720       (-18.9188      34.22)
Norm        : 1.45594       (-0.291875     0.353683)
------------------------------------------------------------
#Fit statistic : Chi-Squared =          74.72 using 59 PHA bins.
# Reduced chi-squared =          1.311 for     57 degrees of freedom
# Null hypothesis probability =   5.768717e-02

Energy  Fluence     90% Error
[keV]   [erg/cm2]   [erg/cm2]
15- 25  5.691e-08   1.126e-08
25- 50  8.673e-08   1.559e-08
50-150  9.905e-08   3.616e-08
15-150  2.427e-07   6.235e-08
Double BB

Spectral model: bbodyrad<1> + bbodyrad<2>
------------------------------------------------------------
Parameters  : value         Lower 90%    Upper 90%
kT1 [keV]   : 6.42842        (-6.42842      -6.42842)
R1^2/D10^2  : 0.210338        (-0.210338      -0.210338)
kT2 [keV]   : 11.0771        (-11.0771      -11.0771)
R2^2/D10^2  : 7.27146E-02    (-0.0727146   0.179181)
------------------------------------------------------------
#Fit statistic : Chi-Squared =          68.35 using 59 PHA bins.
# Reduced chi-squared =          1.243 for     55 degrees of freedom
# Null hypothesis probability =   1.066751e-01

Energy  Fluence     90% Error
[keV]   [erg/cm2]   [erg/cm2]
15- 25  4.870e-08   8.065e-08
25- 50  1.055e-07   1.937e-07
50-150  6.041e-08   4.216e-07
15-150  2.146e-07   8.500e-07
Peak spectrum fit
Power-law model

Time interval is from    1.324 sec. to    2.324 sec.

Spectral model in power-law:
------------------------------------------------------------
Parameters  : value       lower 90%   higher 90%
Photon index: 1.46191     ( -0.379459   0.383754 )
Norm@50keV  : 5.09848E-03    ( -0.00126602   0.00125511 )
------------------------------------------------------------
#Fit statistic : Chi-Squared =          48.09 using 59 PHA bins.
# Reduced chi-squared =         0.8437 for     57 degrees of freedom
# Null hypothesis probability =   7.936336e-01

Photon flux (15-150 keV)    in 1 sec: 0.630183 ( -0.153319  0.153653 ) ph/cm2/s
Energy fluence (15-150 keV)             : 4.86841e-08 ( -1.29536e-08  1.32642e-08 ) ergs/cm2
Cutoff power-law model

Time interval is from    1.324 sec. to    2.324 sec.
Spectral model in the cutoff power-law:
------------------------------------------------------------
Parameters  : value       lower 90%   higher 90%
Photon index: -0.262598     ( -3.30844   1.80025 )
Epeak [keV] : 61.0838      ( -17.5835 -61.0836 )
Norm@50keV  : 4.23545E-02    ( -0.0423554   2.42891 )
------------------------------------------------------------
#Fit statistic : Chi-Squared =          45.49 using 59 PHA bins.
# Reduced chi-squared =         0.8123 for     56 degrees of freedom
# Null hypothesis probability =   8.410853e-01

Photon flux (15-150 keV)    in 1 sec: 0.600714 ( -0.158291  0.157866 ) ph/cm2/s
Energy fluence (15-150 keV)             : 4.28979e-08 ( -1.32296e-08  1.46998e-08 ) ergs/cm2
Band function
Time interval is from    1.324 sec. to    2.324 sec.

Spectral model in the Band function:
------------------------------------------------------------
Parameters  : value       lower 90%   higher 90%
alpha       : 1.05722   ( -3.53208   3.93533 )
beta        : -2.48105    ( 2.47671   1.12562 )
Epeak [keV] : 52.0177      ( -29.5717 74.9247 )
Norm@50keV   : 0.127816    ( -0.117174   31.7023 )
------------------------------------------------------------
#Fit statistic : Chi-Squared =          45.17 using 59 PHA bins.
# Reduced chi-squared =         0.8213 for     55 degrees of freedom
# Null hypothesis probability =   8.250546e-01

Photon flux (15-150 keV)    in 1 sec:  (    ) ph/cm2/s
Energy fluence (15-150 keV)             : 4.42218e-08 ( 0  0 ) ergs/cm2
Single BB

Spectral model blackbody:
------------------------------------------------------------
Parameters  : value    Lower 90%  Upper 90%
kT [keV]    : 13.9380  (-3.07498  4.31663)
R^2/D10^2   : 0.100010  (-0.0623501   0.14312)
(R is the radius in km and D10 is the distance to the source in units of 10 kpc)
------------------------------------------------------------
#Fit statistic : Chi-Squared =          46.14 using 59 PHA bins.
# Reduced chi-squared =         0.8095 for     57 degrees of freedom
# Null hypothesis probability =   8.476374e-01

Energy  Fluence     90% Error
[keV]   [erg/cm2]   [erg/cm2]
15- 25  4.106e-09   1.947e-09
25- 50  1.520e-08   6.988e-09
50-150  1.940e-08   1.022e-08
15-150  3.871e-08   1.623e-08
Thermal bremsstrahlung (OTTB)

Spectral model: thermal bremsstrahlung
------------------------------------------------------------
Parameters  : value         Lower 90%    Upper 90%
kT [keV]    : 199.330       (-120.377      -199.351)
Norm        : 2.61820       (-0.624417     0.625648)
------------------------------------------------------------
#Fit statistic : Chi-Squared =          47.28 using 59 PHA bins.
# Reduced chi-squared =         0.8295 for     57 degrees of freedom
# Null hypothesis probability =   8.170723e-01

Energy  Fluence     90% Error
[keV]   [erg/cm2]   [erg/cm2]
15- 25  6.520e-09   3.945e-09
25- 50  1.254e-08   7.410e-09
50-150  2.750e-08   1.611e-08
15-150  4.657e-08   2.742e-08
Double BB
Spectral model: bbodyrad<1> + bbodyrad<2>
------------------------------------------------------------
Parameters  : value         Lower 90%    Upper 90%
kT1 [keV]   : 11.2363        (-11.2208      3.04837)
R1^2/D10^2  : 0.169837        (-0.170096      -0.170096)
kT2 [keV]   : 34.5587        (-34.3969      -34.3969)
R2^2/D10^2  : 1.77935E-03    (-0.0018217   0.201668)
------------------------------------------------------------
#Fit statistic : Chi-Squared =          45.14 using 59 PHA bins.
# Reduced chi-squared =         0.8208 for     55 degrees of freedom
# Null hypothesis probability =   8.258725e-01

Energy  Fluence     90% Error
[keV]   [erg/cm2]   [erg/cm2]
15- 25  4.801e-09   3.264e-09
25- 50  1.504e-08   1.048e-08
50-150  2.503e-08   1.784e-08
15-150  4.487e-08   2.911e-08
Pre-slew spectrum (Pre-slew PHA with pre-slew DRM)
Power-law model

Spectral model in power-law:
------------------------------------------------------------
Parameters  : value       lower 90%   higher 90%
Photon index: 1.96269     ( -0.236262   0.252464 )
Norm@50keV  : 1.83862E-03    ( -0.000337573   0.000332145 )
------------------------------------------------------------
#Fit statistic : Chi-Squared =          80.85 using 59 PHA bins.
# Reduced chi-squared =          1.419 for     57 degrees of freedom
# Null hypothesis probability =   2.056080e-02

Photon flux (15-150 keV)    in 15.54 sec: 0.271165 ( -0.0389326  0.0389354 ) ph/cm2/s
Energy fluence (15-150 keV)             : 2.63013e-07 ( -4.56275e-08  4.72581e-08 ) ergs/cm2
Cutoff power-law model

Spectral model in the cutoff power-law:
------------------------------------------------------------
Parameters  : value       lower 90%   higher 90%
Photon index: -0.893459     ( -2.15487   1.55838 )
Epeak [keV] : 38.0901      ( -5.17062 7.0252 )
Norm@50keV  : 0.101874    ( -0.112724   2.25803 )
------------------------------------------------------------
#Fit statistic : Chi-Squared =          68.40 using 59 PHA bins.
# Reduced chi-squared =          1.221 for     56 degrees of freedom
# Null hypothesis probability =   1.236737e-01

Photon flux (15-150 keV)    in 15.54 sec: 0.257187 ( -0.037999  0.038297 ) ph/cm2/s
Energy fluence (15-150 keV)             : 2.14413e-07 ( -3.65516e-08  4.22626e-08 ) ergs/cm2
Band function

Spectral model in the Band function:
------------------------------------------------------------
Parameters  : value       lower 90%   higher 90%
alpha       : 1.14653   ( -2.15237   -1.43592 )
beta        : -9.99649    ( 9.99649   19.9949 )
Epeak [keV] : 37.8436      ( -4.94776 7.25079 )
Norm@50keV   : 0.147729    ( -0.0202652   2.27633 )
------------------------------------------------------------
#Fit statistic : Chi-Squared =          68.40 using 59 PHA bins.
# Reduced chi-squared =          1.244 for     55 degrees of freedom
# Null hypothesis probability =   1.057903e-01

Photon flux (15-150 keV)    in 15.54 sec:  (    ) ph/cm2/s
Energy fluence (15-150 keV)             : 0 ( 0  0 ) ergs/cm2
S(25-50 keV) vs. S(50-100 keV) plot

S(25-50 keV)  = 7.83e-08
S(50-100 keV) = 8.03e-08
T90 vs. Hardness ratio plot

T90                                   = 13.9719999432564 sec.
Hardness ratio (energy fluence ratio) = 1.02554
Color vs. Color plot
Count Ratio  (25-50 keV) / (15-25 keV) = 1.0886
Count Ratio (50-100 keV) / (15-25 keV) = 0.37804
Mask shadow pattern
IMX = -9.642222847631825E-02, IMY = 3.902786785566854E-01
TIME vs. PHA plot around the trigger time
Blue+Cyan dotted lines: Time interval of the scaled map
From 0.000000 to 4.096000
TIME vs. DetID plot around the trigger time

Blue+Cyan dotted lines: Time interval of the scaled map
From 0.000000 to 4.096000
100 us light curve (15-350 keV)

Blue+Cyan dotted lines: Time interval of the scaled map
From 0.000000 to 4.096000
Spacecraft aspect plot
Bright source in the pre-burst/pre-slew/post-slew images
Pre-burst image of 15-350 keV band
Time interval of the image:
-239.392000 -0.596000

# RAcent  DECcent POSerr Theta    Phi  PeakCts   SNR AngSep     Name
#  [deg]    [deg]    ['] [deg]  [deg]                   [']
308.0886  40.9774    3.8  49.5  -32.1   1.4818   3.1    1.8	Cyg X-3
326.2901  38.1780    6.3  43.2  -49.8   1.0037   1.8   10.3	Cyg X-2
Pre-slew background subtracted image of 15-350 keV band
Time interval of the image:
-0.596000 14.940000

# RAcent  DECcent POSerr Theta    Phi  PeakCts   SNR AngSep     Name
#  [deg]    [deg]    ['] [deg]  [deg]                   [']
308.1508  40.8471   35.9  49.6  -32.3  -0.0362  -0.3    6.6	Cyg X-3
326.0370  38.2073   10.8  43.3  -49.6   0.1159   1.1    9.3	Cyg X-2
 68.3765  77.1142    2.1  20.4   69.7   0.2519   5.5 ------	UNKNOWN
 64.9275  15.0486    2.7  54.0  176.7   0.6258   4.3 ------	UNKNOWN
 11.3161  41.8559    1.1  21.9 -103.9   0.4924  10.5 ------	UNKNOWN
Post-slew image of 15-350 keV band
Time interval of the image:
82.708590 702.175600
703.608000 720.308590

# RAcent  DECcent POSerr Theta    Phi  PeakCts   SNR AngSep     Name
#  [deg]    [deg]    ['] [deg]  [deg]                   [']
299.6555  35.1293   10.0  54.9  -17.3  -1.4274  -1.1    5.4	Cyg X-1
308.2269  41.0640   10.9  46.2  -14.4   0.7017   1.1    8.5	Cyg X-3
326.0474  38.2078    6.9  34.5  -26.4   0.8609   1.7    9.0	Cyg X-2
 54.0995  71.8876    2.8  36.4   75.2   3.9668   4.2 ------	UNKNOWN
316.8447  66.7219    3.3  38.4   23.1   1.9283   3.5 ------	UNKNOWN
334.7397  49.1921    2.7  26.4   -7.0   1.5875   4.2 ------	UNKNOWN
Plot creation:
Thu May 28 13:21:21 EDT 2015