Click here for the BAT GCN circular template
Image
Pre-slew 15-350 keV image (Event data; bkg subtracted)

#   RAcent  DECcent POSerr  Theta    Phi     Peak Cts     SNR  Name
   83.9743 +21.7403 0.0076   32.9  -28.7       2.6661    25.5  TRIG_00635792
------------------------------------------

Foreground time interval of the image:
  0.000  64.000 (delta_t =  64.000 [sec])
Background time interval of the image:
Lightcurves
Notes:
- 1) All plots contain as much data as has been downloaded to date.
- 2) The mask-weighted light curves are using the flight position.
- 3) Multiple plots of different time binning/intervals are shown to cover all scenarios of short/long GRBs, rate/image triggers, and real/false positives.
- 4) For all the mask-weighted lightcurves, the y-axis units are counts/sec/det where a det is 0.4 x 0.4 = 0.16 sq cm.
- 5) The verticle lines correspond to following: green dotted lines are T50 interval, black dotted lines are T90 interval, blue solid line(s) is a spacecraft slew start time, and orange solid line(s) is a spacecraft slew end time.
- 6) Time of each bin is in the middle of the bin.
1 s binning
From T0-310 s to T0+310 s

From T100_start - 20 s to T100_end + 30 s

Full time interval

64 ms binning
Full time interval

From T100_start to T100_end

From T0-5 sec to T0+5 sec

16 ms binning
From T100_start-5 s to T100_start+5 s

Blue+Cyan dotted lines: Time interval of the scaled map
From 0.000000 to 64.000000
8 ms binning
From T100_start-3 s to T100_start+3 s

Blue+Cyan dotted lines: Time interval of the scaled map
From 0.000000 to 64.000000
2 ms binning
From T100_start-1 s to T100_start+1 s

Blue+Cyan dotted lines: Time interval of the scaled map
From 0.000000 to 64.000000
SN=5 or 10 sec. binning (whichever binning is satisfied first)

SN=5 or 10 sec. binning (T < 200 sec)

Spectra
Notes:
- 1) The fitting includes the systematic errors.
- 2) For long bursts, a spectral fit of the pre-slew DRM will introduce some errors in both a spectral shape and a normalization if the PHA file contains a lot of the slew/post-slew time interval.
- 3) For fits to more complicated models (e.g. a power-law over a cutoff power-law), the BAT team has decided to require a chi-square improvement of more than 6 for each extra dof.
- 4) For short bursts (T90<1sec), the specrtum is also fit with Blackbody, OTTB, and Double Blackbody.
Time averaged spectrum fit using the pre-slew DRM
Power-law model

Time interval is from    0.000 sec. to   64.000 sec.

Spectral model in power-law:
------------------------------------------------------------
Parameters  : value       lower 90%   higher 90%
Photon index: 2.13297     ( -0.129237   0.134036 )
Norm@50keV  : 2.36826E-03    ( -0.00019627   0.000192942 )
------------------------------------------------------------
#Fit statistic : Chi-Squared =          58.52 using 59 PHA bins.
# Reduced chi-squared =          1.027 for     57 degrees of freedom
# Null hypothesis probability =   4.193101e-01

Photon flux (15-150 keV)    in 64 sec: 0.378767 ( -0.0249796  0.0250372 ) ph/cm2/s
Energy fluence (15-150 keV)             : 1.41307e-06 ( -1.03874e-07  1.04986e-07 ) ergs/cm2
Cutoff power-law model

Time interval is from    0.000 sec. to   64.000 sec.
Spectral model in the cutoff power-law:
------------------------------------------------------------
Parameters  : value       lower 90%   higher 90%
Photon index: 1.95364     ( -0.516397   0.0245982 )
Epeak [keV] : 11.4537      ( -9.17817 -9.33313 )
Norm@50keV  : 2.98220E-03    (     )
------------------------------------------------------------
#Fit statistic : Chi-Squared =          58.19 using 59 PHA bins.
# Reduced chi-squared =          1.039 for     56 degrees of freedom
# Null hypothesis probability =   3.947179e-01

Photon flux (15-150 keV)    in 64 sec: 0.375430 ( -0.026674  0.026672 ) ph/cm2/s
Energy fluence (15-150 keV)             : 1.39092e-06 ( -1.22426e-07  1.20499e-07 ) ergs/cm2
Band function

Time interval is from    0.000 sec. to   64.000 sec.

Spectral model in the Band function:
------------------------------------------------------------
Parameters  : value       lower 90%   higher 90%
alpha       : -1.96349   ( 1.90458   0.105408 )
beta        : -10.0000    ( 10   20 )
Epeak [keV] : 9.32432      ( -5.12737 27.7381 )
Norm@50keV   : 2.94570E-03    ( -0.00045807   0.00276788 )
------------------------------------------------------------
#Fit statistic : Chi-Squared =          58.19 using 59 PHA bins.
# Reduced chi-squared =          1.058 for     55 degrees of freedom
# Null hypothesis probability =   3.588039e-01

Photon flux (15-150 keV)    in 64 sec:  (    ) ph/cm2/s
Energy fluence (15-150 keV)             : 1.38805e-06 ( 0  0 ) ergs/cm2
Single BB

Spectral model blackbody:
------------------------------------------------------------
Parameters  : value    Lower 90%  Upper 90%
kT [keV]    : 9.38446  (  )
R^2/D10^2   : 0.211362  (   )
(R is the radius in km and D10 is the distance to the source in units of 10 kpc)
------------------------------------------------------------
#Fit statistic : Chi-Squared =         117.44 using 59 PHA bins.
# Reduced chi-squared =         2.0603 for     57 degrees of freedom
# Null hypothesis probability =   4.413945e-06

Energy  Fluence     90% Error
[keV]   [erg/cm2]   [erg/cm2]
15- 25  2.367e-07   2.835e-08
25- 50  5.363e-07   4.086e-08
50-150  2.322e-07   4.566e-08
15-150  1.005e-06   7.840e-08
Thermal bremsstrahlung (OTTB)

Spectral model: thermal bremsstrahlung
------------------------------------------------------------
Parameters  : value         Lower 90%    Upper 90%
kT [keV]    : 57.7462       (-10.5074      13.8933)
Norm        : 1.97468       (-0.23147     0.249884)
------------------------------------------------------------
#Fit statistic : Chi-Squared =          62.16 using 59 PHA bins.
# Reduced chi-squared =          1.091 for     57 degrees of freedom
# Null hypothesis probability =   2.975974e-01

Energy  Fluence     90% Error
[keV]   [erg/cm2]   [erg/cm2]
15- 25  3.156e-07   2.986e-08
25- 50  4.746e-07   3.411e-08
50-150  5.229e-07   9.120e-08
15-150  1.313e-06   1.088e-07
Double BB

Spectral model: bbodyrad<1> + bbodyrad<2>
------------------------------------------------------------
Parameters  : value         Lower 90%    Upper 90%
kT1 [keV]   : 5.85353        (-0.930067      0.950666)
R1^2/D10^2  : 1.04992        (-0.452873      1.01324)
kT2 [keV]   : 21.2043        (-4.30456      6.83018)
R2^2/D10^2  : 6.09836E-03    (-0.00397492   0.00922367)
------------------------------------------------------------
#Fit statistic : Chi-Squared =          58.55 using 59 PHA bins.
# Reduced chi-squared =          1.065 for     55 degrees of freedom
# Null hypothesis probability =   3.465621e-01

Energy  Fluence     90% Error
[keV]   [erg/cm2]   [erg/cm2]
15- 25  3.280e-07   7.562e-08
25- 50  4.494e-07   8.160e-08
50-150  5.956e-07   2.763e-07
15-150  1.373e-06   3.536e-07
Peak spectrum fit
Power-law model

Time interval is from    0.000 sec. to   64.000 sec.

Spectral model in power-law:
------------------------------------------------------------
Parameters  : value       lower 90%   higher 90%
Photon index: 2.13297     ( -0.129237   0.134036 )
Norm@50keV  : 2.36826E-03    ( -0.00019627   0.000192942 )
------------------------------------------------------------
#Fit statistic : Chi-Squared =          58.52 using 59 PHA bins.
# Reduced chi-squared =          1.027 for     57 degrees of freedom
# Null hypothesis probability =   4.193101e-01

Photon flux (15-150 keV)    in 64 sec: 0.378767 ( -0.0249796  0.0250372 ) ph/cm2/s
Energy fluence (15-150 keV)             : 1.41307e-06 ( -1.03874e-07  1.04986e-07 ) ergs/cm2
Cutoff power-law model

Time interval is from    0.000 sec. to   64.000 sec.
Spectral model in the cutoff power-law:
------------------------------------------------------------
Parameters  : value       lower 90%   higher 90%
Photon index: 1.95364     ( -0.516397   0.0245982 )
Epeak [keV] : 11.4537      ( -9.17817 -9.33313 )
Norm@50keV  : 2.98220E-03    (     )
------------------------------------------------------------
#Fit statistic : Chi-Squared =          58.19 using 59 PHA bins.
# Reduced chi-squared =          1.039 for     56 degrees of freedom
# Null hypothesis probability =   3.947179e-01

Photon flux (15-150 keV)    in 64 sec: 0.375430 ( -0.026674  0.026672 ) ph/cm2/s
Energy fluence (15-150 keV)             : 1.39092e-06 ( -1.22426e-07  1.20499e-07 ) ergs/cm2
Band function

Time interval is from    0.000 sec. to   64.000 sec.

Spectral model in the Band function:
------------------------------------------------------------
Parameters  : value       lower 90%   higher 90%
alpha       : -1.96349   ( 1.90458   0.105408 )
beta        : -10.0000    ( 10   20 )
Epeak [keV] : 9.32432      ( -5.12737 27.7381 )
Norm@50keV   : 2.94570E-03    ( -0.00045807   0.00276788 )
------------------------------------------------------------
#Fit statistic : Chi-Squared =          58.19 using 59 PHA bins.
# Reduced chi-squared =          1.058 for     55 degrees of freedom
# Null hypothesis probability =   3.588039e-01

Photon flux (15-150 keV)    in 64 sec:  (    ) ph/cm2/s
Energy fluence (15-150 keV)             : 1.38805e-06 ( 0  0 ) ergs/cm2
Single BB
Spectral model blackbody:
------------------------------------------------------------
Parameters  : value    Lower 90%  Upper 90%
kT [keV]    : 9.38446  (  )
R^2/D10^2   : 0.211362  (   )
(R is the radius in km and D10 is the distance to the source in units of 10 kpc)
------------------------------------------------------------
#Fit statistic : Chi-Squared =         117.44 using 59 PHA bins.
# Reduced chi-squared =         2.0603 for     57 degrees of freedom
# Null hypothesis probability =   4.413945e-06

Energy  Fluence     90% Error
[keV]   [erg/cm2]   [erg/cm2]
15- 25  2.367e-07   2.758e-08
25- 50  5.363e-07   3.955e-08
50-150  2.322e-07   4.381e-08
15-150  1.005e-06   7.968e-08
Thermal bremsstrahlung (OTTB)

Spectral model: thermal bremsstrahlung
------------------------------------------------------------
Parameters  : value         Lower 90%    Upper 90%
kT [keV]    : 57.7462       (-10.5074      13.8933)
Norm        : 1.97468       (-0.23147     0.249884)
------------------------------------------------------------
#Fit statistic : Chi-Squared =          62.16 using 59 PHA bins.
# Reduced chi-squared =          1.091 for     57 degrees of freedom
# Null hypothesis probability =   2.975974e-01

Energy  Fluence     90% Error
[keV]   [erg/cm2]   [erg/cm2]
15- 25  3.156e-07   2.838e-08
25- 50  4.746e-07   3.226e-08
50-150  5.229e-07   8.432e-08
15-150  1.313e-06   9.920e-08
Double BB
Spectral model: bbodyrad<1> + bbodyrad<2>
------------------------------------------------------------
Parameters  : value         Lower 90%    Upper 90%
kT1 [keV]   : 5.85353        (-0.930067      0.950666)
R1^2/D10^2  : 1.04992        (-0.452873      1.01324)
kT2 [keV]   : 21.2043        (-4.30456      6.83018)
R2^2/D10^2  : 6.09836E-03    (-0.00397492   0.00922367)
------------------------------------------------------------
#Fit statistic : Chi-Squared =          58.55 using 59 PHA bins.
# Reduced chi-squared =          1.065 for     55 degrees of freedom
# Null hypothesis probability =   3.465621e-01

Energy  Fluence     90% Error
[keV]   [erg/cm2]   [erg/cm2]
15- 25  3.280e-07   6.950e-08
25- 50  4.494e-07   8.448e-08
50-150  5.956e-07   2.605e-07
15-150  1.373e-06   3.989e-07
Pre-slew spectrum (Pre-slew PHA with pre-slew DRM)
Power-law model

Spectral model in power-law:
------------------------------------------------------------
Parameters  : value       lower 90%   higher 90%
Photon index: 2.13297     ( -0.129237   0.134036 )
Norm@50keV  : 2.36826E-03    ( -0.00019627   0.000192942 )
------------------------------------------------------------
#Fit statistic : Chi-Squared =          58.52 using 59 PHA bins.
# Reduced chi-squared =          1.027 for     57 degrees of freedom
# Null hypothesis probability =   4.193101e-01

Photon flux (15-150 keV)    in 64 sec: 0.378767 ( -0.0249796  0.0250372 ) ph/cm2/s
Energy fluence (15-150 keV)             : 1.41307e-06 ( -1.03874e-07  1.04986e-07 ) ergs/cm2
Cutoff power-law model

Spectral model in the cutoff power-law:
------------------------------------------------------------
Parameters  : value       lower 90%   higher 90%
Photon index: 1.95364     ( -0.516397   0.0245982 )
Epeak [keV] : 11.4537      ( -9.17817 -9.33313 )
Norm@50keV  : 2.98220E-03    (     )
------------------------------------------------------------
#Fit statistic : Chi-Squared =          58.19 using 59 PHA bins.
# Reduced chi-squared =          1.039 for     56 degrees of freedom
# Null hypothesis probability =   3.947179e-01

Photon flux (15-150 keV)    in 64 sec: 0.375430 ( -0.026674  0.026672 ) ph/cm2/s
Energy fluence (15-150 keV)             : 1.39092e-06 ( -1.22426e-07  1.20499e-07 ) ergs/cm2
Band function
Spectral model in the Band function:
------------------------------------------------------------
Parameters  : value       lower 90%   higher 90%
alpha       : -1.96349   ( 1.90458   0.105408 )
beta        : -10.0000    ( 10   20 )
Epeak [keV] : 9.32432      ( -5.12737 27.7381 )
Norm@50keV   : 2.94570E-03    ( -0.00045807   0.00276788 )
------------------------------------------------------------
#Fit statistic : Chi-Squared =          58.19 using 59 PHA bins.
# Reduced chi-squared =          1.058 for     55 degrees of freedom
# Null hypothesis probability =   3.588039e-01

Photon flux (15-150 keV)    in 64 sec:  (    ) ph/cm2/s
Energy fluence (15-150 keV)             : 1.38805e-06 ( 0  0 ) ergs/cm2
S(25-50 keV) vs. S(50-100 keV) plot

S(25-50 keV)  = 4.41e-07
S(50-100 keV) = 4.02e-07
T90 vs. Hardness ratio plot

T90                                   = 64 sec.
Hardness ratio (energy fluence ratio) = 0.911565
Color vs. Color plot

Count Ratio  (25-50 keV) / (15-25 keV) = 0.977293
Count Ratio (50-100 keV) / (15-25 keV) = 0.460023
Mask shadow pattern
IMX = 5.682792559916134E-01, IMY = 3.109311830416506E-01
TIME vs. PHA plot around the trigger time
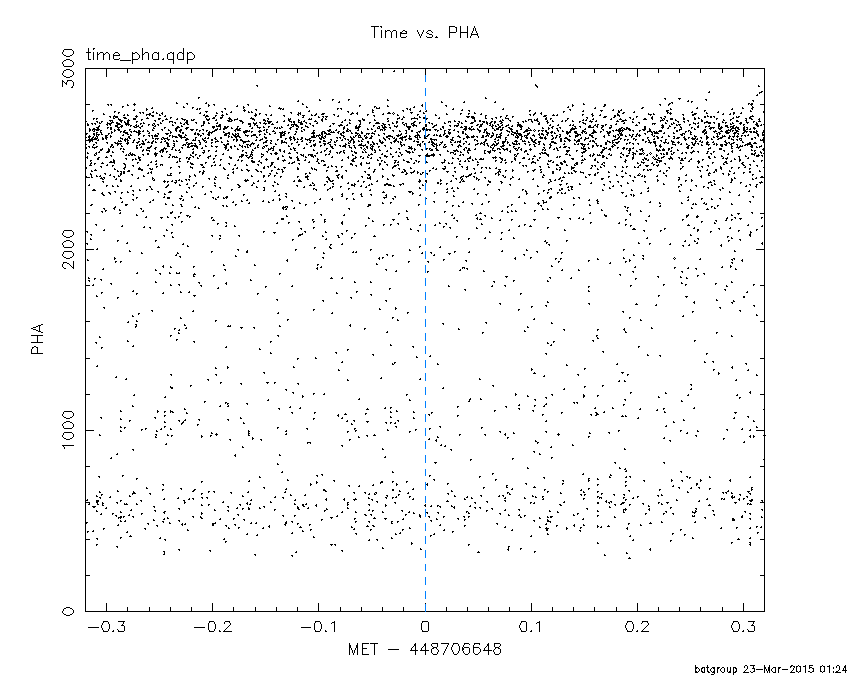
Blue+Cyan dotted lines: Time interval of the scaled map
From 0.000000 to 64.000000
TIME vs. DetID plot around the trigger time

Blue+Cyan dotted lines: Time interval of the scaled map
From 0.000000 to 64.000000
100 us light curve (15-350 keV)

Blue+Cyan dotted lines: Time interval of the scaled map
From 0.000000 to 64.000000
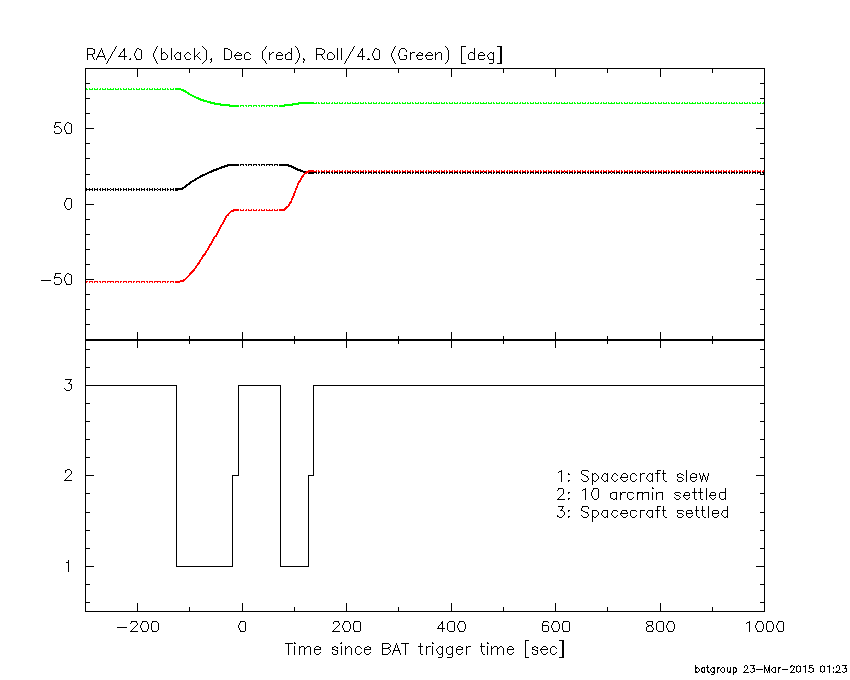
Spacecraft aspect plot
Bright source in the pre-burst/pre-slew/post-slew images
Pre-burst image of 15-350 keV band
Time interval of the image:
Pre-slew background subtracted image of 15-350 keV band
Time interval of the image:
0.000000 64.000000

# RAcent  DECcent POSerr Theta    Phi  PeakCts   SNR AngSep     Name
#  [deg]    [deg]    ['] [deg]  [deg]                   [']
 83.7713  22.0491    9.4  33.3  -28.6  -0.1403  -1.3    8.0	Crab
135.4376 -40.7406    3.8  45.8  156.3   0.7336   3.1   11.9	Vela X-1
135.6502 -41.0552    2.2  46.1  156.5   1.3077   5.4 ------	UNKNOWN
104.8068  43.7378    2.6  47.8    8.8   0.8659   4.4 ------	UNKNOWN
 83.9732  21.7418    0.6  32.9  -28.7   2.6285  25.0 ------	UNKNOWN
Post-slew image of 15-350 keV band
Time interval of the image:
126.100600 178.210000
179.000000 303.129300

# RAcent  DECcent POSerr Theta    Phi  PeakCts   SNR AngSep     Name
#  [deg]    [deg]    ['] [deg]  [deg]                   [']
 83.8017  21.8711    0.0   0.2  -51.1   3.1468  18.9   12.7	Crab
107.2612 -26.3842    2.8  53.2  156.1   3.5956   4.1 ------	UNKNOWN
 77.7809  28.5862    2.8   8.8  -35.7   0.6255   4.2 ------	UNKNOWN
 54.4395 -24.5183    3.7  54.4 -144.2   3.3414   3.2 ------	UNKNOWN
 49.3290 -12.1265    3.4  48.0 -129.2   2.5025   3.4 ------	UNKNOWN
Plot creation:
Mon Mar 23 01:24:58 EDT 2015