Special notes of this burst
Image
Pre-slew 15.0-50.0 keV image (Event data)

#RAcent DECcent POSerr Theta  Phi  Peak_Cts  SNR Name
128.191 45.434 0.000 42.141 -139.787 1.139 9.214 TRIG_00635887

Image time interval: 0.000 to 64.000 [sec]
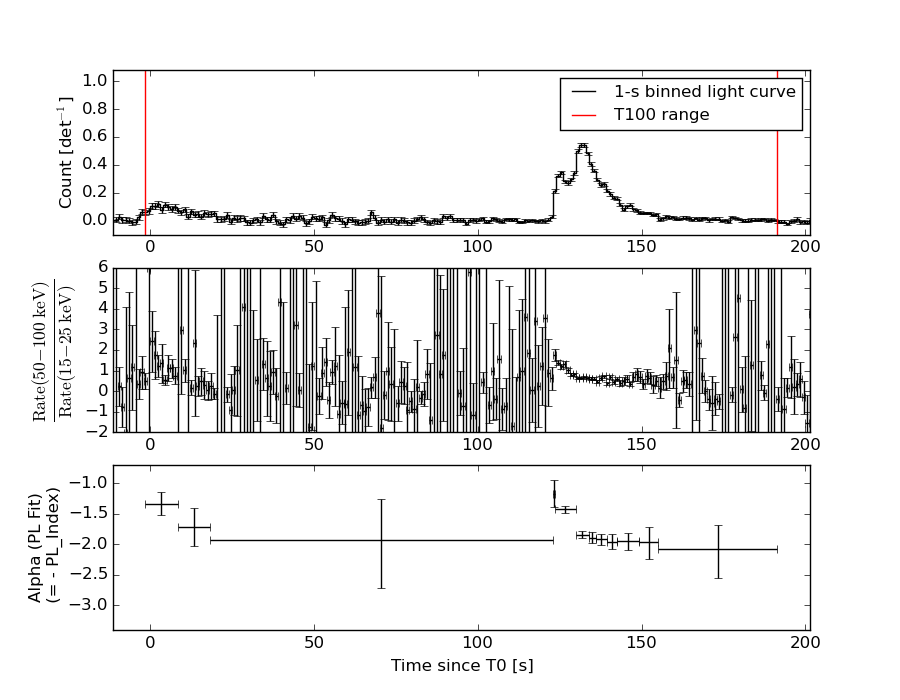
Lightcurves
Notes:
- 1) The mask-weighted light curves are using the flight position.
- 2) Multiple plots of different time binning/intervals are shown to cover all scenarios of short/long GRBs, rate/image triggers, and real/false positives.
- 3) For all the mask-weighted lightcurves, the y-axis units are counts/sec/det where a det is 0.4 x 0.4 = 0.16 sq cm.
- 4) The verticle lines correspond to following: green dotted lines are T50 interval, black dotted lines are T90 interval, blue solid line(s) is a spacecraft slew start time, and orange solid line(s) is a spacecraft slew end time.
- 5) Time of each bin is in the middle of the bin.
1 s binning
From T0-310 s to T0+310 s

From T100_start - 20 s to T100_end + 30 s

Full time interval
64 ms binning
Full time interval
From T100_start to T100_end

From T0-5 sec to T0+5 sec
16 ms binning
From T100_start-5 s to T100_start+5 s

Blue+Cyan dotted lines: Time interval of the scaled map
From 0.000000 to 64.000000
8 ms binning
From T100_start-3 s to T100_start+3 s
Blue+Cyan dotted lines: Time interval of the scaled map
From 0.000000 to 64.000000
2 ms binning
From T100_start-1 s to T100_start+1 s

Blue+Cyan dotted lines: Time interval of the scaled map
From 0.000000 to 64.000000
SN=5 or 10 sec. binning (whichever binning is satisfied first)
SN=5 or 10 sec. binning (T < 200 sec)

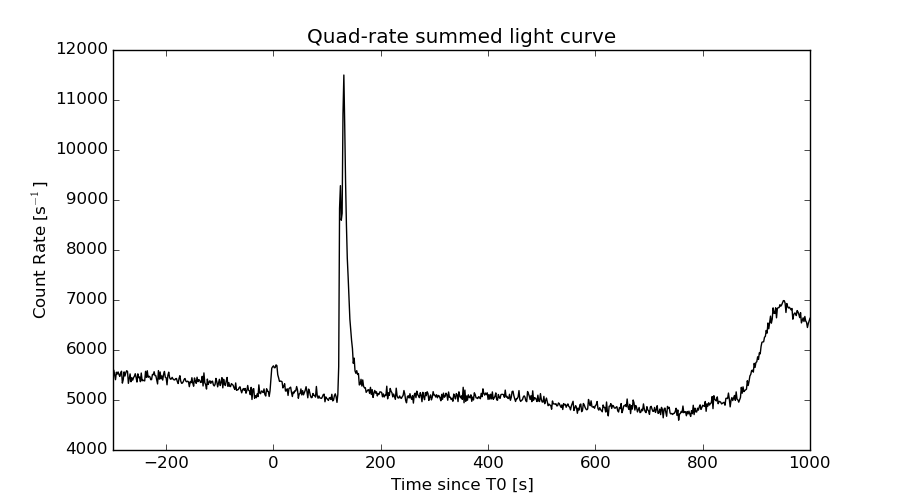
Quad-rate summed light curves (from T0-300s to T0+1000s)
Spectral Evolution
Spectra
Notes:
- 1) The fitting includes the systematic errors.
- 2) When the burst includes telescope slew time periods, the fitting uses an average response file made from multiple 5-s response files through out the slew time plus single time preiod for the non-slew times, and weighted by the total counts in the corresponding time period using addrmf. An average response file is needed becuase a spectral fit using the pre-slew DRM will introduce some errors in both a spectral shape and a normalization if the PHA file contains a lot of the slew/post-slew time interval.
- 3) For fits to more complicated models (e.g. a power-law over a cutoff power-law), the BAT team has decided to require a chi-square improvement of more than 6 for each extra dof.
Time averaged spectrum fit using the average DRM
Power-law model

Time interval is from   -1.540 sec. to  191.408 sec.

Spectral model in power-law:
------------------------------------------------------------
Parameters  : value       lower 90%   higher 90%
Photon index: 1.73771     ( -0.0740945   0.0747602 )
Norm@50keV  : 3.14244E-03    ( -0.000126327   0.000125852 )
------------------------------------------------------------
#Fit statistic : Chi-Squared =          43.76 using 59 PHA bins.
# Reduced chi-squared =         0.7677 for     57 degrees of freedom
# Null hypothesis probability =   9.011188e-01

Photon flux (15-150 keV)    in 192.9 sec: 0.423002 ( -0.0171942  0.0172646 ) ph/cm2/s
Energy fluence (15-150 keV)             : 5.59753e-06 ( -2.33608e-07  2.34555e-07 ) ergs/cm2
Cutoff power-law model

Time interval is from   -1.540 sec. to  191.408 sec.
Spectral model in the cutoff power-law:
------------------------------------------------------------
Parameters  : value       lower 90%   higher 90%
Photon index: 1.61300     ( -0.293693   0.187448 )
Epeak [keV] : 154.879      ( -76.124 -154.878 )
Norm@50keV  : 3.62662E-03    ( -0.000591571   0.00141279 )
------------------------------------------------------------
#Fit statistic : Chi-Squared =          43.18 using 59 PHA bins.
# Reduced chi-squared =         0.7711 for     56 degrees of freedom
# Null hypothesis probability =   8.951354e-01

Photon flux (15-150 keV)    in 192.9 sec: 0.419194 ( -0.019004  0.019036 ) ph/cm2/s
Energy fluence (15-150 keV)             : 5.53901e-06 ( -2.70099e-07  2.67012e-07 ) ergs/cm2
Band function

Time interval is from   -1.540 sec. to  191.408 sec.

Spectral model in the Band function:
------------------------------------------------------------
Parameters  : value       lower 90%   higher 90%
alpha       : -1.61302   ( 1.49066   1.49066 )
beta        : -9.13837    ( 9.13835   19.1384 )
Epeak [keV] : 154.876      ( -58.8422 -154.876 )
Norm@50keV   : 3.62577E-03    ( -0.000138012   0.000852043 )
------------------------------------------------------------
#Fit statistic : Chi-Squared =          43.18 using 59 PHA bins.
# Reduced chi-squared =         0.7851 for     55 degrees of freedom
# Null hypothesis probability =   8.759410e-01

Photon flux (15-150 keV)    in 192.9 sec:  (    ) ph/cm2/s
Energy fluence (15-150 keV)             : 0 ( 0  0 ) ergs/cm2
Single BB

Spectral model blackbody:
------------------------------------------------------------
Parameters  : value    Lower 90%  Upper 90%
kT [keV]    : 13.5331  (  )
R^2/D10^2   : 6.26954E-02  (   )
(R is the radius in km and D10 is the distance to the source in units of 10 kpc)
------------------------------------------------------------
#Fit statistic : Chi-Squared =         206.09 using 59 PHA bins.
# Reduced chi-squared =         3.6156 for     57 degrees of freedom
# Null hypothesis probability =   9.565517e-19

Energy  Fluence     90% Error
[keV]   [erg/cm2]   [erg/cm2]
15- 25  4.691e-07   3.665e-08
25- 50  1.686e-06   8.439e-08
50-150  1.997e-06   1.698e-07
15-150  4.151e-06   1.784e-07
Thermal bremsstrahlung (OTTB)

Spectral model: thermal bremsstrahlung
------------------------------------------------------------
Parameters  : value         Lower 90%    Upper 90%
kT [keV]    : 134.455       (-24.2775      26.8706)
Norm        : 1.72463       (-0.0839773     0.107776)
------------------------------------------------------------
#Fit statistic : Chi-Squared =          46.80 using 59 PHA bins.
# Reduced chi-squared =         0.8210 for     57 degrees of freedom
# Null hypothesis probability =   8.304366e-01

Energy  Fluence     90% Error
[keV]   [erg/cm2]   [erg/cm2]
15- 25  8.614e-07   6.192e-08
25- 50  1.570e-06   9.790e-08
50-150  2.957e-06   8.137e-07
15-150  5.389e-06   7.957e-07
Double BB

Spectral model: bbodyrad<1> + bbodyrad<2>
------------------------------------------------------------
Parameters  : value         Lower 90%    Upper 90%
kT1 [keV]   : 6.14465        (-0.90058      1.00318)
R1^2/D10^2  : 0.764073        (-0.320392      0.652307)
kT2 [keV]   : 22.9702        (-2.78769      3.96203)
R2^2/D10^2  : 7.32560E-03    (-0.00330895   0.0047786)
------------------------------------------------------------
#Fit statistic : Chi-Squared =          51.53 using 59 PHA bins.
# Reduced chi-squared =         0.9370 for     55 degrees of freedom
# Null hypothesis probability =   6.078359e-01

Energy  Fluence     90% Error
[keV]   [erg/cm2]   [erg/cm2]
15- 25  8.998e-07   1.287e-07
25- 50  1.536e-06   1.543e-07
50-150  2.970e-06   3.395e-07
15-150  5.406e-06   5.459e-07
Peak spectrum fit
Power-law model

Time interval is from  131.588 sec. to  132.588 sec.

Spectral model in power-law:
------------------------------------------------------------
Parameters  : value       lower 90%   higher 90%
Photon index: 1.84691     ( -0.089392   0.0910035 )
Norm@50keV  : 3.28403E-02    ( -0.00170681   0.00169346 )
------------------------------------------------------------
#Fit statistic : Chi-Squared =          60.58 using 59 PHA bins.
# Reduced chi-squared =          1.063 for     57 degrees of freedom
# Null hypothesis probability =   3.480333e-01

Photon flux (15-150 keV)    in 1 sec: 4.61026 ( -0.224985  0.22543 ) ph/cm2/s
Energy fluence (15-150 keV)             : 3.01974e-07 ( -1.57622e-08  1.58483e-08 ) ergs/cm2
Cutoff power-law model

Time interval is from  131.588 sec. to  132.588 sec.
Spectral model in the cutoff power-law:
------------------------------------------------------------
Parameters  : value       lower 90%   higher 90%
Photon index: 1.66855     ( -0.362024   0.171407 )
Epeak [keV] : 89.3318      ( -41.302 -89.3318 )
Norm@50keV  : 4.06176E-02    ( -0.00808046   0.0213672 )
------------------------------------------------------------
#Fit statistic : Chi-Squared =          59.78 using 59 PHA bins.
# Reduced chi-squared =          1.067 for     56 degrees of freedom
# Null hypothesis probability =   3.402656e-01

Photon flux (15-150 keV)    in 1 sec: 4.55929 ( -0.24319  0.24348 ) ph/cm2/s
Energy fluence (15-150 keV)             : 2.97549e-07 ( -1.8012e-08  1.6682e-08 ) ergs/cm2
Band function

Time interval is from  131.588 sec. to  132.588 sec.

Spectral model in the Band function:
------------------------------------------------------------
Parameters  : value       lower 90%   higher 90%
alpha       : -1.62127   ( 1.6213   1.6213 )
beta        : -2.00011    ( 1.99926   0.226318 )
Epeak [keV] : 76.4326      ( -76.5278 399.278 )
Norm@50keV   : 4.32948E-02    ( -0.0118685   4.70863 )
------------------------------------------------------------
#Fit statistic : Chi-Squared =          59.72 using 59 PHA bins.
# Reduced chi-squared =          1.086 for     55 degrees of freedom
# Null hypothesis probability =   3.081421e-01

Photon flux (15-150 keV)    in 1 sec:  (    ) ph/cm2/s
Energy fluence (15-150 keV)             : 0 ( 0  0 ) ergs/cm2
Single BB

Spectral model blackbody:
------------------------------------------------------------
Parameters  : value    Lower 90%  Upper 90%
kT [keV]    : 12.1883  (  )
R^2/D10^2   : 0.992977  (   )
(R is the radius in km and D10 is the distance to the source in units of 10 kpc)
------------------------------------------------------------
#Fit statistic : Chi-Squared =         169.59 using 59 PHA bins.
# Reduced chi-squared =         2.9753 for     57 degrees of freedom
# Null hypothesis probability =   4.091699e-13

Energy  Fluence     90% Error
[keV]   [erg/cm2]   [erg/cm2]
15- 25  3.124e-08   2.800e-09
25- 50  1.001e-07   5.350e-09
50-150  9.034e-08   1.086e-08
15-150  2.217e-07   1.285e-08
Thermal bremsstrahlung (OTTB)

Spectral model: thermal bremsstrahlung
------------------------------------------------------------
Parameters  : value         Lower 90%    Upper 90%
kT [keV]    : 99.6252       (-16.5977      22.4277)
Norm        : 20.0382       (-1.39164     1.54354)
------------------------------------------------------------
#Fit statistic : Chi-Squared =          62.67 using 59 PHA bins.
# Reduced chi-squared =          1.099 for     57 degrees of freedom
# Null hypothesis probability =   2.822943e-01

Energy  Fluence     90% Error
[keV]   [erg/cm2]   [erg/cm2]
15- 25  5.237e-08   4.490e-09
25- 50  9.049e-08   5.095e-09
50-150  1.463e-07   3.895e-08
15-150  2.892e-07   4.285e-08
Double BB

Spectral model: bbodyrad<1> + bbodyrad<2>
------------------------------------------------------------
Parameters  : value         Lower 90%    Upper 90%
kT1 [keV]   : 5.69887        (-1.00208      1.19299)
R1^2/D10^2  : 11.4759        (-5.64651      13.4409)
kT2 [keV]   : 20.6941        (-2.89154      4.4329)
R2^2/D10^2  : 0.109187    (-0.0577798   0.0899087)
------------------------------------------------------------
#Fit statistic : Chi-Squared =          67.52 using 59 PHA bins.
# Reduced chi-squared =          1.228 for     55 degrees of freedom
# Null hypothesis probability =   1.197987e-01

Energy  Fluence     90% Error
[keV]   [erg/cm2]   [erg/cm2]
15- 25  5.471e-08   9.520e-09
25- 50  8.603e-08   1.005e-08
50-150  1.473e-07   2.340e-08
15-150  2.880e-07   3.485e-08
Pre-slew spectrum (Pre-slew PHA with pre-slew DRM)
Power-law model

Spectral model in power-law:
------------------------------------------------------------
Parameters  : value       lower 90%   higher 90%
Photon index: 1.55232     ( -0.226102   0.228658 )
Norm@50keV  : 1.86497E-03    ( -0.000251597   0.00025002 )
------------------------------------------------------------
#Fit statistic : Chi-Squared =          46.40 using 59 PHA bins.
# Reduced chi-squared =         0.8140 for     57 degrees of freedom
# Null hypothesis probability =   8.410436e-01

Photon flux (15-150 keV)    in 73.64 sec: 0.236253 ( -0.0320995  0.0321826 ) ph/cm2/s
Energy fluence (15-150 keV)             : 1.29248e-06 ( -1.86182e-07  1.87771e-07 ) ergs/cm2
Cutoff power-law model

Spectral model in the cutoff power-law:
------------------------------------------------------------
Parameters  : value       lower 90%   higher 90%
Photon index: 1.27310     ( -0.964405   0.492012 )
Epeak [keV] : 132.235      ( -132.236 -132.236 )
Norm@50keV  : 2.57788E-03    ( -0.00257787   0.0050367 )
------------------------------------------------------------
#Fit statistic : Chi-Squared =          46.07 using 59 PHA bins.
# Reduced chi-squared =         0.8226 for     56 degrees of freedom
# Null hypothesis probability =   8.255232e-01

Photon flux (15-150 keV)    in 73.64 sec: 0.233650 ( -0.03268  0.033034 ) ph/cm2/s
Energy fluence (15-150 keV)             : 1.27138e-06 ( -1.98894e-07  1.96589e-07 ) ergs/cm2
Band function

Spectral model in the Band function:
------------------------------------------------------------
Parameters  : value       lower 90%   higher 90%
alpha       : 4.92749   ( -4.92749   -4.92749 )
beta        : -1.62571    ( -0.292515   0.251506 )
Epeak [keV] : 23.9697      ( -23.9697 6.71154 )
Norm@50keV   : 236.843    ( -30.998   1.14786e+06 )
------------------------------------------------------------
#Fit statistic : Chi-Squared =          45.71 using 59 PHA bins.
# Reduced chi-squared =         0.8311 for     55 degrees of freedom
# Null hypothesis probability =   8.096994e-01

Photon flux (15-150 keV)    in 73.64 sec: 0.232803 (    ) ph/cm2/s
Energy fluence (15-150 keV)             : 0 ( 0  0 ) ergs/cm2
S(25-50 keV) vs. S(50-100 keV) plot

S(25-50 keV)  = 1.54e-06
S(50-100 keV) = 1.85e-06
T90 vs. Hardness ratio plot
T90                                   = 149.727999925613 sec.
Hardness ratio (energy fluence ratio) = 1.2013
Color vs. Color plot

Count Ratio  (25-50 keV) / (15-25 keV) = 1.09199
Count Ratio (50-100 keV) / (15-25 keV) = 0.71177
Mask shadow pattern

IMX = -0.691010542175, IMY = 0.584218515664
TIME vs. PHA plot around the trigger time
Blue+Cyan dotted lines: Time interval of the scaled map
From 0.000000 to 64.000000
TIME vs. DetID plot around the trigger time
Blue+Cyan dotted lines: Time interval of the scaled map
From 0.000000 to 64.000000
100 us light curve (15-350 keV)
Blue+Cyan dotted lines: Time interval of the scaled map
From 0.000000 to 64.000000
Spacecraft aspect plot

Bright source in the pre-burst/pre-slew/post-slew images
Pre-burst image of 15-350 keV band
Time interval of the image:
-11.899380 -1.540000

# RAcent  DECcent POSerr Theta    Phi  PeakCts   SNR AngSep     Name
#  [deg]    [deg]    ['] [deg]  [deg]                   [']
254.4598  35.3550   11.8  58.9  -17.2   0.1935   1.0    0.8	Her X-1
Pre-slew background subtracted image of 15-350 keV band
Time interval of the image:
-1.500000 20.000000

# RAcent  DECcent POSerr Theta    Phi  PeakCts   SNR AngSep     Name
#  [deg]    [deg]    ['] [deg]  [deg]                   [']
254.4465  35.4052    6.9  58.8  -17.2  -0.8176  -1.6    3.8	Her X-1
236.3902  12.2140    1.9  54.1   16.5   2.4833   5.9 ------	UNKNOWN
236.7431  15.9141    2.5  52.5   12.3   1.4481   4.6 ------	UNKNOWN
171.8449  27.6691    2.9  10.0  155.8   0.3015   4.0 ------	UNKNOWN
128.2024  45.4220    1.2  42.1 -139.8   1.4180   9.8 ------	UNKNOWN
Post-slew image of 15-350 keV band
Time interval of the image:
135.300590 771.500600

# RAcent  DECcent POSerr Theta    Phi  PeakCts   SNR AngSep     Name
#  [deg]    [deg]    ['] [deg]  [deg]                   [']
 83.6278  22.0131    0.7  43.1 -135.6  13.3511  15.7    0.3	Crab
136.4833  11.9698    3.0  34.2  137.6   2.3027   3.9 ------	UNKNOWN
128.1722  45.4404    1.7   0.0 -126.7   2.5357   6.7 ------	UNKNOWN
 84.3931   3.5212    3.2  56.7 -152.2   8.3926   3.6 ------	UNKNOWN
 77.6456  16.2966    3.3  51.1 -135.7   8.2772   3.5 ------	UNKNOWN
Plot creation:
Tue Nov 24 12:29:01 EST 2015