Special notes of this burst
Image
Pre-slew 15.0-350.0 keV image (Event data)
#   RAcent    DECcent   POSerr    Theta     Phi              Peak Cts       SNR   Name
  311.5048   -62.7061   0.0039    33.0113   -65.3898        17.6987770     49.919 TRIG_00637044

Foreground time interval of the image:
-83.148  11.093 (delta_t =  94.241 [sec])
Background time interval of the image:
-239.208 -83.148 (delta_t = 156.060 [sec])
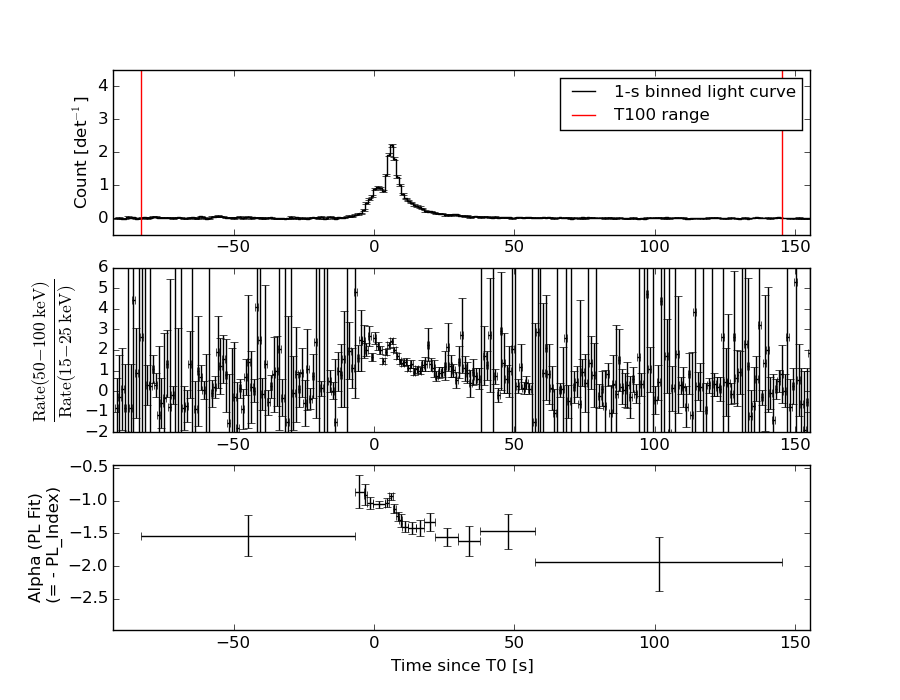
Lightcurves
Notes:
- 1) The mask-weighted light curves are using the flight position.
- 2) Multiple plots of different time binning/intervals are shown to cover all scenarios of short/long GRBs, rate/image triggers, and real/false positives.
- 3) For all the mask-weighted lightcurves, the y-axis units are counts/sec/det where a det is 0.4 x 0.4 = 0.16 sq cm.
- 4) The verticle lines correspond to following: green dotted lines are T50 interval, black dotted lines are T90 interval, blue solid line(s) is a spacecraft slew start time, and orange solid line(s) is a spacecraft slew end time.
- 5) Time of each bin is in the middle of the bin.
1 s binning
From T0-310 s to T0+310 s

From T100_start - 20 s to T100_end + 30 s
Full time interval
64 ms binning
Full time interval
From T100_start to T100_end

From T0-5 sec to T0+5 sec
16 ms binning
From T100_start-5 s to T100_start+5 s

Blue+Cyan dotted lines: Time interval of the scaled map
From 0.000000 to 1.024000
8 ms binning
From T100_start-3 s to T100_start+3 s
Blue+Cyan dotted lines: Time interval of the scaled map
From 0.000000 to 1.024000
2 ms binning
From T100_start-1 s to T100_start+1 s

Blue+Cyan dotted lines: Time interval of the scaled map
From 0.000000 to 1.024000
SN=5 or 10 sec. binning (whichever binning is satisfied first)

SN=5 or 10 sec. binning (T < 200 sec)
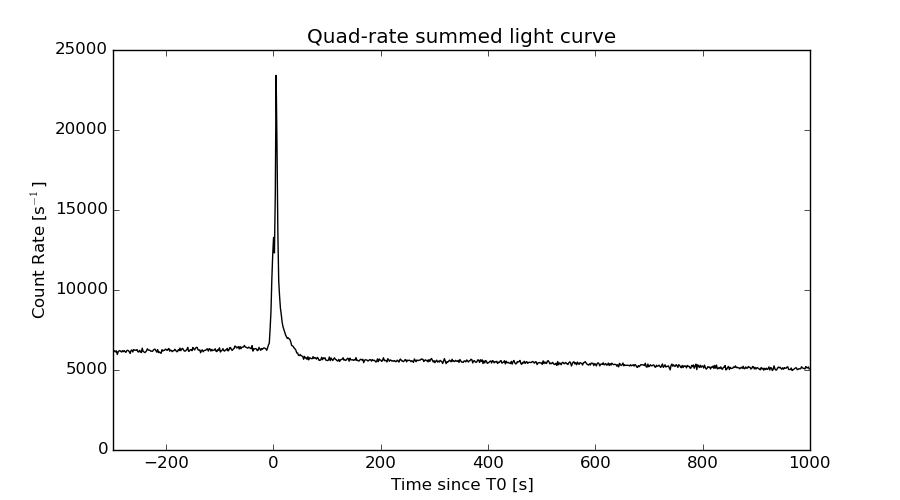
Quad-rate summed light curves (from T0-300s to T0+1000s)
Spectral Evolution
Spectra
Notes:
- 1) The fitting includes the systematic errors.
- 2) When the burst includes telescope slew time periods, the fitting uses an average response file made from multiple 5-s response files through out the slew time plus single time preiod for the non-slew times, and weighted by the total counts in the corresponding time period using addrmf. An average response file is needed becuase a spectral fit using the pre-slew DRM will introduce some errors in both a spectral shape and a normalization if the PHA file contains a lot of the slew/post-slew time interval.
- 3) For fits to more complicated models (e.g. a power-law over a cutoff power-law), the BAT team has decided to require a chi-square improvement of more than 6 for each extra dof.
Time averaged spectrum fit using the average DRM
Power-law model

Time interval is from  -83.148 sec. to  145.372 sec.

Spectral model in power-law:
------------------------------------------------------------
Parameters  : value       lower 90%   higher 90%
Photon index: 1.22092     ( -0.0380099   0.0378419 )
Norm@50keV  : 7.39697E-03    ( -0.000151855   0.000151481 )
------------------------------------------------------------
#Fit statistic : Chi-Squared =          39.87 using 59 PHA bins.
# Reduced chi-squared =         0.6994 for     57 degrees of freedom
# Null hypothesis probability =   9.588245e-01

Photon flux (15-150 keV)    in 228.5 sec: 0.870895 ( -0.0197727  0.0198338 ) ph/cm2/s
Energy fluence (15-150 keV)             : 1.70483e-05 ( -3.45024e-07  3.45177e-07 ) ergs/cm2
Cutoff power-law model
Time interval is from  -83.148 sec. to  145.372 sec.
Spectral model in the cutoff power-law:
------------------------------------------------------------
Parameters  : value       lower 90%   higher 90%
Photon index: 1.09707     ( -0.154277   0.136481 )
Epeak [keV] : 444.787      ( -210.667 -444.866 )
Norm@50keV  : 8.31966E-03    ( -0.00067897   0.00127368 )
------------------------------------------------------------
#Fit statistic : Chi-Squared =          37.88 using 59 PHA bins.
# Reduced chi-squared =         0.6764 for     56 degrees of freedom
# Null hypothesis probability =   9.697680e-01

Photon flux (15-150 keV)    in 228.5 sec: 0.862760 ( -0.021818  0.021953 ) ph/cm2/s
Energy fluence (15-150 keV)             : 1.69633e-05 ( -3.64777e-07  3.63338e-07 ) ergs/cm2
Band function
Time interval is from  -83.148 sec. to  145.372 sec.

Spectral model in the Band function:
------------------------------------------------------------
Parameters  : value       lower 90%   higher 90%
alpha       : -0.770644   ( 0.771729   5.50909 )
beta        : -1.25255    ( 1.25264   0.0551666 )
Epeak [keV] : 105.313      ( -106.072 -106.072 )
Norm@50keV   : 1.33267E-02    ( -0.00557671   353.237 )
------------------------------------------------------------
#Fit statistic : Chi-Squared =          37.86 using 59 PHA bins.
# Reduced chi-squared =         0.6883 for     55 degrees of freedom
# Null hypothesis probability =   9.623625e-01

Photon flux (15-150 keV)    in 228.5 sec:  (    ) ph/cm2/s
Energy fluence (15-150 keV)             : 0 ( 0  0 ) ergs/cm2
Single BB
Spectral model blackbody:
------------------------------------------------------------
Parameters  : value    Lower 90%  Upper 90%
kT [keV]    : 21.4596  (  )
R^2/D10^2   : 3.08228E-02  (   )
(R is the radius in km and D10 is the distance to the source in units of 10 kpc)
------------------------------------------------------------
#Fit statistic : Chi-Squared =         472.87 using 59 PHA bins.
# Reduced chi-squared =         8.2960 for     57 degrees of freedom
# Null hypothesis probability =   7.749006e-67

Energy  Fluence     90% Error
[keV]   [erg/cm2]   [erg/cm2]
15- 25  6.070e-07   2.731e-08
25- 50  3.162e-06   9.369e-08
50-150  1.087e-05   3.302e-07
15-150  1.464e-05   3.485e-07
Thermal bremsstrahlung (OTTB)

Spectral model: thermal bremsstrahlung
------------------------------------------------------------
Parameters  : value         Lower 90%    Upper 90%
kT [keV]    : 199.363       (      )
Norm        : 3.79493       (     )
------------------------------------------------------------
#Fit statistic : Chi-Squared =         309.08 using 59 PHA bins.
# Reduced chi-squared =         5.4224 for     57 degrees of freedom
# Null hypothesis probability =   2.566269e-36

Energy  Fluence     90% Error
[keV]   [erg/cm2]   [erg/cm2]
15- 25  2.159e-06   4.936e-08
25- 50  4.154e-06   9.940e-08
50-150  9.110e-06   2.136e-07
15-150  1.542e-05   3.679e-07
Double BB

Spectral model: bbodyrad<1> + bbodyrad<2>
------------------------------------------------------------
Parameters  : value         Lower 90%    Upper 90%
kT1 [keV]   : 8.40972        (-0.730907      0.790961)
R1^2/D10^2  : 0.393713        (-0.0983173      0.139911)
kT2 [keV]   : 33.7586        (-2.48124      3.16804)
R2^2/D10^2  : 5.98789E-03    (-0.00152963   0.00175882)
------------------------------------------------------------
#Fit statistic : Chi-Squared =          43.61 using 59 PHA bins.
# Reduced chi-squared =         0.7929 for     55 degrees of freedom
# Null hypothesis probability =   8.657994e-01

Energy  Fluence     90% Error
[keV]   [erg/cm2]   [erg/cm2]
15- 25  1.417e-06   1.170e-07
25- 50  3.729e-06   1.759e-07
50-150  1.182e-05   5.381e-07
15-150  1.697e-05   6.649e-07
Peak spectrum fit
Power-law model

Time interval is from    5.804 sec. to    6.804 sec.

Spectral model in power-law:
------------------------------------------------------------
Parameters  : value       lower 90%   higher 90%
Photon index: 0.917571     ( -0.0600957   0.0596312 )
Norm@50keV  : 0.153214    ( -0.00521846   0.0052054 )
------------------------------------------------------------
#Fit statistic : Chi-Squared =          50.96 using 59 PHA bins.
# Reduced chi-squared =         0.8940 for     57 degrees of freedom
# Null hypothesis probability =   6.999014e-01

Photon flux (15-150 keV)    in 1 sec: 17.5893 ( -0.601601  0.602011 ) ph/cm2/s
Energy fluence (15-150 keV)             : 1.70788e-06 ( -6.27989e-08  6.29084e-08 ) ergs/cm2
Cutoff power-law model
Time interval is from    5.804 sec. to    6.804 sec.
Spectral model in the cutoff power-law:
------------------------------------------------------------
Parameters  : value       lower 90%   higher 90%
Photon index: 0.745714     ( -0.237456   0.196105 )
Epeak [keV] : 432.987      ( -432.987 -432.987 )
Norm@50keV  : 0.181846    ( -0.0305712   0.0468526 )
------------------------------------------------------------
#Fit statistic : Chi-Squared =          49.28 using 59 PHA bins.
# Reduced chi-squared =         0.8799 for     56 degrees of freedom
# Null hypothesis probability =   7.254437e-01

Photon flux (15-150 keV)    in 1 sec: 17.4732 ( -0.6193  0.6196 ) ph/cm2/s
Energy fluence (15-150 keV)             : 1.69746e-06 ( 0  0 ) ergs/cm2
Band function

Time interval is from    5.804 sec. to    6.804 sec.

Spectral model in the Band function:
------------------------------------------------------------
Parameters  : value       lower 90%   higher 90%
alpha       : 4.99997   ( -14.9997   -4.99997 )
beta        : -0.962352    ( -0.065745   0.0654905 )
Epeak [keV] : 28.5911      ( -10.6387 3.66007 )
Norm@50keV   : 4419.35    ( -146.822   13611.4 )
------------------------------------------------------------
#Fit statistic : Chi-Squared =          47.02 using 59 PHA bins.
# Reduced chi-squared =         0.8549 for     55 degrees of freedom
# Null hypothesis probability =   7.693829e-01

Photon flux (15-150 keV)    in 1 sec:  (    ) ph/cm2/s
Energy fluence (15-150 keV)             : 0 ( 0  0 ) ergs/cm2
Single BB

Spectral model blackbody:
------------------------------------------------------------
Parameters  : value    Lower 90%  Upper 90%
kT [keV]    : 23.6901  (  )
R^2/D10^2   : 0.511345  (   )
(R is the radius in km and D10 is the distance to the source in units of 10 kpc)
------------------------------------------------------------
#Fit statistic : Chi-Squared =         186.72 using 59 PHA bins.
# Reduced chi-squared =         3.2757 for     57 degrees of freedom
# Null hypothesis probability =   1.057634e-15

Energy  Fluence     90% Error
[keV]   [erg/cm2]   [erg/cm2]
15- 25  5.126e-08   3.625e-09
25- 50  2.827e-07   1.520e-08
50-150  1.183e-06   6.250e-08
15-150  1.517e-06   6.150e-08
Thermal bremsstrahlung (OTTB)

Spectral model: thermal bremsstrahlung
------------------------------------------------------------
Parameters  : value         Lower 90%    Upper 90%
kT [keV]    : 199.363       (      )
Norm        : 70.0129       (     )
------------------------------------------------------------
#Fit statistic : Chi-Squared =         346.01 using 59 PHA bins.
# Reduced chi-squared =         6.0703 for     57 degrees of freedom
# Null hypothesis probability =   5.347483e-43

Energy  Fluence     90% Error
[keV]   [erg/cm2]   [erg/cm2]
15- 25  1.743e-07   6.950e-09
25- 50  3.354e-07   1.210e-08
50-150  7.355e-07   2.620e-08
15-150  1.245e-06   4.300e-08
Double BB
Spectral model: bbodyrad<1> + bbodyrad<2>
------------------------------------------------------------
Parameters  : value         Lower 90%    Upper 90%
kT1 [keV]   : 8.81218        (-1.25709      1.48094)
R1^2/D10^2  : 5.59752        (-1.99181      3.3416)
kT2 [keV]   : 38.1926        (-4.63868      7.18154)
R2^2/D10^2  : 0.105253    (-0.0419491   0.0516935)
------------------------------------------------------------
#Fit statistic : Chi-Squared =          46.38 using 59 PHA bins.
# Reduced chi-squared =         0.8432 for     55 degrees of freedom
# Null hypothesis probability =   7.895821e-01

Energy  Fluence     90% Error
[keV]   [erg/cm2]   [erg/cm2]
15- 25  1.042e-07   1.338e-08
25- 50  3.097e-07   2.960e-08
50-150  1.303e-06   1.345e-07
15-150  1.717e-06   1.695e-07
Pre-slew spectrum (Pre-slew PHA with pre-slew DRM)
Power-law model
Spectral model in power-law:
------------------------------------------------------------
Parameters  : value       lower 90%   higher 90%
Photon index: 1.11472     ( -0.0397778   0.0395374 )
Norm@50keV  : 1.33187E-02    ( -0.000293119   0.000292462 )
------------------------------------------------------------
#Fit statistic : Chi-Squared =          44.95 using 59 PHA bins.
# Reduced chi-squared =         0.7886 for     57 degrees of freedom
# Null hypothesis probability =   8.761922e-01

Photon flux (15-150 keV)    in 94.24 sec: 1.54715 ( -0.0365107  0.0366136 ) ph/cm2/s
Energy fluence (15-150 keV)             : 1.30619e-05 ( -2.80128e-07  2.80187e-07 ) ergs/cm2
Cutoff power-law model
Spectral model in the cutoff power-law:
------------------------------------------------------------
Parameters  : value       lower 90%   higher 90%
Photon index: 0.966386     ( -0.162263   0.0801674 )
Epeak [keV] : 430.600      ( -190.598 -430.6 )
Norm@50keV  : 1.53097E-02    ( -0.0014761   0.00244493 )
------------------------------------------------------------
#Fit statistic : Chi-Squared =          42.35 using 59 PHA bins.
# Reduced chi-squared =         0.7563 for     56 degrees of freedom
# Null hypothesis probability =   9.111937e-01

Photon flux (15-150 keV)    in 94.24 sec: 1.53185 ( -0.03953  0.0397 ) ph/cm2/s
Energy fluence (15-150 keV)             : 1.29947e-05 ( -2.92615e-07  2.91579e-07 ) ergs/cm2
Band function
Spectral model in the Band function:
------------------------------------------------------------
Parameters  : value       lower 90%   higher 90%
alpha       : -0.353101   ( -0.554782   3.53562 )
beta        : -1.15654    ( 1.15661   0.0563942 )
Epeak [keV] : 79.6769      ( -41.8962 180.266 )
Norm@50keV   : 3.71392E-02    ( -0.0189462   2.00624 )
------------------------------------------------------------
#Fit statistic : Chi-Squared =          41.31 using 59 PHA bins.
# Reduced chi-squared =         0.7510 for     55 degrees of freedom
# Null hypothesis probability =   9.143471e-01

Photon flux (15-150 keV)    in 94.24 sec:  (    ) ph/cm2/s
Energy fluence (15-150 keV)             : 0 ( 0  0 ) ergs/cm2
S(25-50 keV) vs. S(50-100 keV) plot
S(25-50 keV)  = 3.63e-06
S(50-100 keV) = 6.22e-06
T90 vs. Hardness ratio plot
T90                                   = 37.2959999442101 sec.
Hardness ratio (energy fluence ratio) = 1.7135
Color vs. Color plot
Count Ratio  (25-50 keV) / (15-25 keV) = 1.61816
Count Ratio (50-100 keV) / (15-25 keV) = 1.58023
Mask shadow pattern
IMX = 2.705571048557010E-01, IMY = 5.906714449798098E-01
TIME vs. PHA plot around the trigger time
Blue+Cyan dotted lines: Time interval of the scaled map
From 0.000000 to 1.024000
TIME vs. DetID plot around the trigger time

Blue+Cyan dotted lines: Time interval of the scaled map
From 0.000000 to 1.024000
100 us light curve (15-350 keV)
Blue+Cyan dotted lines: Time interval of the scaled map
From 0.000000 to 1.024000
Spacecraft aspect plot
Bright source in the pre-burst/pre-slew/post-slew images
Pre-burst image of 15-350 keV band
Time interval of the image:
-239.208000 -83.148000

# RAcent  DECcent POSerr Theta    Phi  PeakCts   SNR AngSep     Name
#  [deg]    [deg]    ['] [deg]  [deg]                   [']
170.3996 -60.6554    5.6  47.0   20.6   0.9953   2.1    3.1	Cen X-3
186.5879 -62.8636    4.3  39.1   21.3   0.7570   2.7    5.9	GX 301-2
244.9782 -15.6461    0.8  34.3  140.1   4.9242  15.0    0.4	Sco X-1
255.9541 -37.9895   24.3  10.8  159.6   0.0859   0.5    8.9	4U 1700-377
256.3474 -36.4980    3.3  12.3  161.0   0.6212   3.4    6.2	GX 349+2
263.1836 -24.6406    6.5  24.9  175.0   0.3402   1.8   11.4	GX 1+4
264.9148 -44.5724    4.0   7.6 -141.8   0.4762   2.9   10.4	4U 1735-44
268.3792  -1.3330    4.2  48.7  175.6  -1.2346  -2.8    7.2	SW J1753.5-0127
270.1912 -25.0770    4.0  26.3 -170.6   0.5350   2.9    5.1	GX 5-1
270.2884 -25.7419    3.8  25.7 -169.9   0.5678   3.1    0.8	GRS 1758-258
273.9017 -13.9146   11.5  38.0 -171.8   0.2629   1.0    9.5	GX 17+2
275.7466 -30.4894    0.0  23.8 -154.3  -0.4024  -2.1   11.8	H1820-303
284.9746 -24.9085    5.9  33.0 -147.0   0.4642   1.9    3.4	HT1900.1-2455
262.9313 -33.7763    2.4  15.9 -179.1   0.8254   4.9    4.5	GX 354-0
242.0143 -53.0602    2.4   9.6   37.2   0.8502   4.9 ------	UNKNOWN
261.6004 -30.8841    3.2  18.5  174.8   0.6150   3.7 ------	UNKNOWN
290.7647   0.1900    3.3  57.5 -158.4   3.6044   3.5 ------	UNKNOWN
348.6722 -67.1625    3.0  47.1  -53.2   3.9670   3.8 ------	UNKNOWN
303.1512 -15.8521    2.8  50.6 -134.9   4.1459   4.2 ------	UNKNOWN
Pre-slew background subtracted image of 15-350 keV band
Time interval of the image:
-83.148000 11.092590

# RAcent  DECcent POSerr Theta    Phi  PeakCts   SNR AngSep     Name
#  [deg]    [deg]    ['] [deg]  [deg]                   [']
170.0719 -60.6711    6.1  47.1   20.5  -0.8542  -1.9    7.7	Cen X-3
186.3559 -62.8891    4.7  39.2   21.2  -0.7449  -2.4   10.9	GX 301-2
244.9798 -15.6397   32.8  34.3  140.1   0.1055   0.4    0.0	Sco X-1
255.8440 -37.8768   58.1  10.9  159.1   0.0420   0.2    7.0	4U 1700-377
256.6333 -36.4185   14.4  12.4  162.0   0.1665   0.8    9.6	GX 349+2
262.8532 -24.7407   13.2  24.7  174.3   0.1901   0.9    8.5	GX 1+4
264.8289 -44.3117    8.6   7.7 -143.6   0.2501   1.3    9.1	4U 1735-44
268.4045  -1.3837    5.1  48.6  175.7   1.1036   2.3    4.7	SW J1753.5-0127
270.2098 -24.9096   19.2  26.4 -170.7  -0.1305  -0.6   11.0	GX 5-1
270.2630 -25.6504    5.1  25.8 -170.0  -0.4877  -2.2    6.0	GRS 1758-258
274.1499 -13.9153    0.0  38.0 -171.5  -0.3732  -1.3   11.1	GX 17+2
276.0245 -30.5144    8.5  23.9 -153.8  -0.2590  -1.4   10.2	H1820-303
285.1431 -25.0777    4.7  33.0 -146.6  -0.6082  -2.4   11.1	HT1900.1-2455
262.9814 -33.8425  532.2  15.9 -178.8   0.0041   0.0    0.6	GX 354-0
190.5119 -42.7335    3.0  44.5   50.8   3.2617   3.9 ------	UNKNOWN
224.9827 -23.3560    3.6  35.1  104.0   1.3967   3.3 ------	UNKNOWN
142.8708 -69.9080    3.6  51.8    2.5   1.8176   3.2 ------	UNKNOWN
138.1823 -76.8596    2.9  48.4   -5.7   1.4576   4.0 ------	UNKNOWN
311.5048 -62.7061    0.2  33.0  -65.4  17.6984  49.9 ------	UNKNOWN
Post-slew image of 15-350 keV band
Time interval of the image:
64.092590 962.891600

# RAcent  DECcent POSerr Theta    Phi  PeakCts   SNR AngSep     Name
#  [deg]    [deg]    ['] [deg]  [deg]                   [']
255.9899 -37.8516   15.0  41.4  128.6  -1.7222  -0.8    0.5	4U 1700-377
256.2194 -36.4801   11.8  42.4  130.0  -2.4056  -1.0   11.0	GX 349+2
262.9920 -24.7409   47.1  49.6  145.2  -0.8920  -0.2    1.0	GX 1+4
264.7440 -44.4151   10.1  32.2  130.8   1.1370   1.1    2.1	4U 1735-44
270.2022 -24.9438   11.8  46.6  153.0   2.4036   1.0    9.3	GX 5-1
270.1770 -25.7186    6.1  45.9  152.6   4.3146   1.9    6.9	GRS 1758-258
275.8331 -30.4468    9.6  39.5  156.3  -1.5558  -1.2    6.8	H1820-303
285.0928 -24.8649    8.4  41.7  171.2   1.4137   1.4    4.5	HT1900.1-2455
262.9054 -33.8460   28.0  41.7  139.0   0.8053   0.4    4.2	GX 354-0
291.0097 -47.4928    3.1  19.0  162.0   2.1507   3.8 ------	UNKNOWN
311.3659 -62.6182    2.2   0.1 -178.0   3.0625   5.4 ------	UNKNOWN
 67.3895 -58.0547    2.4  49.6  -10.2   6.0657   4.7 ------	UNKNOWN
317.5293  -8.4681    4.2  54.4 -144.2  13.3173   2.7 ------	UNKNOWN
 34.7504 -41.7735    4.2  50.8  -44.5  11.5840   2.8 ------	UNKNOWN
 14.1698 -38.9699    3.7  43.7  -63.9  11.7641   3.1 ------	UNKNOWN
324.6175 -12.9651    2.3  50.6 -134.9  20.0308   5.1 ------	UNKNOWN
Plot creation:
Thu May 28 13:02:17 EDT 2015