Click here for the BAT GCN circular template
Image
Pre-slew 15.0-350.0 keV image (Event data)

#   RAcent    DECcent   POSerr    Theta     Phi              Peak Cts       SNR   Name
  190.3922    71.8460   0.0167    36.1247   144.5838         6.3802320     11.434 TRIG_00637899

Foreground time interval of the image:
-73.088 207.956 (delta_t = 281.044 [sec])
Background time interval of the image:
-239.000 -73.088 (delta_t = 165.912 [sec])
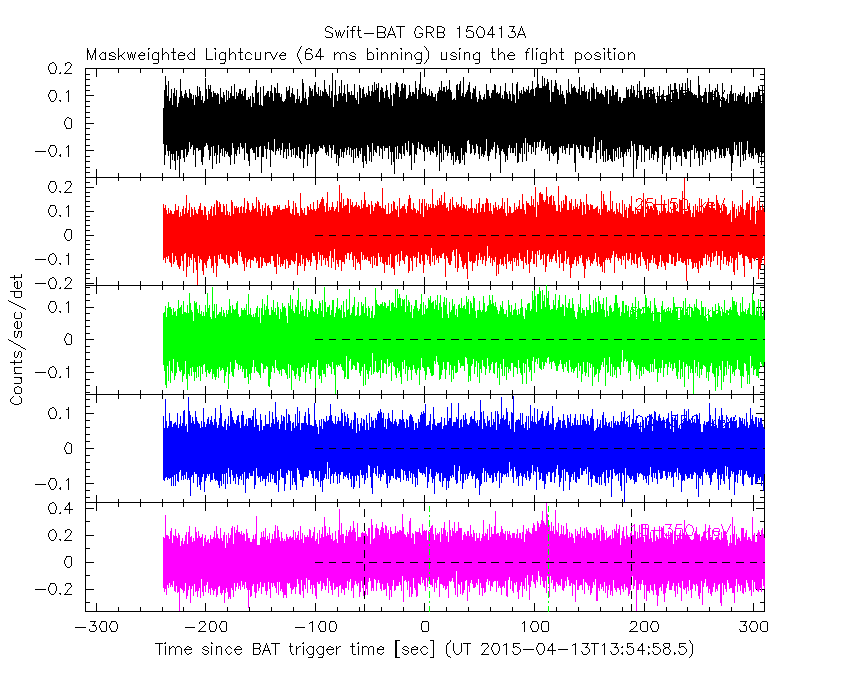
Lightcurves
Notes:
- 1) The mask-weighted light curves are using the flight position.
- 2) Multiple plots of different time binning/intervals are shown to cover all scenarios of short/long GRBs, rate/image triggers, and real/false positives.
- 3) For all the mask-weighted lightcurves, the y-axis units are counts/sec/det where a det is 0.4 x 0.4 = 0.16 sq cm.
- 4) The verticle lines correspond to following: green dotted lines are T50 interval, black dotted lines are T90 interval, blue solid line(s) is a spacecraft slew start time, and orange solid line(s) is a spacecraft slew end time.
- 5) Time of each bin is in the middle of the bin.
1 s binning
From T0-310 s to T0+310 s

From T100_start - 20 s to T100_end + 30 s

Full time interval

64 ms binning
Full time interval
From T100_start to T100_end

From T0-5 sec to T0+5 sec

16 ms binning
From T100_start-5 s to T100_start+5 s

Blue+Cyan dotted lines: Time interval of the scaled map
From 0.000000 to 64.000000
8 ms binning
From T100_start-3 s to T100_start+3 s

Blue+Cyan dotted lines: Time interval of the scaled map
From 0.000000 to 64.000000
2 ms binning
From T100_start-1 s to T100_start+1 s

Blue+Cyan dotted lines: Time interval of the scaled map
From 0.000000 to 64.000000
SN=5 or 10 sec. binning (whichever binning is satisfied first)
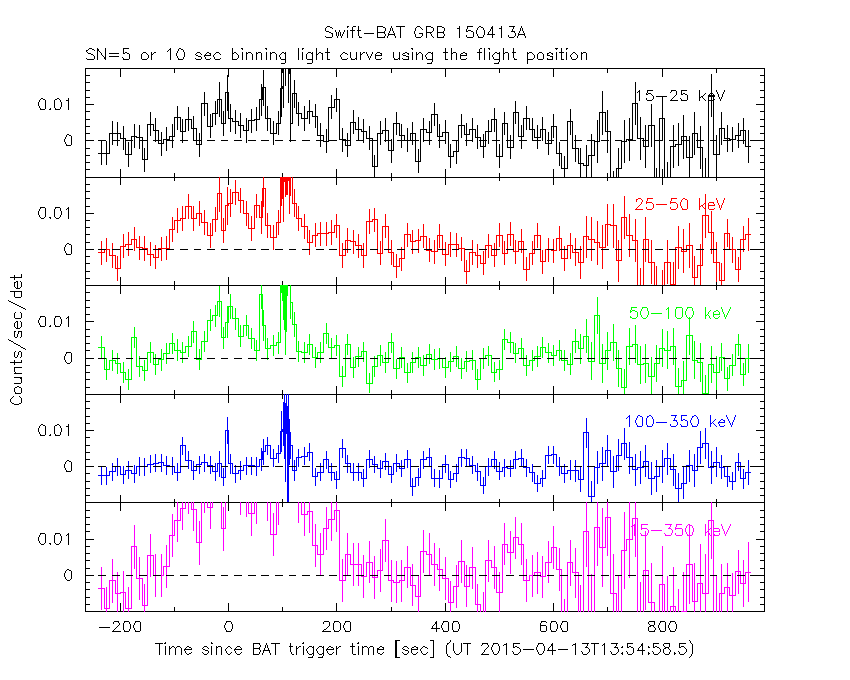
SN=5 or 10 sec. binning (T < 200 sec)

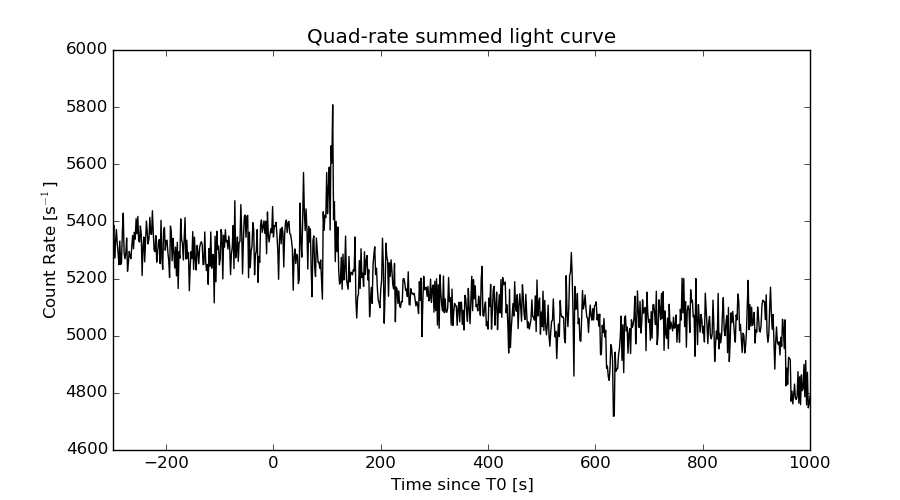
Quad-rate summed light curves (from T0-300s to T0+1000s)
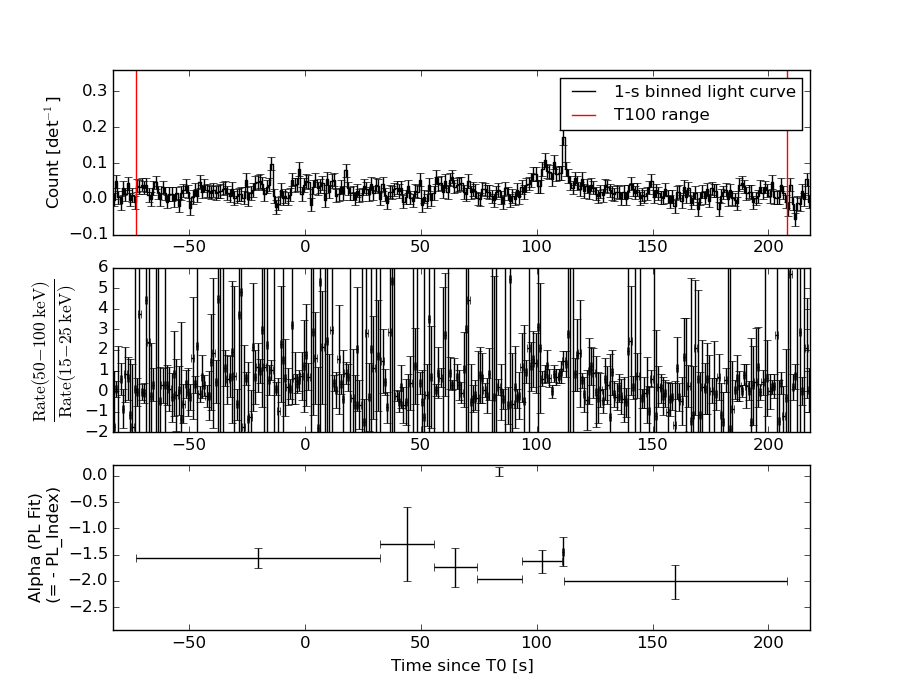
Spectral Evolution
Spectra
Notes:
- 1) The fitting includes the systematic errors.
- 2) When the burst includes telescope slew time periods, the fitting uses an average response file made from multiple 5-s response files through out the slew time plus single time preiod for the non-slew times, and weighted by the total counts in the corresponding time period using addrmf. An average response file is needed becuase a spectral fit using the pre-slew DRM will introduce some errors in both a spectral shape and a normalization if the PHA file contains a lot of the slew/post-slew time interval.
- 3) For fits to more complicated models (e.g. a power-law over a cutoff power-law), the BAT team has decided to require a chi-square improvement of more than 6 for each extra dof.
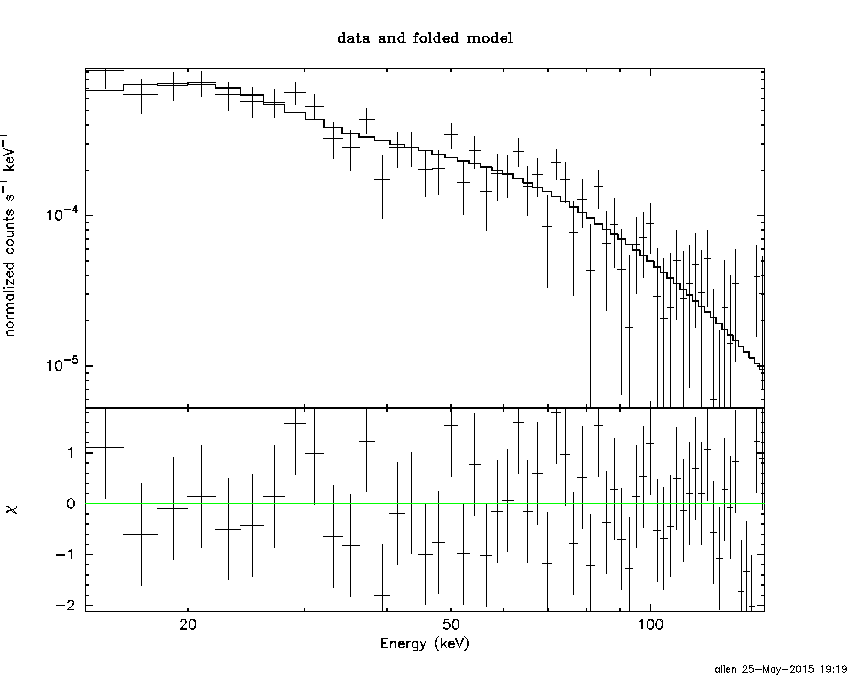
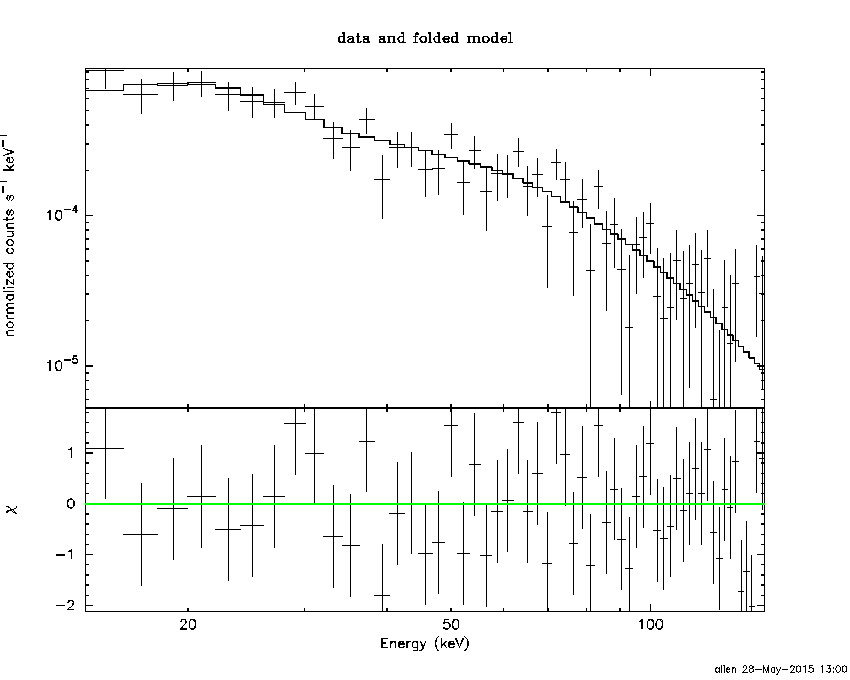
Time averaged spectrum fit using the average DRM
Power-law model

Time interval is from  -73.088 sec. to  207.956 sec.

Spectral model in power-law:
------------------------------------------------------------
Parameters  : value       lower 90%   higher 90%
Photon index: 1.68386     ( -0.134626   0.136757 )
Norm@50keV  : 1.64069E-03    ( -0.000129565   0.000128607 )
------------------------------------------------------------
#Fit statistic : Chi-Squared =          52.02 using 59 PHA bins.
# Reduced chi-squared =         0.9126 for     57 degrees of freedom
# Null hypothesis probability =   6.620659e-01

Photon flux (15-150 keV)    in 281 sec: 0.216687 ( -0.0167724  0.0168065 ) ph/cm2/s
Energy fluence (15-150 keV)             : 4.27429e-06 ( -3.53897e-07  3.56227e-07 ) ergs/cm2
Cutoff power-law model
Time interval is from  -73.088 sec. to  207.956 sec.
Spectral model in the cutoff power-law:
------------------------------------------------------------
Parameters  : value       lower 90%   higher 90%
Photon index: 1.48436     ( -0.540462   0.317346 )
Epeak [keV] : 128.410      ( -62.2104 -128.41 )
Norm@50keV  : 2.07263E-03    ( -0.000618252   0.00176506 )
------------------------------------------------------------
#Fit statistic : Chi-Squared =          51.55 using 59 PHA bins.
# Reduced chi-squared =         0.9205 for     56 degrees of freedom
# Null hypothesis probability =   6.439987e-01

Photon flux (15-150 keV)    in 281 sec: 0.214487 ( -0.017593  0.017595 ) ph/cm2/s
Energy fluence (15-150 keV)             : 4.215e-06 ( -3.86178e-07  3.85448e-07 ) ergs/cm2
Band function

Time interval is from  -73.088 sec. to  207.956 sec.

Spectral model in the Band function:
------------------------------------------------------------
Parameters  : value       lower 90%   higher 90%
alpha       : -1.48775   ( 1.48742   0.483377 )
beta        : -9.36060    ( 9.37162   19.3716 )
Epeak [keV] : 128.747      ( -65.2265 -129.107 )
Norm@50keV   : 2.06808E-03    ( -0.000541672   0.00132668 )
------------------------------------------------------------
#Fit statistic : Chi-Squared =          51.55 using 59 PHA bins.
# Reduced chi-squared =         0.9372 for     55 degrees of freedom
# Null hypothesis probability =   6.074043e-01

Photon flux (15-150 keV)    in 281 sec:  (    ) ph/cm2/s
Energy fluence (15-150 keV)             : 0 ( 0  0 ) ergs/cm2
Single BB

Spectral model blackbody:
------------------------------------------------------------
Parameters  : value    Lower 90%  Upper 90%
kT [keV]    : 13.9878  (-1.35889  1.51222)
R^2/D10^2   : 2.96545E-02  (-0.0092425   0.0133894)
(R is the radius in km and D10 is the distance to the source in units of 10 kpc)
------------------------------------------------------------
#Fit statistic : Chi-Squared =          99.90 using 59 PHA bins.
# Reduced chi-squared =          1.753 for     57 degrees of freedom
# Null hypothesis probability =   3.849083e-04

Energy  Fluence     90% Error
[keV]   [erg/cm2]   [erg/cm2]
15- 25  3.444e-07   4.805e-08
25- 50  1.280e-06   1.346e-07
50-150  1.648e-06   2.768e-07
15-150  3.273e-06   3.147e-07
Thermal bremsstrahlung (OTTB)

Spectral model: thermal bremsstrahlung
------------------------------------------------------------
Parameters  : value         Lower 90%    Upper 90%
kT [keV]    : 149.411       (-44.9569      -148.463)
Norm        : 0.888488       (-0.0765632     0.0963739)
------------------------------------------------------------
#Fit statistic : Chi-Squared =          52.05 using 59 PHA bins.
# Reduced chi-squared =         0.9131 for     57 degrees of freedom
# Null hypothesis probability =   6.608950e-01

Energy  Fluence     90% Error
[keV]   [erg/cm2]   [erg/cm2]
15- 25  6.414e-07   7.461e-08
25- 50  1.188e-06   2.157e-07
50-150  2.342e-06   1.036e-06
15-150  4.171e-06   1.243e-06
Double BB

Spectral model: bbodyrad<1> + bbodyrad<2>
------------------------------------------------------------
Parameters  : value         Lower 90%    Upper 90%
kT1 [keV]   : 5.82196        (-1.24617      1.46522)
R1^2/D10^2  : 0.470792        (-0.263288      0.765646)
kT2 [keV]   : 22.6362        (-3.7637      5.91461)
R2^2/D10^2  : 4.25180E-03    (-0.0024539   0.0042703)
------------------------------------------------------------
#Fit statistic : Chi-Squared =          50.87 using 59 PHA bins.
# Reduced chi-squared =         0.9249 for     55 degrees of freedom
# Null hypothesis probability =   6.330330e-01

Energy  Fluence     90% Error
[keV]   [erg/cm2]   [erg/cm2]
15- 25  6.816e-07   2.285e-07
25- 50  1.133e-06   2.714e-07
50-150  2.344e-06   7.080e-07
15-150  4.159e-06   1.143e-06
Peak spectrum fit
Power-law model
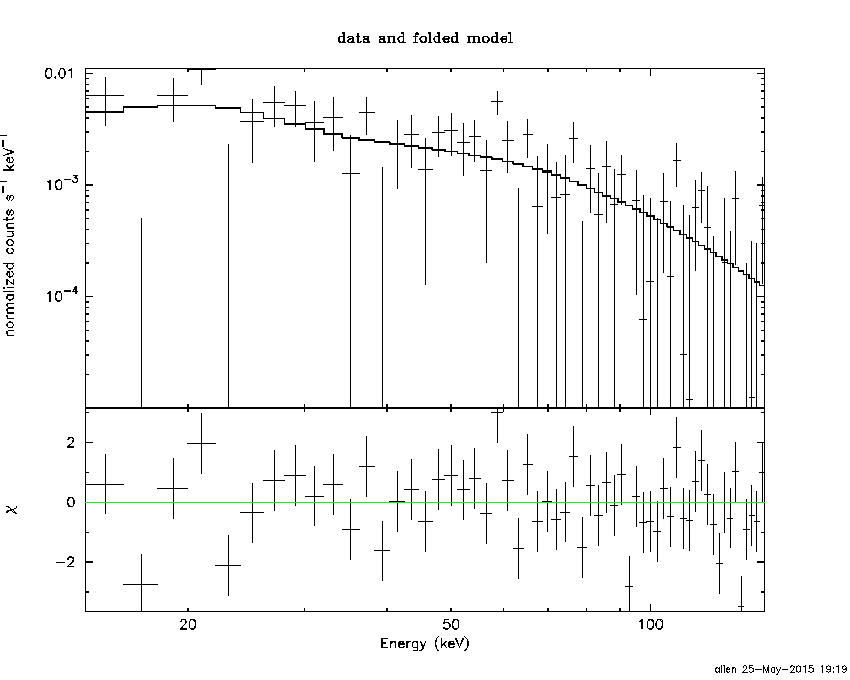
Time interval is from  110.776 sec. to  111.776 sec.

Spectral model in power-law:
------------------------------------------------------------
Parameters  : value       lower 90%   higher 90%
Photon index: 1.43877     ( -0.273148   0.274083 )
Norm@50keV  : 1.36263E-02    ( -0.00232446   0.0023192 )
------------------------------------------------------------
#Fit statistic : Chi-Squared =          84.39 using 59 PHA bins.
# Reduced chi-squared =          1.480 for     57 degrees of freedom
# Null hypothesis probability =   1.068504e-02

Photon flux (15-150 keV)    in 1 sec: 1.67460 ( -0.291877  0.293056 ) ph/cm2/s
Energy fluence (15-150 keV)             : 1.30667e-07 ( -2.38706e-08  2.4141e-08 ) ergs/cm2
Cutoff power-law model

Time interval is from  110.776 sec. to  111.776 sec.
Spectral model in the cutoff power-law:
------------------------------------------------------------
Parameters  : value       lower 90%   higher 90%
Photon index: 4.09273E-02     ( -1.74979   1.24477 )
Epeak [keV] : 72.1688      ( -17.4786 142.892 )
Norm@50keV  : 6.58457E-02    ( -0.0658457   0.371917 )
------------------------------------------------------------
#Fit statistic : Chi-Squared =          80.61 using 59 PHA bins.
# Reduced chi-squared =          1.440 for     56 degrees of freedom
# Null hypothesis probability =   1.728846e-02

Photon flux (15-150 keV)    in 1 sec: 1.58645 ( -0.30432  0.30461 ) ph/cm2/s
Energy fluence (15-150 keV)             : 1.21113e-07 ( -2.49796e-08  2.5794e-08 ) ergs/cm2
Band function

Time interval is from  110.776 sec. to  111.776 sec.

Spectral model in the Band function:
------------------------------------------------------------
Parameters  : value       lower 90%   higher 90%
alpha       : -0.166794   ( -1.12569   4.92938 )
beta        : -9.37166    ( 9.37167   19.3717 )
Epeak [keV] : 75.6139      ( -19.1951 126.017 )
Norm@50keV   : 5.60501E-02    ( -0.0561153   0.0909859 )
------------------------------------------------------------
#Fit statistic : Chi-Squared =          80.65 using 59 PHA bins.
# Reduced chi-squared =          1.466 for     55 degrees of freedom
# Null hypothesis probability =   1.370894e-02

Photon flux (15-150 keV)    in 1 sec:  (    ) ph/cm2/s
Energy fluence (15-150 keV)             : 1.22809e-07 ( 0  0 ) ergs/cm2
Single BB

Spectral model blackbody:
------------------------------------------------------------
Parameters  : value    Lower 90%  Upper 90%
kT [keV]    : 15.9460  (-2.65691  3.33833)
R^2/D10^2   : 0.163792  (-0.080585   0.148308)
(R is the radius in km and D10 is the distance to the source in units of 10 kpc)
------------------------------------------------------------
#Fit statistic : Chi-Squared =          82.73 using 59 PHA bins.
# Reduced chi-squared =          1.451 for     57 degrees of freedom
# Null hypothesis probability =   1.461285e-02

Energy  Fluence     90% Error
[keV]   [erg/cm2]   [erg/cm2]
15- 25  8.618e-09   2.773e-09
25- 50  3.616e-08   9.925e-09
50-150  6.418e-08   2.182e-08
15-150  1.090e-07   2.853e-08
Thermal bremsstrahlung (OTTB)

Spectral model: thermal bremsstrahlung
------------------------------------------------------------
Parameters  : value         Lower 90%    Upper 90%
kT [keV]    : 199.359       (-87.6776      -199.363)
Norm        : 6.98316       (-1.17304     1.17498)
------------------------------------------------------------
#Fit statistic : Chi-Squared =          83.37 using 59 PHA bins.
# Reduced chi-squared =          1.463 for     57 degrees of freedom
# Null hypothesis probability =   1.295961e-02

Energy  Fluence     90% Error
[keV]   [erg/cm2]   [erg/cm2]
15- 25  1.739e-08   1.002e-08
25- 50  3.345e-08   1.915e-08
50-150  7.336e-08   4.200e-08
15-150  1.242e-07   7.055e-08
Double BB

Spectral model: bbodyrad<1> + bbodyrad<2>
------------------------------------------------------------
Parameters  : value         Lower 90%    Upper 90%
kT1 [keV]   : 5.79845        (-5.8016      -5.8016)
R1^2/D10^2  : 1.80100        (-1.79844      -1.79844)
kT2 [keV]   : 18.8764        (-4.47306      -18.8776)
R2^2/D10^2  : 8.07327E-02    (-0.0807078   0.146712)
------------------------------------------------------------
#Fit statistic : Chi-Squared =          80.43 using 59 PHA bins.
# Reduced chi-squared =          1.462 for     55 degrees of freedom
# Null hypothesis probability =   1.428254e-02

Energy  Fluence     90% Error
[keV]   [erg/cm2]   [erg/cm2]
15- 25  1.332e-08   7.690e-09
25- 50  3.421e-08   1.876e-08
50-150  7.153e-08   4.039e-08
15-150  1.190e-07   6.310e-08
Pre-slew spectrum (Pre-slew PHA with pre-slew DRM)
Power-law model
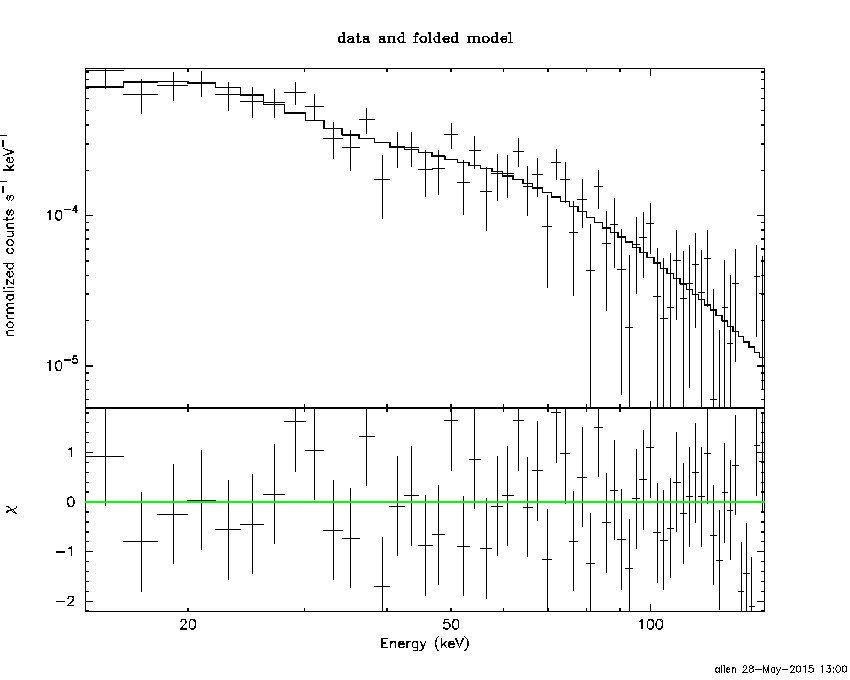
Spectral model in power-law:
------------------------------------------------------------
Parameters  : value       lower 90%   higher 90%
Photon index: 1.68386     ( -0.134626   0.136757 )
Norm@50keV  : 1.64069E-03    ( -0.000129565   0.000128607 )
------------------------------------------------------------
#Fit statistic : Chi-Squared =          52.02 using 59 PHA bins.
# Reduced chi-squared =         0.9126 for     57 degrees of freedom
# Null hypothesis probability =   6.620659e-01

Photon flux (15-150 keV)    in 281 sec: 0.216687 ( -0.0167724  0.0168065 ) ph/cm2/s
Energy fluence (15-150 keV)             : 4.27429e-06 ( -3.53897e-07  3.56227e-07 ) ergs/cm2
Cutoff power-law model

Spectral model in the cutoff power-law:
------------------------------------------------------------
Parameters  : value       lower 90%   higher 90%
Photon index: 1.48436     ( -0.540462   0.317346 )
Epeak [keV] : 128.410      ( -62.2104 -128.41 )
Norm@50keV  : 2.07263E-03    ( -0.000618252   0.00176506 )
------------------------------------------------------------
#Fit statistic : Chi-Squared =          51.55 using 59 PHA bins.
# Reduced chi-squared =         0.9205 for     56 degrees of freedom
# Null hypothesis probability =   6.439987e-01

Photon flux (15-150 keV)    in 281 sec: 0.214487 ( -0.017593  0.017595 ) ph/cm2/s
Energy fluence (15-150 keV)             : 4.215e-06 ( -3.86178e-07  3.85448e-07 ) ergs/cm2
Band function
Spectral model in the Band function:
------------------------------------------------------------
Parameters  : value       lower 90%   higher 90%
alpha       : -1.48775   ( 1.48742   0.483377 )
beta        : -9.36060    ( 9.37162   19.3716 )
Epeak [keV] : 128.747      ( -65.2265 -129.107 )
Norm@50keV   : 2.06808E-03    ( -0.000541388   0.000718228 )
------------------------------------------------------------
#Fit statistic : Chi-Squared =          51.55 using 59 PHA bins.
# Reduced chi-squared =         0.9372 for     55 degrees of freedom
# Null hypothesis probability =   6.074043e-01

Photon flux (15-150 keV)    in 281 sec:  (    ) ph/cm2/s
Energy fluence (15-150 keV)             : 0 ( 0  0 ) ergs/cm2
S(25-50 keV) vs. S(50-100 keV) plot

S(25-50 keV)  = 1.15e-06
S(50-100 keV) = 1.43e-06
T90 vs. Hardness ratio plot

T90                                   = 243.595999956131 sec.
Hardness ratio (energy fluence ratio) = 1.24348
Color vs. Color plot

Count Ratio  (25-50 keV) / (15-25 keV) = 1.26414
Count Ratio (50-100 keV) / (15-25 keV) = 0.936963
Mask shadow pattern

IMX = -5.948195043325304E-01, IMY = -4.229690919355226E-01
TIME vs. PHA plot around the trigger time

Blue+Cyan dotted lines: Time interval of the scaled map
From 0.000000 to 64.000000
TIME vs. DetID plot around the trigger time

Blue+Cyan dotted lines: Time interval of the scaled map
From 0.000000 to 64.000000
100 us light curve (15-350 keV)

Blue+Cyan dotted lines: Time interval of the scaled map
From 0.000000 to 64.000000
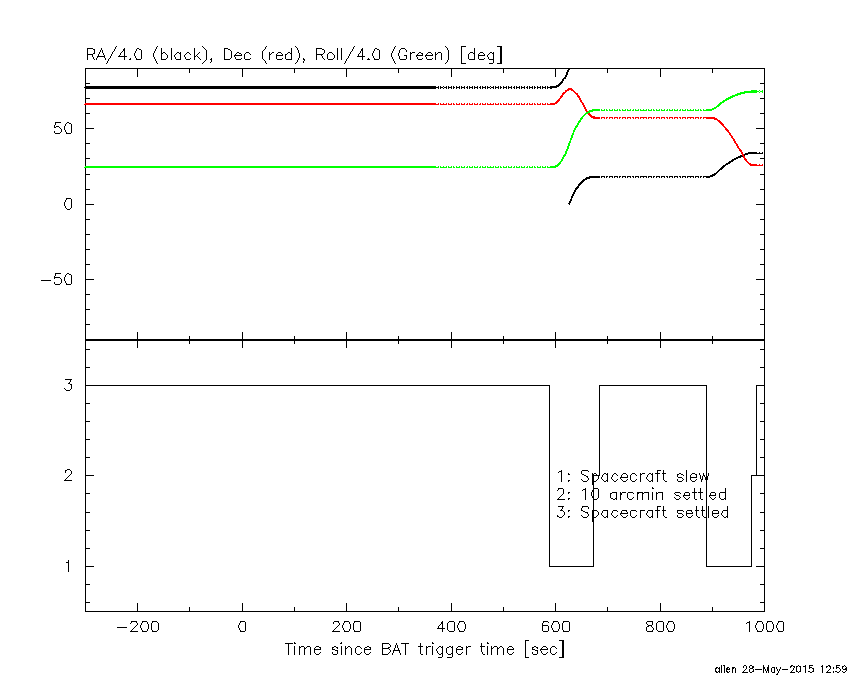
Spacecraft aspect plot
Bright source in the pre-burst/pre-slew/post-slew images
Pre-burst image of 15-350 keV band
Time interval of the image:
-239.000000 -73.088000

# RAcent  DECcent POSerr Theta    Phi  PeakCts   SNR AngSep     Name
#  [deg]    [deg]    ['] [deg]  [deg]                   [']
299.5815  35.2024    0.5  31.4    7.6   5.1215  24.5    0.4	Cyg X-1
308.1455  40.9658    2.0  25.2   -5.7   1.0399   5.8    1.8	Cyg X-3
326.2542  38.3108    2.9  29.4  -35.5   0.7551   4.0    3.9	Cyg X-2
Pre-slew background subtracted image of 15-350 keV band
Time interval of the image:
-73.088000 207.956000

# RAcent  DECcent POSerr Theta    Phi  PeakCts   SNR AngSep     Name
#  [deg]    [deg]    ['] [deg]  [deg]                   [']
299.5757  35.1883    4.1  31.5    7.6   1.0191   2.8    1.1	Cyg X-1
308.0424  41.1090    9.3  25.0   -5.5   0.3796   1.2    9.9	Cyg X-3
326.2424  38.2814    7.7  29.5  -35.5  -0.5116  -1.5    4.1	Cyg X-2
154.0464  59.4199    2.7  53.1  156.7   7.2125   4.3 ------	UNKNOWN
190.3922  71.8460    1.0  36.1  144.6   6.3809  11.4 ------	UNKNOWN
268.1817  63.9108    2.5  17.2   94.0   1.5957   4.7 ------	UNKNOWN
273.3206  80.9680    2.1  17.4  154.1   1.5377   5.4 ------	UNKNOWN
 76.7910  55.5484    2.3  52.1 -153.2   4.5496   5.0 ------	UNKNOWN
347.9997  28.1634    2.7  44.7  -59.3   5.0119   4.3 ------	UNKNOWN
Post-slew image of 15-350 keV band
Time interval of the image:
672.400620 889.100600

# RAcent  DECcent POSerr Theta    Phi  PeakCts   SNR AngSep     Name
#  [deg]    [deg]    ['] [deg]  [deg]                   [']
 83.6417  22.0106    0.3  36.3 -175.9   8.9418  33.7    0.5	Crab
175.4580  77.5871    2.4  37.1   41.4   1.7887   4.8 ------	UNKNOWN
 65.6015  68.9937    2.1  12.0    8.4   0.9720   5.5 ------	UNKNOWN
346.5268  68.3153    2.2  37.3  -16.4   1.3008   5.2 ------	UNKNOWN
311.8444  59.2783    3.2  54.4  -11.5   2.2769   3.6 ------	UNKNOWN
 61.8622  31.4956    2.3  27.0 -137.8   1.1368   5.1 ------	UNKNOWN
326.4173  54.2878    2.0  53.5  -23.0   3.4928   5.7 ------	UNKNOWN
 29.9490  33.7014    4.1  37.3  -89.6   1.7744   2.8 ------	UNKNOWN
Plot creation:
Thu May 28 13:00:48 EDT 2015