Special notes of this burst
Image
Pre-slew 15.0-350.0 keV image (Event data)
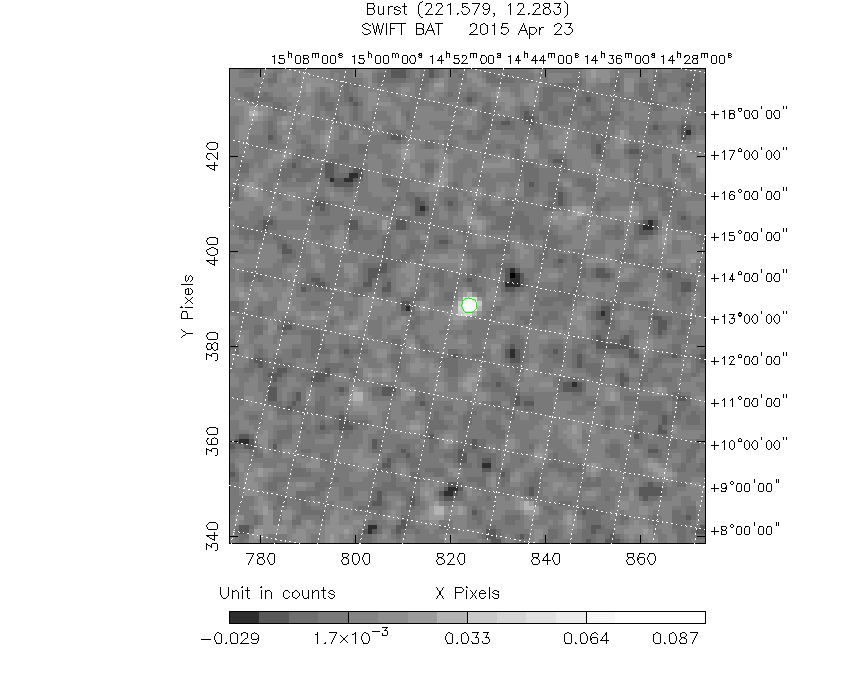
#   RAcent    DECcent   POSerr    Theta     Phi              Peak Cts       SNR   Name
  221.6026    12.2659   0.0153    12.3481    57.6330         0.0982011     12.534 TRIG_00638808

Foreground time interval of the image:
  0.008   0.240 (delta_t =   0.232 [sec])
Background time interval of the image:
-719.875 -701.655 (delta_t =  18.221 [sec])
-239.176   0.008 (delta_t = 239.184 [sec])
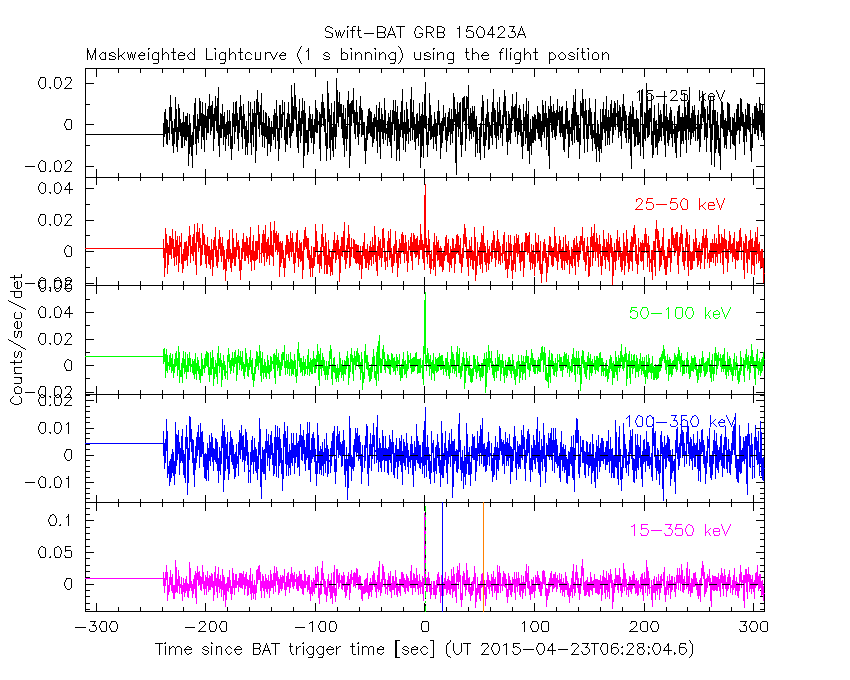
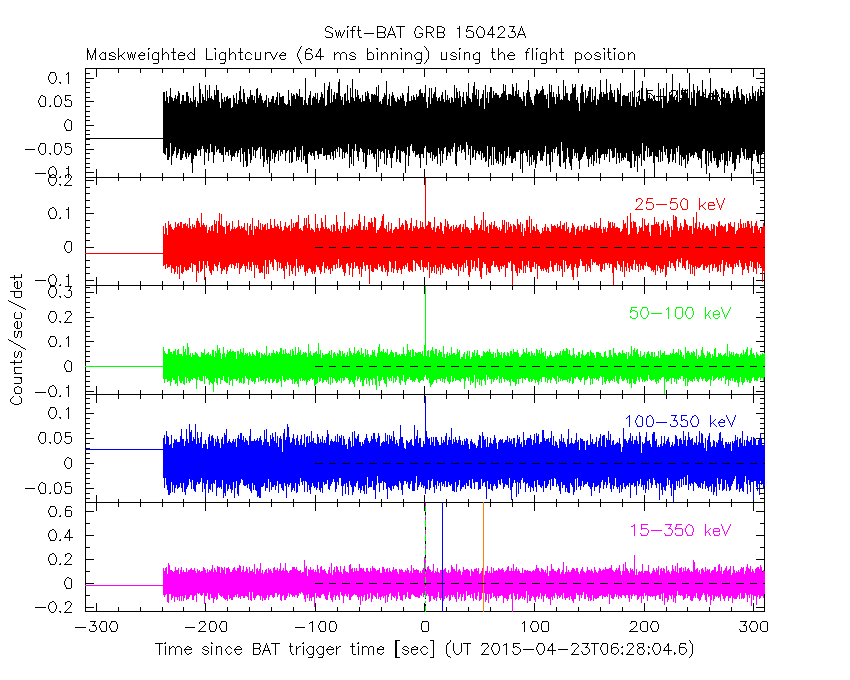
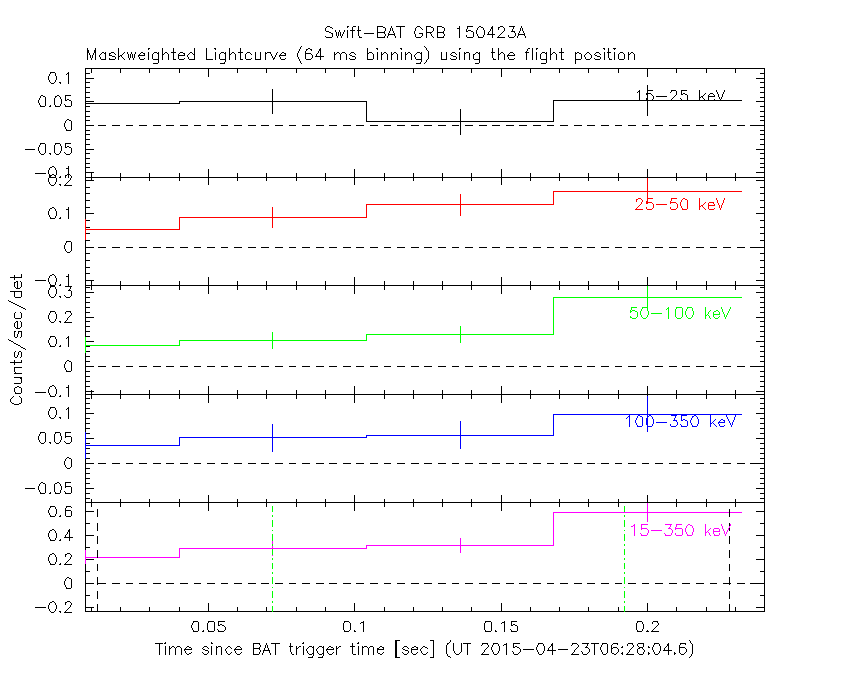
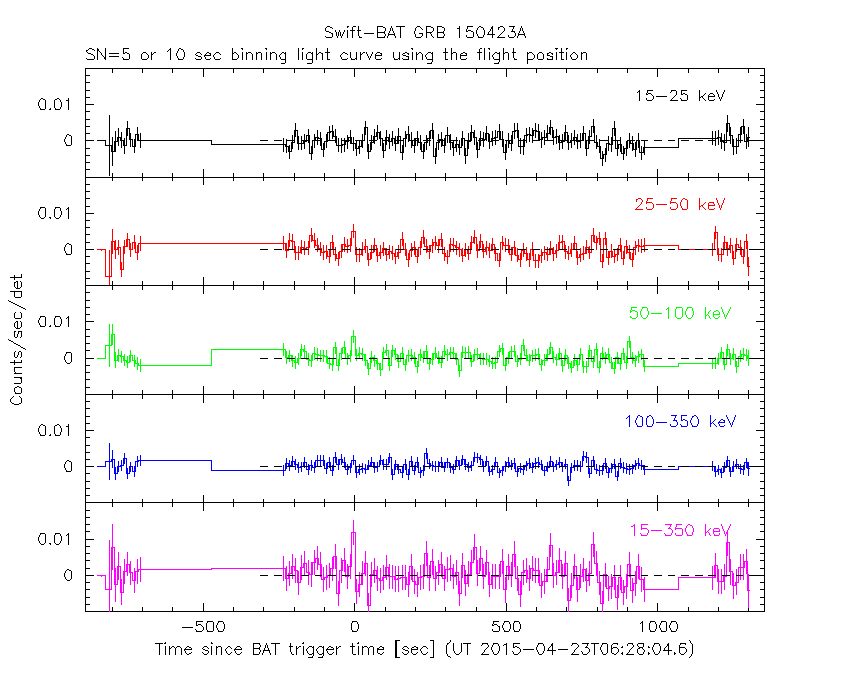
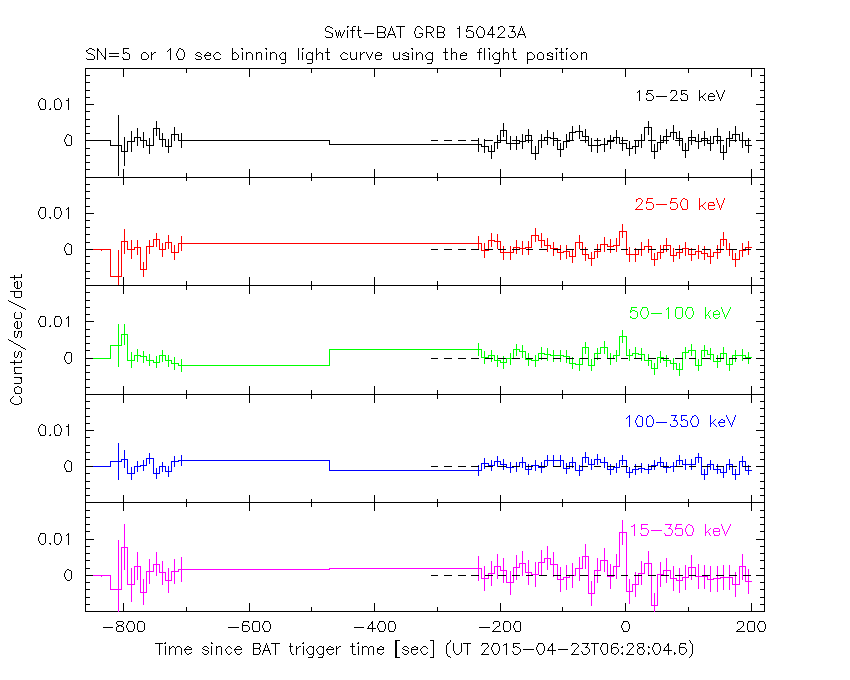
Lightcurves
Notes:
- 1) The mask-weighted light curves are using the flight position.
- 2) Multiple plots of different time binning/intervals are shown to cover all scenarios of short/long GRBs, rate/image triggers, and real/false positives.
- 3) For all the mask-weighted lightcurves, the y-axis units are counts/sec/det where a det is 0.4 x 0.4 = 0.16 sq cm.
- 4) The verticle lines correspond to following: green dotted lines are T50 interval, black dotted lines are T90 interval, blue solid line(s) is a spacecraft slew start time, and orange solid line(s) is a spacecraft slew end time.
- 5) Time of each bin is in the middle of the bin.
1 s binning
From T0-310 s to T0+310 s
From T100_start - 20 s to T100_end + 30 s

Full time interval

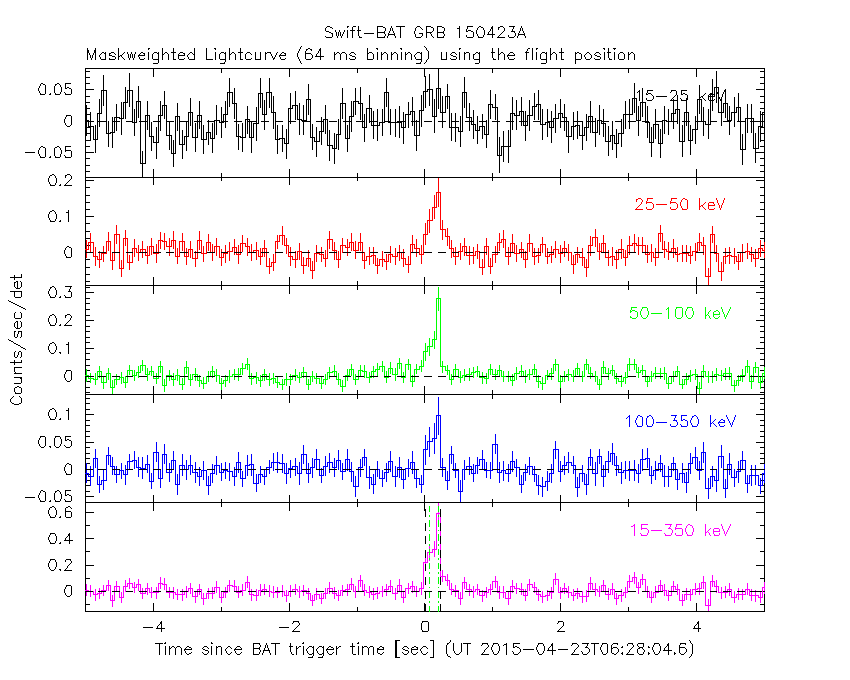
64 ms binning
Full time interval
From T100_start to T100_end
From T0-5 sec to T0+5 sec
16 ms binning
From T100_start-5 s to T100_start+5 s
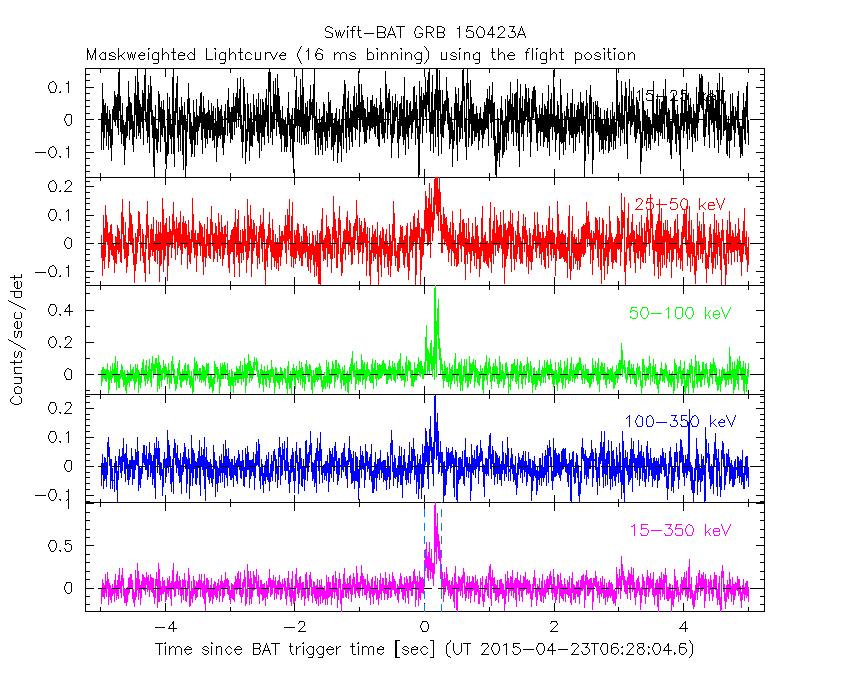
Blue+Cyan dotted lines: Time interval of the scaled map
From 0.000000 to 0.256000
8 ms binning
From T100_start-3 s to T100_start+3 s
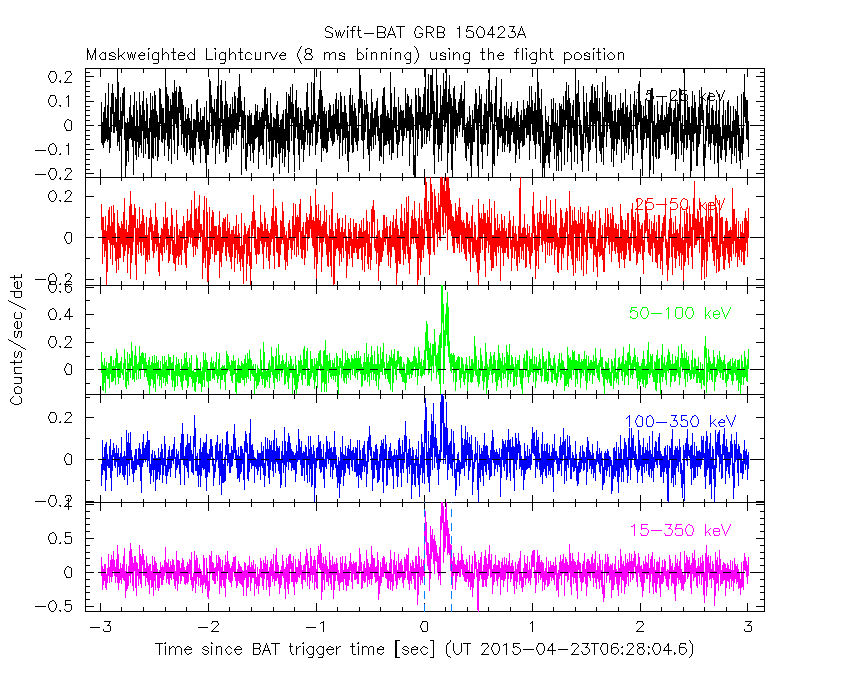
Blue+Cyan dotted lines: Time interval of the scaled map
From 0.000000 to 0.256000
2 ms binning
From T100_start-1 s to T100_start+1 s
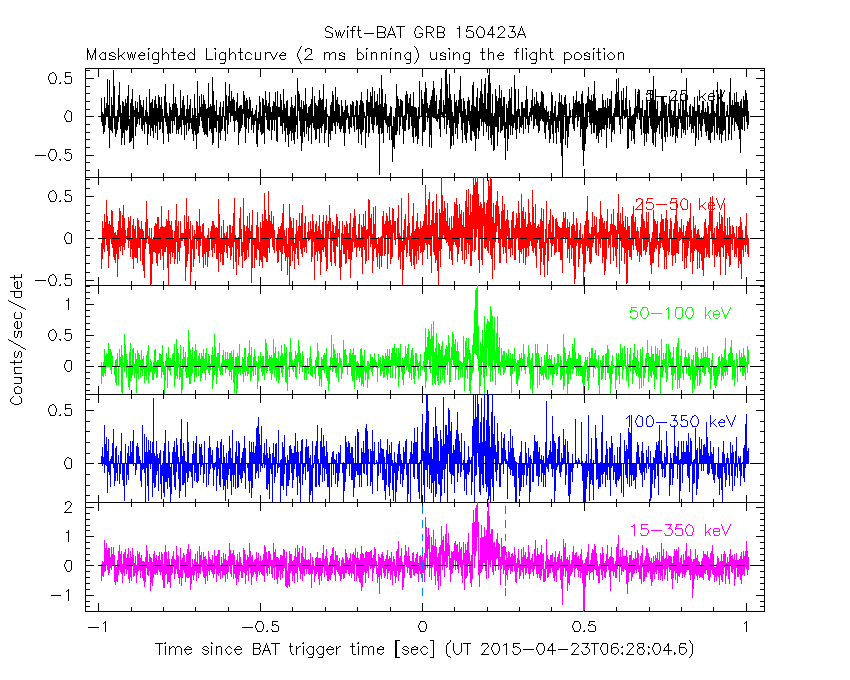
Blue+Cyan dotted lines: Time interval of the scaled map
From 0.000000 to 0.256000
SN=5 or 10 sec. binning (whichever binning is satisfied first)
SN=5 or 10 sec. binning (T < 200 sec)
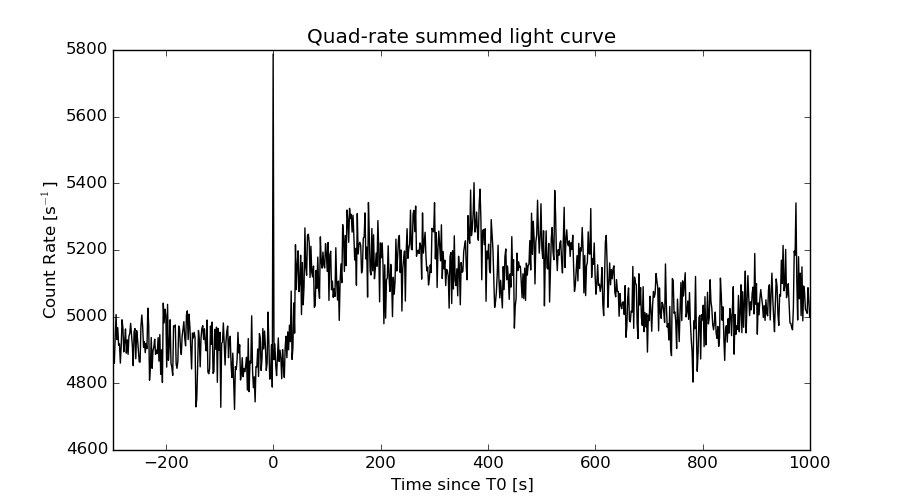
Quad-rate summed light curves (from T0-300s to T0+1000s)
Spectral Evolution
Spectra
Notes:
- 1) The fitting includes the systematic errors.
- 2) When the burst includes telescope slew time periods, the fitting uses an average response file made from multiple 5-s response files through out the slew time plus single time preiod for the non-slew times, and weighted by the total counts in the corresponding time period using addrmf. An average response file is needed becuase a spectral fit using the pre-slew DRM will introduce some errors in both a spectral shape and a normalization if the PHA file contains a lot of the slew/post-slew time interval.
- 3) For fits to more complicated models (e.g. a power-law over a cutoff power-law), the BAT team has decided to require a chi-square improvement of more than 6 for each extra dof.
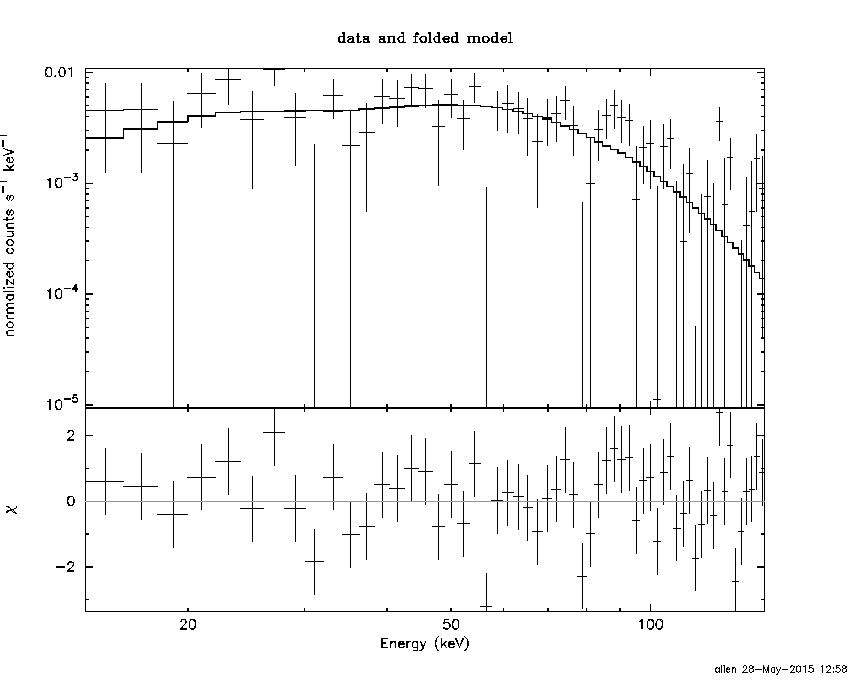
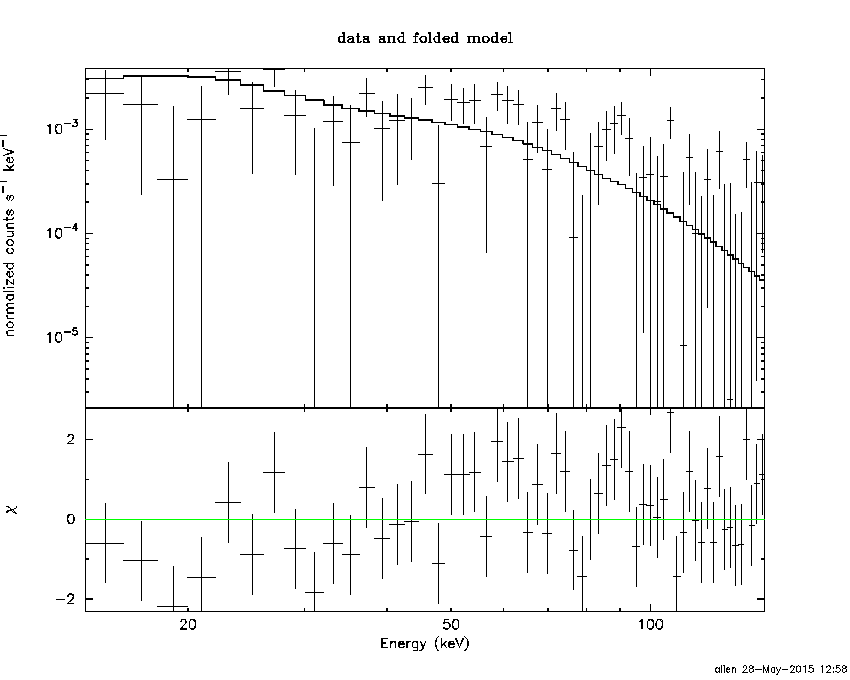
Time averaged spectrum fit using the average DRM
Power-law model

Time interval is from    0.008 sec. to    0.240 sec.

Spectral model in power-law:
------------------------------------------------------------
Parameters  : value       lower 90%   higher 90%
Photon index: 0.771052     ( -0.23805   0.229765 )
Norm@50keV  : 2.39279E-02    ( -0.00345842   0.00343979 )
------------------------------------------------------------
#Fit statistic : Chi-Squared =          78.22 using 59 PHA bins.
# Reduced chi-squared =          1.372 for     57 degrees of freedom
# Null hypothesis probability =   3.254926e-02

Photon flux (15-150 keV)    in 0.232 sec: 2.75338 ( -0.391357  0.391676 ) ph/cm2/s
Energy fluence (15-150 keV)             : 6.5675e-08 ( -1.02844e-08  1.03742e-08 ) ergs/cm2
Cutoff power-law model

Time interval is from    0.008 sec. to    0.240 sec.
Spectral model in the cutoff power-law:
------------------------------------------------------------
Parameters  : value       lower 90%   higher 90%
Photon index: -0.443047     ( -1.40415   1.04979 )
Epeak [keV] : 120.501      ( -35.22 319.493 )
Norm@50keV  : 7.83705E-02    ( -0.0495546   0.195899 )
------------------------------------------------------------
#Fit statistic : Chi-Squared =          74.20 using 59 PHA bins.
# Reduced chi-squared =          1.325 for     56 degrees of freedom
# Null hypothesis probability =   5.217618e-02

Photon flux (15-150 keV)    in 0.232 sec: 2.66402 ( -0.40308  0.40128 ) ph/cm2/s
Energy fluence (15-150 keV)             : 6.30857e-08 ( -1.09813e-08  1.09657e-08 ) ergs/cm2
Band function

Time interval is from    0.008 sec. to    0.240 sec.

Spectral model in the Band function:
------------------------------------------------------------
Parameters  : value       lower 90%   higher 90%
alpha       : -0.942174   ( 0.941938   0.941938 )
beta        : -0.771258    ( -0.229865   0.237564 )
Epeak [keV] : 13.0940      ( -13.0947 -13.0947 )
Norm@50keV   : 3.55841E-02    ( -0.0150744   0 )
------------------------------------------------------------
#Fit statistic : Chi-Squared =          78.22 using 59 PHA bins.
# Reduced chi-squared =          1.422 for     55 degrees of freedom
# Null hypothesis probability =   2.148860e-02

Photon flux (15-150 keV)    in 0.232 sec:  (    ) ph/cm2/s
Energy fluence (15-150 keV)             : 0 ( 0  0 ) ergs/cm2
Single BB
Spectral model blackbody:
------------------------------------------------------------
Parameters  : value    Lower 90%  Upper 90%
kT [keV]    : 24.7209  (-3.98974  5.17876)
R^2/D10^2   : 7.59759E-02  (-0.0324968   0.0523632)
(R is the radius in km and D10 is the distance to the source in units of 10 kpc)
------------------------------------------------------------
#Fit statistic : Chi-Squared =          75.29 using 59 PHA bins.
# Reduced chi-squared =          1.321 for     57 degrees of freedom
# Null hypothesis probability =   5.269970e-02

Energy  Fluence     90% Error
[keV]   [erg/cm2]   [erg/cm2]
15- 25  1.882e-09   5.426e-10
25- 50  1.062e-08   2.551e-09
50-150  4.819e-08   1.283e-08
15-150  6.069e-08   1.452e-08
Thermal bremsstrahlung (OTTB)
Spectral model: thermal bremsstrahlung
------------------------------------------------------------
Parameters  : value         Lower 90%    Upper 90%
kT [keV]    : 200.000       (      )
Norm        : 10.0182       (-1.56293     1.5629)
------------------------------------------------------------
#Fit statistic : Chi-Squared =         104.48 using 59 PHA bins.
# Reduced chi-squared =         1.8329 for     57 degrees of freedom
# Null hypothesis probability =   1.280494e-04

Energy  Fluence     90% Error
[keV]   [erg/cm2]   [erg/cm2]
15- 25  5.746e-09   3.287e-09
25- 50  1.105e-08   6.395e-09
50-150  2.424e-08   1.361e-08
15-150  4.104e-08   2.356e-08
Double BB
Spectral model: bbodyrad<1> + bbodyrad<2>
------------------------------------------------------------
Parameters  : value         Lower 90%    Upper 90%
kT1 [keV]   : 6.15727        (-6.15766      -6.15766)
R1^2/D10^2  : 1.12544        (-1.12522      11.8674)
kT2 [keV]   : 27.4483        (-5.66922      -27.4485)
R2^2/D10^2  : 5.29103E-02    (-0.0529085   0.05539)
------------------------------------------------------------
#Fit statistic : Chi-Squared =          73.65 using 59 PHA bins.
# Reduced chi-squared =          1.339 for     55 degrees of freedom
# Null hypothesis probability =   4.728892e-02

Energy  Fluence     90% Error
[keV]   [erg/cm2]   [erg/cm2]
15- 25  2.889e-09   1.610e-09
25- 50  1.049e-08   5.275e-09
50-150  4.977e-08   2.412e-08
15-150  6.315e-08   3.177e-08
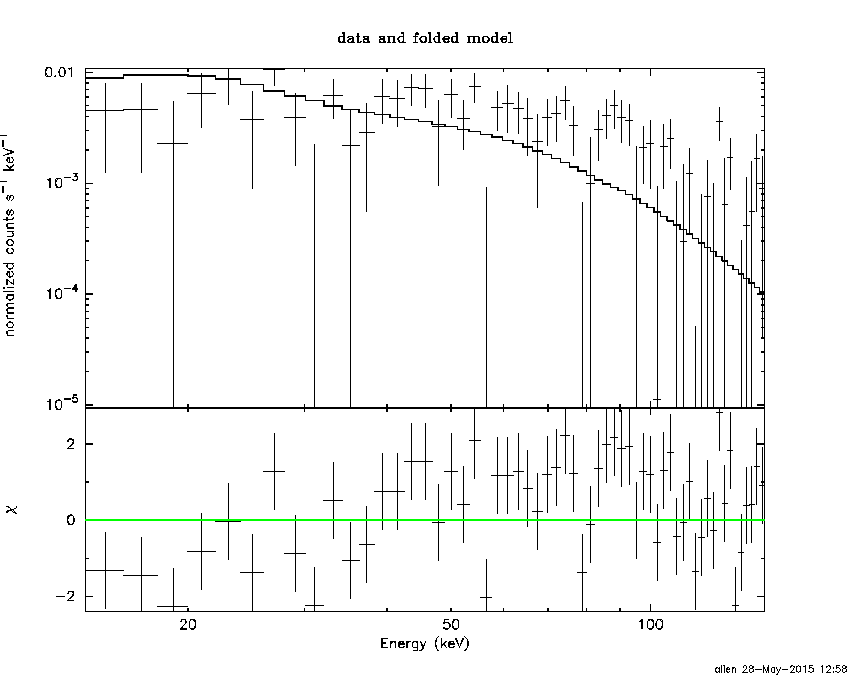
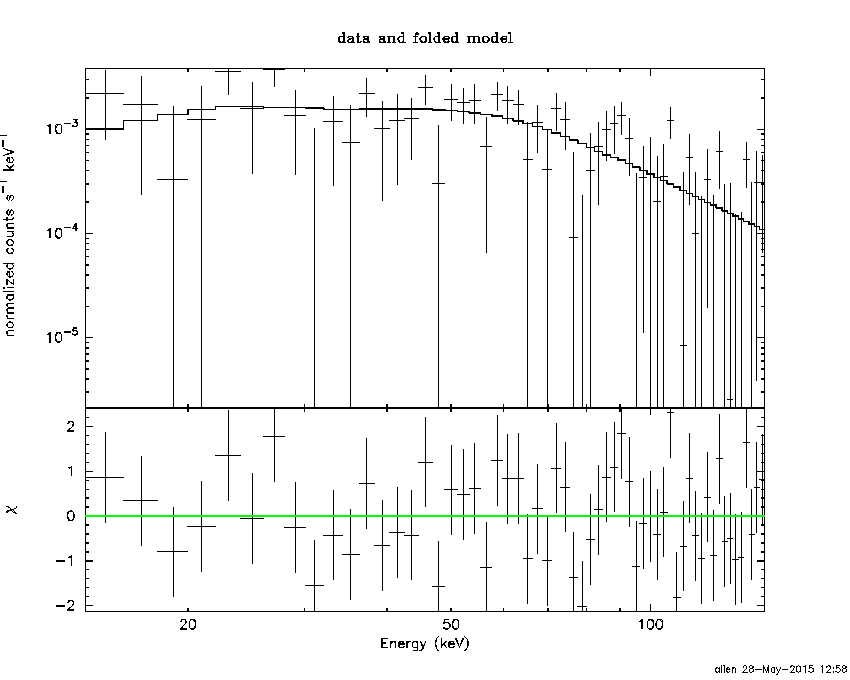
Peak spectrum fit
Power-law model

Time interval is from   -0.374 sec. to    0.626 sec.

Spectral model in power-law:
------------------------------------------------------------
Parameters  : value       lower 90%   higher 90%
Photon index: 0.857667     ( -0.295485   0.277593 )
Norm@50keV  : 7.50190E-03    ( -0.00125115   0.00123674 )
------------------------------------------------------------
#Fit statistic : Chi-Squared =          58.66 using 59 PHA bins.
# Reduced chi-squared =          1.029 for     57 degrees of freedom
# Null hypothesis probability =   4.145131e-01

Photon flux (15-150 keV)    in 1 sec: 0.861081 ( -0.141605  0.142179 ) ph/cm2/s
Energy fluence (15-150 keV)             : 8.56113e-08 ( -1.47896e-08  1.49395e-08 ) ergs/cm2
Cutoff power-law model
Time interval is from   -0.374 sec. to    0.626 sec.
Spectral model in the cutoff power-law:
------------------------------------------------------------
Parameters  : value       lower 90%   higher 90%
Photon index: -1.08719E-02     ( -1.79621   0.989659 )
Epeak [keV] : 134.953      (   )
Norm@50keV  : 1.78272E-02    (     )
------------------------------------------------------------
#Fit statistic : Chi-Squared =          57.33 using 59 PHA bins.
# Reduced chi-squared =          1.024 for     56 degrees of freedom
# Null hypothesis probability =   4.256099e-01

Photon flux (15-150 keV)    in 1 sec: 0.829010 ( -0.152179  0.150367 ) ph/cm2/s
Energy fluence (15-150 keV)             : 8.17093e-08 ( -1.66304e-08  1.62842e-08 ) ergs/cm2
Band function

Time interval is from   -0.374 sec. to    0.626 sec.

Spectral model in the Band function:
------------------------------------------------------------
Parameters  : value       lower 90%   higher 90%
alpha       : 5.00000   ( -5   -5 )
beta        : -0.954752    ( -0.333743   0.332202 )
Epeak [keV] : 32.8792      ( -31.6533 19.9444 )
Norm@50keV   : 96.0741    ( -15.2826   1.32487e+06 )
------------------------------------------------------------
#Fit statistic : Chi-Squared =          58.24 using 59 PHA bins.
# Reduced chi-squared =          1.059 for     55 degrees of freedom
# Null hypothesis probability =   3.570941e-01

Photon flux (15-150 keV)    in 1 sec:  (    ) ph/cm2/s
Energy fluence (15-150 keV)             : 0 ( 0  0 ) ergs/cm2
Single BB

Spectral model blackbody:
------------------------------------------------------------
Parameters  : value    Lower 90%  Upper 90%
kT [keV]    : 23.1256  (-4.32071  6.12598)
R^2/D10^2   : 2.74950E-02  (-0.0140146   0.0250456)
(R is the radius in km and D10 is the distance to the source in units of 10 kpc)
------------------------------------------------------------
#Fit statistic : Chi-Squared =          59.06 using 59 PHA bins.
# Reduced chi-squared =          1.036 for     57 degrees of freedom
# Null hypothesis probability =   4.000750e-01

Energy  Fluence     90% Error
[keV]   [erg/cm2]   [erg/cm2]
15- 25  2.658e-09   1.034e-09
25- 50  1.446e-08   4.138e-09
50-150  5.777e-08   1.808e-08
15-150  7.489e-08   1.983e-08
Thermal bremsstrahlung (OTTB)
Spectral model: thermal bremsstrahlung
------------------------------------------------------------
Parameters  : value         Lower 90%    Upper 90%
kT [keV]    : 200.000       (      )
Norm        : 3.41114       (-0.589006     0.588973)
------------------------------------------------------------
#Fit statistic : Chi-Squared =          74.25 using 59 PHA bins.
# Reduced chi-squared =          1.303 for     57 degrees of freedom
# Null hypothesis probability =   6.212776e-02

Energy  Fluence     90% Error
[keV]   [erg/cm2]   [erg/cm2]
15- 25  8.498e-09   4.894e-09
25- 50  1.635e-08   9.245e-09
50-150  3.585e-08   2.093e-08
15-150  6.070e-08   3.478e-08
Double BB
------------------------------------------------------------
#Fit statistic : Chi-Squared =          57.61 using 59 PHA bins.
#Fit statistic : Chi-Squared =          57.47 using 59 PHA bins.
#Fit statistic : Chi-Squared =          57.45 using 59 PHA bins.
#Fit statistic : Chi-Squared =          57.28 using 59 PHA bins.
# Reduced chi-squared =          1.048 for     55 degrees of freedom
# Reduced chi-squared =          1.045 for     55 degrees of freedom
# Reduced chi-squared =          1.044 for     55 degrees of freedom
# Reduced chi-squared =          1.041 for     55 degrees of freedom
# Null hypothesis probability =   3.787177e-01
# Null hypothesis probability =   3.838196e-01
# Null hypothesis probability =   3.846925e-01
# Null hypothesis probability =   3.905953e-01

Energy  Fluence     90% Error
[keV]   [erg/cm2]   [erg/cm2]
15- 25  4.441e-09   2.591e-09
25- 50  1.414e-08   6.480e-09
50-150  6.067e-08   3.535e-08
15-150  7.925e-08   4.325e-08
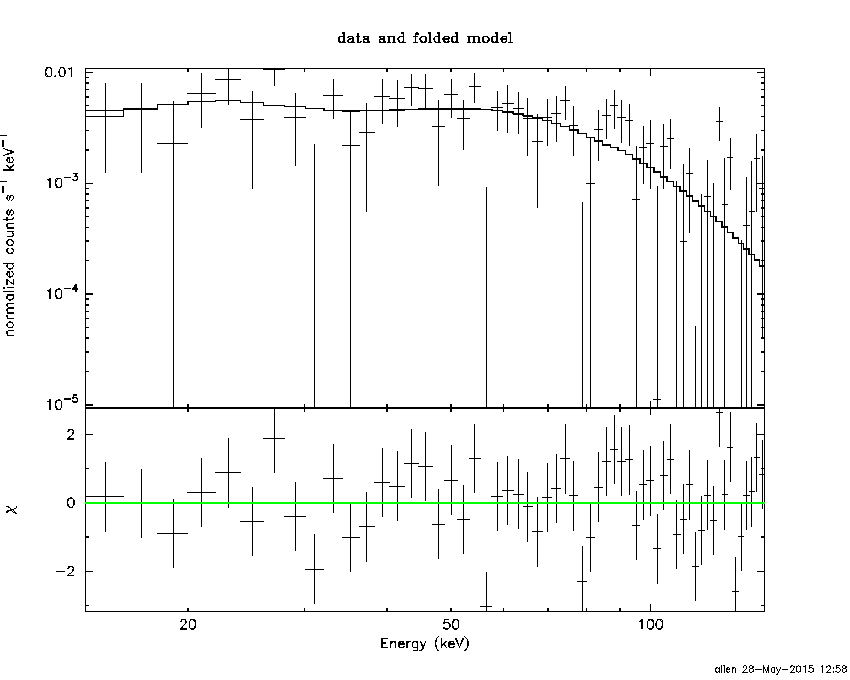
Pre-slew spectrum (Pre-slew PHA with pre-slew DRM)
Power-law model
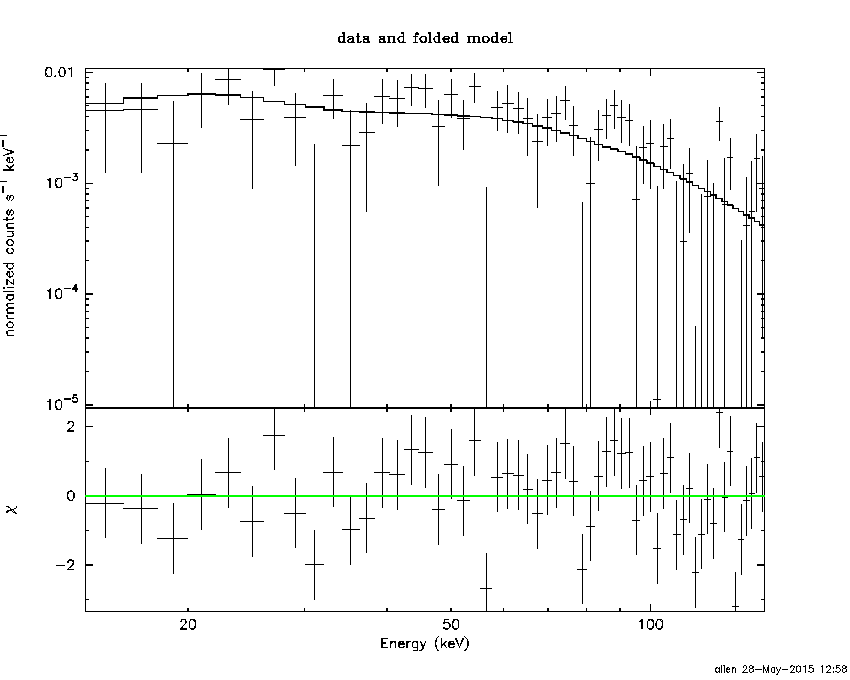
Spectral model in power-law:
------------------------------------------------------------
Parameters  : value       lower 90%   higher 90%
Photon index: 0.771052     ( -0.23805   0.229765 )
Norm@50keV  : 2.39279E-02    ( -0.00345842   0.00343979 )
------------------------------------------------------------
#Fit statistic : Chi-Squared =          78.22 using 59 PHA bins.
# Reduced chi-squared =          1.372 for     57 degrees of freedom
# Null hypothesis probability =   3.254926e-02

Photon flux (15-150 keV)    in 0.232 sec: 2.75338 ( -0.391357  0.391676 ) ph/cm2/s
Energy fluence (15-150 keV)             : 6.5675e-08 ( -1.02844e-08  1.03742e-08 ) ergs/cm2
Cutoff power-law model

Spectral model in the cutoff power-law:
------------------------------------------------------------
Parameters  : value       lower 90%   higher 90%
Photon index: -0.443047     ( -1.40415   1.04979 )
Epeak [keV] : 120.501      ( -35.22 319.493 )
Norm@50keV  : 7.83705E-02    ( -0.0495546   0.195899 )
------------------------------------------------------------
#Fit statistic : Chi-Squared =          74.20 using 59 PHA bins.
# Reduced chi-squared =          1.325 for     56 degrees of freedom
# Null hypothesis probability =   5.217618e-02

Photon flux (15-150 keV)    in 0.232 sec: 2.66402 ( -0.40308  0.40128 ) ph/cm2/s
Energy fluence (15-150 keV)             : 6.30857e-08 ( -1.09813e-08  1.09657e-08 ) ergs/cm2
Band function

Spectral model in the Band function:
------------------------------------------------------------
Parameters  : value       lower 90%   higher 90%
alpha       : -0.942174   ( 0.941938   0.941938 )
beta        : -0.771258    ( -0.229865   0.237564 )
Epeak [keV] : 13.0940      ( -13.0947 -13.0947 )
Norm@50keV   : 3.55841E-02    ( -0.0150744   0 )
------------------------------------------------------------
#Fit statistic : Chi-Squared =          78.22 using 59 PHA bins.
# Reduced chi-squared =          1.422 for     55 degrees of freedom
# Null hypothesis probability =   2.148860e-02

Photon flux (15-150 keV)    in 0.232 sec:  (    ) ph/cm2/s
Energy fluence (15-150 keV)             : 0 ( 0  0 ) ergs/cm2
S(25-50 keV) vs. S(50-100 keV) plot
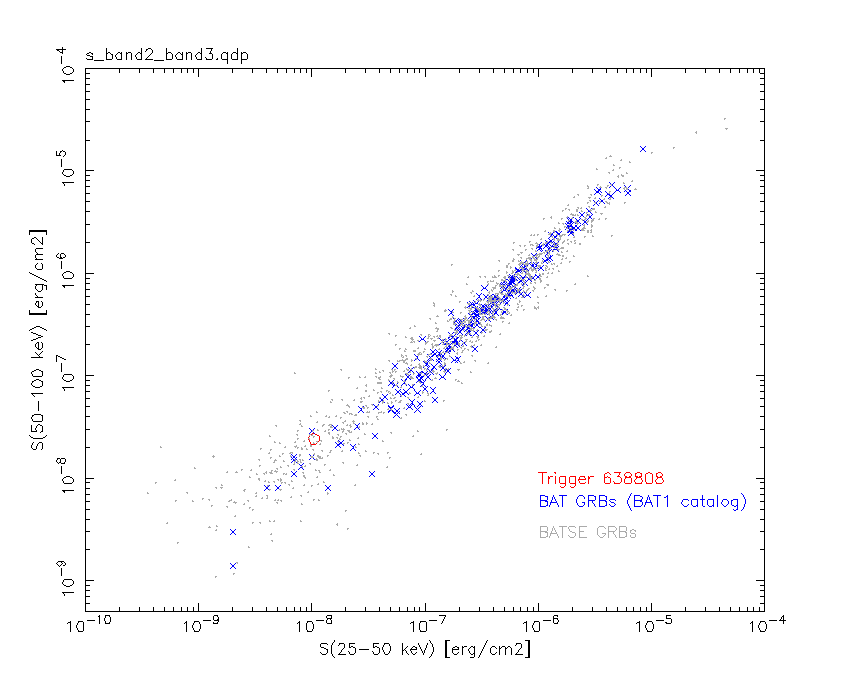
S(25-50 keV)  = 1.04e-08
S(50-100 keV) = 2.43e-08
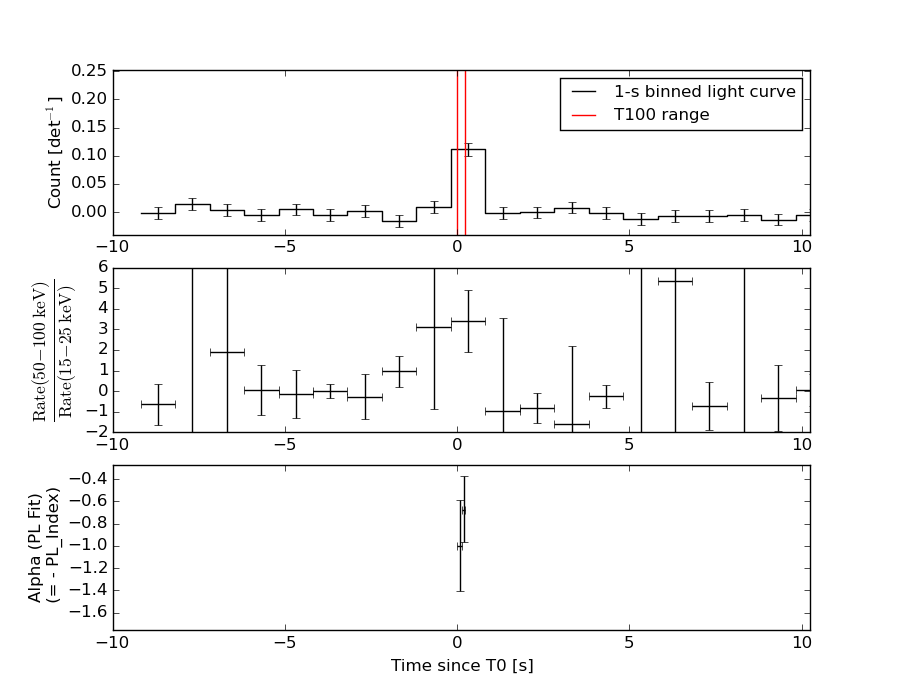
T90 vs. Hardness ratio plot

T90                                   = 0.215999901294708 sec.
Hardness ratio (energy fluence ratio) = 2.33654
Color vs. Color plot
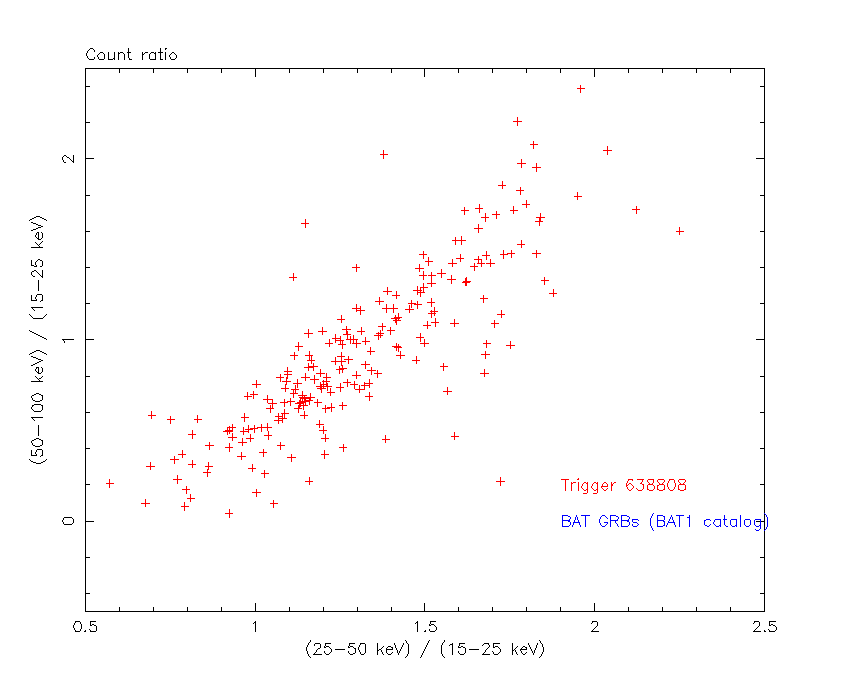
Count Ratio  (25-50 keV) / (15-25 keV) = 2.70235
Count Ratio (50-100 keV) / (15-25 keV) = 3.6709
Mask shadow pattern
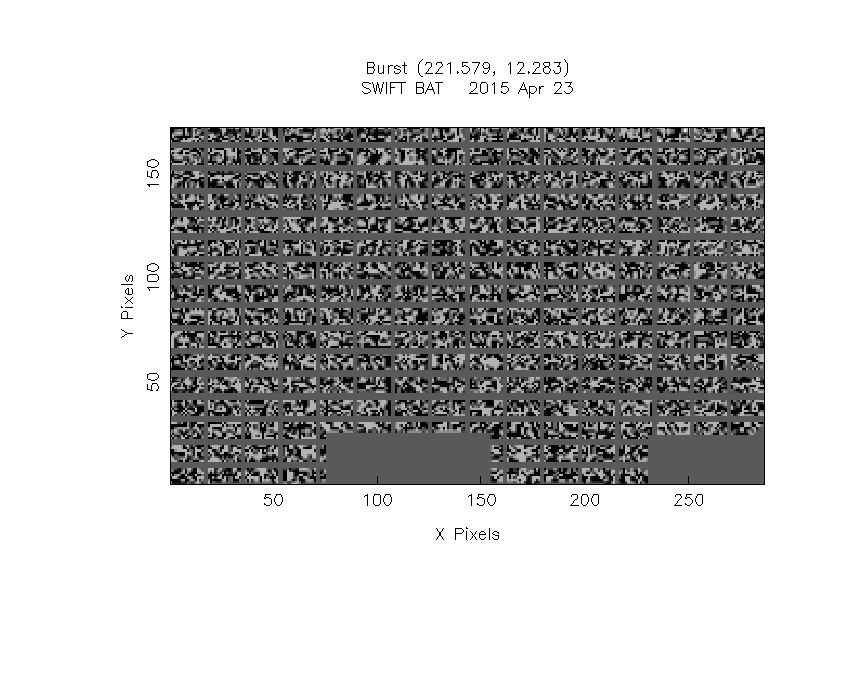
IMX = 1.171942592691804E-01, IMY = -1.849037376510331E-01
TIME vs. PHA plot around the trigger time
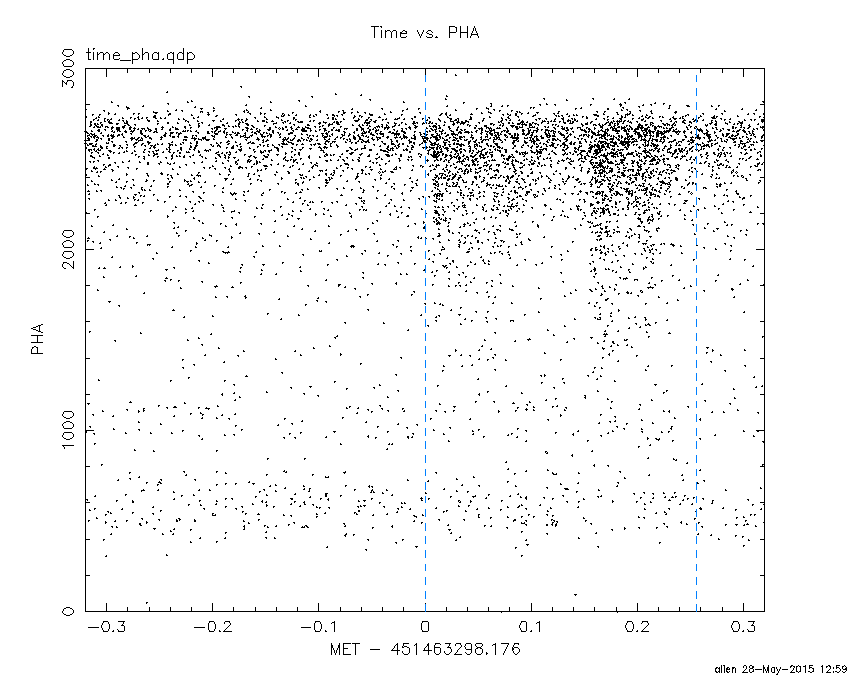
Blue+Cyan dotted lines: Time interval of the scaled map
From 0.000000 to 0.256000
TIME vs. DetID plot around the trigger time

Blue+Cyan dotted lines: Time interval of the scaled map
From 0.000000 to 0.256000
100 us light curve (15-350 keV)
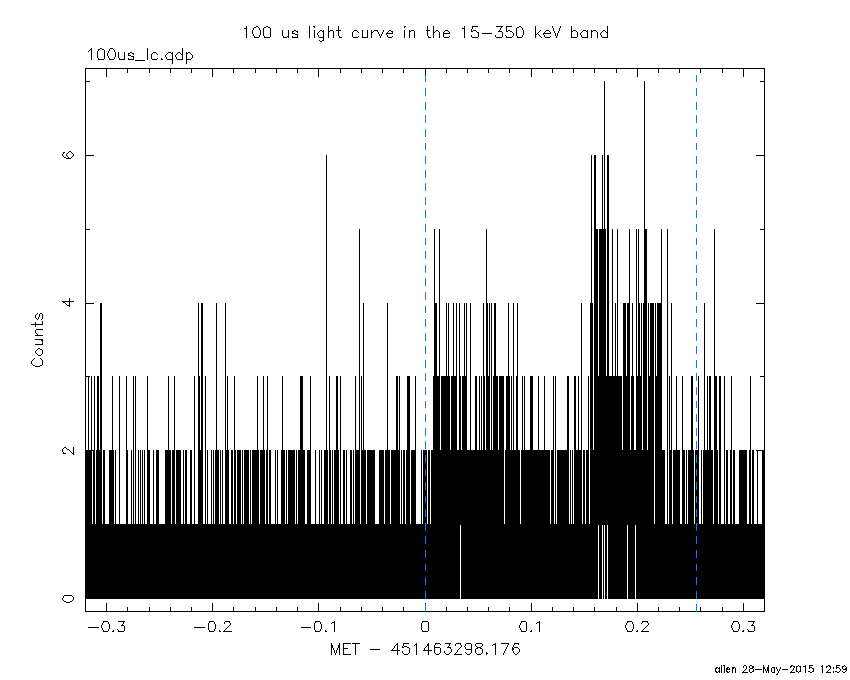
Blue+Cyan dotted lines: Time interval of the scaled map
From 0.000000 to 0.256000
Spacecraft aspect plot

Bright source in the pre-burst/pre-slew/post-slew images
Pre-burst image of 15-350 keV band
Time interval of the image:
-719.875400 -701.654600
-239.176000 0.008000

# RAcent  DECcent POSerr Theta    Phi  PeakCts   SNR AngSep     Name
#  [deg]    [deg]    ['] [deg]  [deg]                   [']
244.9889 -15.6436    0.7  48.1   42.4  21.2257  17.6    0.6	Sco X-1
254.4563  35.3531    2.1  34.5  -38.3   1.5503   5.6    0.6	Her X-1
268.3655  -1.3632   20.6  56.0    9.2   0.8411   0.6    5.4	SW J1753.5-0127
212.6308 -15.9443    2.3  39.9   86.4   4.5923   4.9 ------	UNKNOWN
261.5879   6.4322    3.6  46.3    4.6   1.3338   3.2 ------	UNKNOWN
182.2648  62.7978    3.5  45.3 -121.3   3.6050   3.3 ------	UNKNOWN
Pre-slew background subtracted image of 15-350 keV band
Time interval of the image:
0.008000 0.240000

# RAcent  DECcent POSerr Theta    Phi  PeakCts   SNR AngSep     Name
#  [deg]    [deg]    ['] [deg]  [deg]                   [']
245.0795 -15.7452    7.8  48.2   42.4   0.0552   1.5    8.5	Sco X-1
254.5050  35.3192    6.4  34.5  -38.3   0.0169   1.8    2.7	Her X-1
268.3034  -1.5242    7.9  56.0    9.4  -0.0622  -1.5    5.8	SW J1753.5-0127
221.6026  12.2660    0.9  12.3   57.6   0.0982  12.5 ------	UNKNOWN
Post-slew image of 15-350 keV band
Time interval of the image:
53.324600 962.894000
1175.824000 1175.824610

# RAcent  DECcent POSerr Theta    Phi  PeakCts   SNR AngSep     Name
#  [deg]    [deg]    ['] [deg]  [deg]                   [']
244.9825 -15.6355    0.2  36.3   25.8  85.4166  59.5    0.3	Sco X-1
254.5056  35.2717    3.9  37.6  -67.4   6.8742   3.0    4.9	Her X-1
263.0989 -24.6605    5.2  54.8   18.5  10.5397   2.2    7.1	GX 1+4
268.3883  -1.4587    8.4  48.4  -10.8   2.4435   1.4    1.3	SW J1753.5-0127
176.2982  -2.2629    3.0  47.3  141.2  16.0521   3.9 ------	UNKNOWN
211.6359   3.1281    3.9  13.5  113.9   2.6546   2.9 ------	UNKNOWN
266.3160 -13.9879    2.7  51.5    5.3  10.0851   4.2 ------	UNKNOWN
247.4510  -3.7503    3.5  30.3    6.4   3.5632   3.2 ------	UNKNOWN
182.9670  44.2612    3.6  46.0 -152.5   5.5477   3.2 ------	UNKNOWN
180.5611  54.7816    3.1  53.2 -142.2  19.4796   3.7 ------	UNKNOWN
218.8524  56.1614    4.5  43.9 -116.2  10.5316   2.6 ------	UNKNOWN
Plot creation:
Thu May 28 12:59:12 EDT 2015