Special notes of this burst
Image
Pre-slew 15.0-350.0 keV image (Event data)
#   RAcent    DECcent   POSerr    Theta     Phi              Peak Cts       SNR   Name
  152.3052   -26.6474   0.0054    34.0680  -175.1568         1.7368904     35.592 TRIG_00638946

Foreground time interval of the image:
 -0.060   9.137 (delta_t =   9.197 [sec])
Background time interval of the image:
-239.564  -0.060 (delta_t = 239.504 [sec])
Lightcurves
Notes:
- 1) The mask-weighted light curves are using the flight position.
- 2) Multiple plots of different time binning/intervals are shown to cover all scenarios of short/long GRBs, rate/image triggers, and real/false positives.
- 3) For all the mask-weighted lightcurves, the y-axis units are counts/sec/det where a det is 0.4 x 0.4 = 0.16 sq cm.
- 4) The verticle lines correspond to following: green dotted lines are T50 interval, black dotted lines are T90 interval, blue solid line(s) is a spacecraft slew start time, and orange solid line(s) is a spacecraft slew end time.
- 5) Time of each bin is in the middle of the bin.
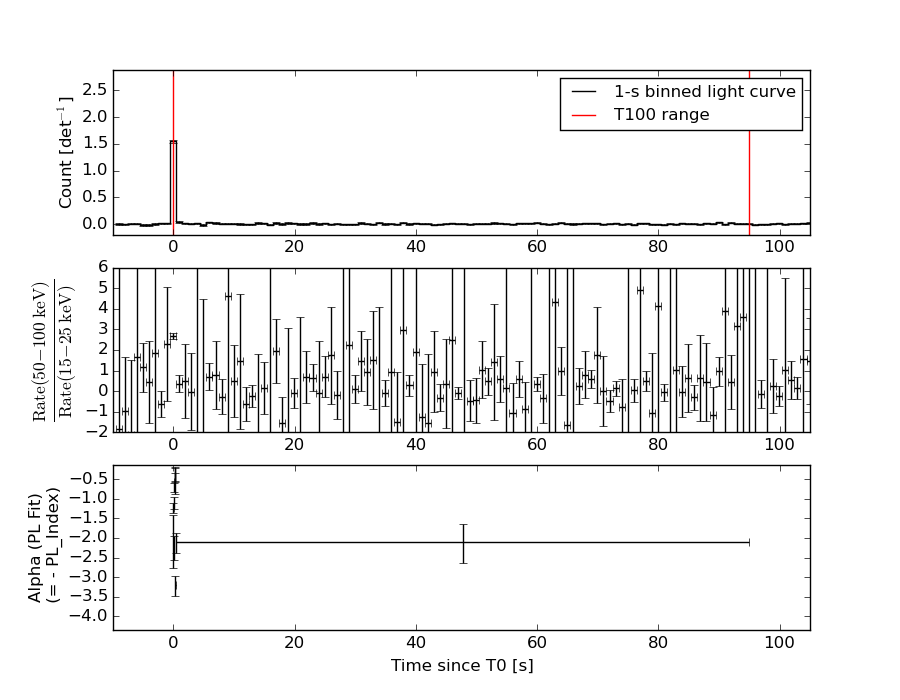
1 s binning
From T0-310 s to T0+310 s
From T100_start - 20 s to T100_end + 30 s

Full time interval

64 ms binning
Full time interval
From T100_start to T100_end

From T0-5 sec to T0+5 sec

16 ms binning
From T100_start-5 s to T100_start+5 s

Blue+Cyan dotted lines: Time interval of the scaled map
From 0.000000 to 0.064000
8 ms binning
From T100_start-3 s to T100_start+3 s

Blue+Cyan dotted lines: Time interval of the scaled map
From 0.000000 to 0.064000
2 ms binning
From T100_start-1 s to T100_start+1 s

Blue+Cyan dotted lines: Time interval of the scaled map
From 0.000000 to 0.064000
SN=5 or 10 sec. binning (whichever binning is satisfied first)
SN=5 or 10 sec. binning (T < 200 sec)
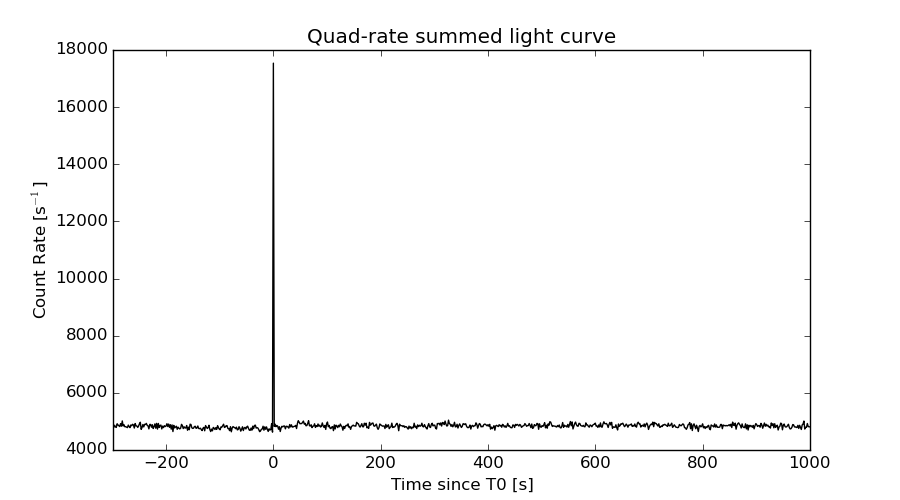
Quad-rate summed light curves (from T0-300s to T0+1000s)
Spectral Evolution
Spectra
Notes:
- 1) The fitting includes the systematic errors.
- 2) When the burst includes telescope slew time periods, the fitting uses an average response file made from multiple 5-s response files through out the slew time plus single time preiod for the non-slew times, and weighted by the total counts in the corresponding time period using addrmf. An average response file is needed becuase a spectral fit using the pre-slew DRM will introduce some errors in both a spectral shape and a normalization if the PHA file contains a lot of the slew/post-slew time interval.
- 3) For fits to more complicated models (e.g. a power-law over a cutoff power-law), the BAT team has decided to require a chi-square improvement of more than 6 for each extra dof.
Time averaged spectrum fit using the average DRM
Power-law model
Time interval is from   -0.060 sec. to   95.012 sec.

Spectral model in power-law:
------------------------------------------------------------
Parameters  : value       lower 90%   higher 90%
Photon index: 1.17156     ( -0.152602   0.149173 )
Norm@50keV  : 1.53899E-03    ( -0.000126803   0.000126385 )
------------------------------------------------------------
#Fit statistic : Chi-Squared =          61.85 using 59 PHA bins.
# Reduced chi-squared =          1.085 for     57 degrees of freedom
# Null hypothesis probability =   3.070241e-01

Photon flux (15-150 keV)    in 95.07 sec: 0.179957 ( -0.0155706  0.0156588 ) ph/cm2/s
Energy fluence (15-150 keV)             : 1.4966e-06 ( -1.31579e-07  1.32055e-07 ) ergs/cm2
Cutoff power-law model

Time interval is from   -0.060 sec. to   95.012 sec.
Spectral model in the cutoff power-law:
------------------------------------------------------------
Parameters  : value       lower 90%   higher 90%
Photon index: 1.16699     ( -0.334285   0.202061 )
Epeak [keV] : 1.00000E+04      (   )
Norm@50keV  : 1.54658E-03    ( -0.000126215   0.000125975 )
------------------------------------------------------------
#Fit statistic : Chi-Squared =          61.88 using 59 PHA bins.
# Reduced chi-squared =          1.105 for     56 degrees of freedom
# Null hypothesis probability =   2.743960e-01

Photon flux (15-150 keV)    in 95.07 sec: 0.180035 ( -0.015655  0.015494 ) ph/cm2/s
Energy fluence (15-150 keV)             : 1.49299e-06 ( -1.27926e-07  1.36197e-07 ) ergs/cm2
Band function

Time interval is from   -0.060 sec. to   95.012 sec.

Spectral model in the Band function:
------------------------------------------------------------
Parameters  : value       lower 90%   higher 90%
alpha       : 4.81278   ( -4.81278   -4.81278 )
beta        : -1.18901    ( -0.158639   0.158067 )
Epeak [keV] : 21.4694      ( -21.4694 8.47686 )
Norm@50keV   : 213.646    ( -17.4072   406961 )
------------------------------------------------------------
#Fit statistic : Chi-Squared =          61.68 using 59 PHA bins.
# Reduced chi-squared =          1.121 for     55 degrees of freedom
# Null hypothesis probability =   2.496669e-01

Photon flux (15-150 keV)    in 95.07 sec:  (    ) ph/cm2/s
Energy fluence (15-150 keV)             : 0 ( 0  0 ) ergs/cm2
Single BB

Spectral model blackbody:
------------------------------------------------------------
Parameters  : value    Lower 90%  Upper 90%
kT [keV]    : 21.0963  (-2.48908  2.96997)
R^2/D10^2   : 6.81423E-03  (-0.00236151   0.00348094)
(R is the radius in km and D10 is the distance to the source in units of 10 kpc)
------------------------------------------------------------
#Fit statistic : Chi-Squared =         104.24 using 59 PHA bins.
# Reduced chi-squared =         1.8288 for     57 degrees of freedom
# Null hypothesis probability =   1.356462e-04

Energy  Fluence     90% Error
[keV]   [erg/cm2]   [erg/cm2]
15- 25  5.436e-08   9.935e-09
25- 50  2.802e-07   3.950e-08
50-150  9.299e-07   1.300e-07
15-150  1.265e-06   1.340e-07
Thermal bremsstrahlung (OTTB)

Spectral model: thermal bremsstrahlung
------------------------------------------------------------
Parameters  : value         Lower 90%    Upper 90%
kT [keV]    : 200.000       (      )
Norm        : 0.756977       (-0.0633426     0.0633315)
------------------------------------------------------------
#Fit statistic : Chi-Squared =          82.50 using 59 PHA bins.
# Reduced chi-squared =          1.447 for     57 degrees of freedom
# Null hypothesis probability =   1.524951e-02

Energy  Fluence     90% Error
[keV]   [erg/cm2]   [erg/cm2]
15- 25  1.793e-07   1.901e-08
25- 50  3.448e-07   6.417e-08
50-150  7.563e-07   3.164e-07
15-150  1.280e-06   3.628e-07
Double BB

Spectral model: bbodyrad<1> + bbodyrad<2>
------------------------------------------------------------
Parameters  : value         Lower 90%    Upper 90%
kT1 [keV]   : 7.33219        (-1.69354      2.3453)
R1^2/D10^2  : 0.145880        (-0.0873579      0.228997)
kT2 [keV]   : 36.8598        (-8.45652      20.6537)
R2^2/D10^2  : 1.03556E-03    (-0.000725845   0.0012931)
------------------------------------------------------------
#Fit statistic : Chi-Squared =          60.96 using 59 PHA bins.
# Reduced chi-squared =          1.108 for     55 degrees of freedom
# Null hypothesis probability =   2.702203e-01

Energy  Fluence     90% Error
[keV]   [erg/cm2]   [erg/cm2]
15- 25  1.437e-07   5.645e-08
25- 50  3.091e-07   1.024e-07
50-150  1.083e-06   3.962e-07
15-150  1.536e-06   5.450e-07
Peak spectrum fit
Power-law model

Time interval is from   -0.072 sec. to    0.928 sec.

Spectral model in power-law:
------------------------------------------------------------
Parameters  : value       lower 90%   higher 90%
Photon index: 0.802818     ( -0.062327   0.0617769 )
Norm@50keV  : 0.104953    ( -0.00368044   0.00366314 )
------------------------------------------------------------
#Fit statistic : Chi-Squared =          49.54 using 59 PHA bins.
# Reduced chi-squared =         0.8691 for     57 degrees of freedom
# Null hypothesis probability =   7.481738e-01

Photon flux (15-150 keV)    in 1 sec: 12.0612 ( -0.414943  0.41531 ) ph/cm2/s
Energy fluence (15-150 keV)             : 1.22501e-06 ( -4.55728e-08  4.56843e-08 ) ergs/cm2
Cutoff power-law model

Time interval is from   -0.072 sec. to    0.928 sec.
Spectral model in the cutoff power-law:
------------------------------------------------------------
Parameters  : value       lower 90%   higher 90%
Photon index: 0.795134     ( -0.0626146   0.0624962 )
Epeak [keV] : 9999.06      ( -9999 -9999 )
Norm@50keV  : 0.105708    ( -0.00364058   0.0296961 )
------------------------------------------------------------
#Fit statistic : Chi-Squared =          49.53 using 59 PHA bins.
# Reduced chi-squared =         0.8844 for     56 degrees of freedom
# Null hypothesis probability =   7.167891e-01

Photon flux (15-150 keV)    in 1 sec: 12.0579 ( -0.4322  0.3237 ) ph/cm2/s
Energy fluence (15-150 keV)             : 1.22787e-06 ( 0  0 ) ergs/cm2
Band function

Time interval is from   -0.072 sec. to    0.928 sec.

Spectral model in the Band function:
------------------------------------------------------------
Parameters  : value       lower 90%   higher 90%
alpha       : -0.909223   ( 0.909223   0.909223 )
beta        : -0.802818    ( -0.0617624   0.0623528 )
Epeak [keV] : 13.5927      ( -13.5927 -13.5927 )
Norm@50keV   : 0.155662    ( -0.0492149   1.42956e+06 )
------------------------------------------------------------
#Fit statistic : Chi-Squared =          49.54 using 59 PHA bins.
# Reduced chi-squared =         0.9007 for     55 degrees of freedom
# Null hypothesis probability =   6.825869e-01

Photon flux (15-150 keV)    in 1 sec:  (    ) ph/cm2/s
Energy fluence (15-150 keV)             : 0 ( 0  0 ) ergs/cm2
Single BB

Spectral model blackbody:
------------------------------------------------------------
Parameters  : value    Lower 90%  Upper 90%
kT [keV]    : 25.7422  (  )
R^2/D10^2   : 0.281508  (   )
(R is the radius in km and D10 is the distance to the source in units of 10 kpc)
------------------------------------------------------------
#Fit statistic : Chi-Squared =         174.72 using 59 PHA bins.
# Reduced chi-squared =         3.0653 for     57 degrees of freedom
# Null hypothesis probability =   7.055066e-14

Energy  Fluence     90% Error
[keV]   [erg/cm2]   [erg/cm2]
15- 25  3.190e-08   2.190e-09
25- 50  1.837e-07   9.400e-09
50-150  8.982e-07   4.365e-08
15-150  1.114e-06   4.900e-08
Thermal bremsstrahlung (OTTB)

Spectral model: thermal bremsstrahlung
------------------------------------------------------------
Parameters  : value         Lower 90%    Upper 90%
kT [keV]    : 199.363       (      )
Norm        : 46.6713       (     )
------------------------------------------------------------
#Fit statistic : Chi-Squared =         429.46 using 59 PHA bins.
# Reduced chi-squared =         7.5343 for     57 degrees of freedom
# Null hypothesis probability =   1.486360e-58

Energy  Fluence     90% Error
[keV]   [erg/cm2]   [erg/cm2]
15- 25  1.162e-07   4.150e-09
25- 50  2.236e-07   8.800e-09
50-150  4.903e-07   1.790e-08
15-150  8.301e-07   3.260e-08
Double BB

Spectral model: bbodyrad<1> + bbodyrad<2>
------------------------------------------------------------
Parameters  : value         Lower 90%    Upper 90%
kT1 [keV]   : 9.63718        (-2.17274      2.69622)
R1^2/D10^2  : 2.67055        (-1.21473      2.93688)
kT2 [keV]   : 43.3965        (-7.73782      18.3739)
R2^2/D10^2  : 5.42902E-02    (-0.0327122   0.0426703)
------------------------------------------------------------
#Fit statistic : Chi-Squared =          58.45 using 59 PHA bins.
# Reduced chi-squared =          1.063 for     55 degrees of freedom
# Null hypothesis probability =   3.498279e-01

Energy  Fluence     90% Error
[keV]   [erg/cm2]   [erg/cm2]
15- 25  6.226e-08   8.030e-09
25- 50  2.042e-07   2.355e-08
50-150  9.681e-07   1.276e-07
15-150  1.235e-06   1.497e-07
Pre-slew spectrum (Pre-slew PHA with pre-slew DRM)
Power-law model
Spectral model in power-law:
------------------------------------------------------------
Parameters  : value       lower 90%   higher 90%
Photon index: 0.866269     ( -0.0915471   0.0896495 )
Norm@50keV  : 1.20181E-02    ( -0.000616037   0.000611315 )
------------------------------------------------------------
#Fit statistic : Chi-Squared =          47.17 using 59 PHA bins.
# Reduced chi-squared =         0.8275 for     57 degrees of freedom
# Null hypothesis probability =   8.202317e-01

Photon flux (15-150 keV)    in 9.197 sec: 1.37935 ( -0.0699434  0.0702664 ) ph/cm2/s
Energy fluence (15-150 keV)             : 1.25705e-06 ( -6.29685e-08  6.31265e-08 ) ergs/cm2
Cutoff power-law model

Spectral model in the cutoff power-law:
------------------------------------------------------------
Parameters  : value       lower 90%   higher 90%
Photon index: 0.862868     ( -0.0954697   0.0873644 )
Epeak [keV] : 9999.36      ( -9999.36 -9999.36 )
Norm@50keV  : 1.20971E-02    ( -0.000624323   0.00262173 )
------------------------------------------------------------
#Fit statistic : Chi-Squared =          47.23 using 59 PHA bins.
# Reduced chi-squared =         0.8435 for     56 degrees of freedom
# Null hypothesis probability =   7.915924e-01

Photon flux (15-150 keV)    in 9.197 sec: 1.37979 ( -0.0709  0.06936 ) ph/cm2/s
Energy fluence (15-150 keV)             : 1.2567e-06 ( -6.21441e-08  6.29259e-08 ) ergs/cm2
Band function

Spectral model in the Band function:
------------------------------------------------------------
Parameters  : value       lower 90%   higher 90%
alpha       : -0.808287   ( 0.808224   0.808224 )
beta        : -0.866269    ( -0.0896134   0.0916247 )
Epeak [keV] : 14.1862      ( -14.1869 -14.1869 )
Norm@50keV   : 1.81569E-02    ( -0.00673019   0 )
------------------------------------------------------------
#Fit statistic : Chi-Squared =          47.17 using 59 PHA bins.
# Reduced chi-squared =         0.8576 for     55 degrees of freedom
# Null hypothesis probability =   7.645111e-01

Photon flux (15-150 keV)    in 9.197 sec:  (    ) ph/cm2/s
Energy fluence (15-150 keV)             : 0 ( 0  0 ) ergs/cm2
S(25-50 keV) vs. S(50-100 keV) plot

S(25-50 keV)  = 3.09e-07
S(50-100 keV) = 5.49e-07
T90 vs. Hardness ratio plot

T90                                   = 81.055999994278 sec.
Hardness ratio (energy fluence ratio) = 1.7767
Color vs. Color plot

Count Ratio  (25-50 keV) / (15-25 keV) = 1.58833
Count Ratio (50-100 keV) / (15-25 keV) = 1.76558
Mask shadow pattern
IMX = -6.738218905893313E-01, IMY = 5.709394877316486E-02
TIME vs. PHA plot around the trigger time

Blue+Cyan dotted lines: Time interval of the scaled map
From 0.000000 to 0.064000
TIME vs. DetID plot around the trigger time

Blue+Cyan dotted lines: Time interval of the scaled map
From 0.000000 to 0.064000
100 us light curve (15-350 keV)
Blue+Cyan dotted lines: Time interval of the scaled map
From 0.000000 to 0.064000
Spacecraft aspect plot

Bright source in the pre-burst/pre-slew/post-slew images
Pre-burst image of 15-350 keV band
Time interval of the image:
-239.564000 -0.060000

# RAcent  DECcent POSerr Theta    Phi  PeakCts   SNR AngSep     Name
#  [deg]    [deg]    ['] [deg]  [deg]                   [']
135.5888 -40.6384    5.1  53.7 -175.0   1.4619   2.3    5.7	Vela X-1
201.3187 -30.4920    3.9  41.0  111.8   2.4750   2.9 ------	UNKNOWN
121.7342 -32.1863    3.5  58.8 -159.3   4.8241   3.3 ------	UNKNOWN
189.6613  58.5217    2.3  59.2  -20.4   6.2319   4.9 ------	UNKNOWN
130.4924 -16.6153    2.6  45.7 -144.5   1.8881   4.4 ------	UNKNOWN
147.0256  31.9921    3.1  40.0  -66.1   2.1285   3.7 ------	UNKNOWN
129.5737   3.0681    2.7  43.8 -116.5   3.5777   4.3 ------	UNKNOWN
Pre-slew background subtracted image of 15-350 keV band
Time interval of the image:
-0.060000 9.136600

# RAcent  DECcent POSerr Theta    Phi  PeakCts   SNR AngSep     Name
#  [deg]    [deg]    ['] [deg]  [deg]                   [']
135.4894 -40.4525    8.2  53.7 -174.7   0.1706   1.4    6.4	Vela X-1
152.3052 -26.6474    0.3  34.1 -175.2   1.7369  35.6 ------	UNKNOWN
131.1279 -37.3112    2.4  54.5 -169.1   0.6473   4.9 ------	UNKNOWN
176.6153  52.2707    2.0  51.6  -27.7   0.6781   5.9 ------	UNKNOWN
Post-slew image of 15-350 keV band
Time interval of the image:
75.536620 962.566000

# RAcent  DECcent POSerr Theta    Phi  PeakCts   SNR AngSep     Name
#  [deg]    [deg]    ['] [deg]  [deg]                   [']
135.5272 -40.5526    1.7  19.7 -137.4   3.9709   6.8    0.1	Vela X-1
170.3862 -60.6351    4.4  36.2  167.0   2.2742   2.6    2.2	Cen X-3
186.6944 -62.7769    0.8  42.6  159.5  17.8632  13.7    1.1	GX 301-2
175.5856  19.0359    3.9  50.9   30.7   8.4977   3.0 ------	UNKNOWN
161.1524 -44.2019    2.8  19.0  162.1   2.2895   4.2 ------	UNKNOWN
101.4962 -38.0470    3.9  43.9 -116.3   7.7909   3.0 ------	UNKNOWN
Plot creation:
Thu May 28 12:57:41 EDT 2015