Click here for the BAT GCN circular template
Image
Pre-slew 15.0-350.0 keV image (Event data)
#   RAcent    DECcent   POSerr    Theta     Phi              Peak Cts       SNR   Name
  188.5387     6.9667   0.0078    43.7027    36.7805         9.4345585     24.708 TRIG_00639275

Foreground time interval of the image:
-38.984  38.600 (delta_t =  77.584 [sec])
Background time interval of the image:
-239.336 -38.984 (delta_t = 200.352 [sec])
Lightcurves
Notes:
- 1) The mask-weighted light curves are using the flight position.
- 2) Multiple plots of different time binning/intervals are shown to cover all scenarios of short/long GRBs, rate/image triggers, and real/false positives.
- 3) For all the mask-weighted lightcurves, the y-axis units are counts/sec/det where a det is 0.4 x 0.4 = 0.16 sq cm.
- 4) The verticle lines correspond to following: green dotted lines are T50 interval, black dotted lines are T90 interval, blue solid line(s) is a spacecraft slew start time, and orange solid line(s) is a spacecraft slew end time.
- 5) Time of each bin is in the middle of the bin.
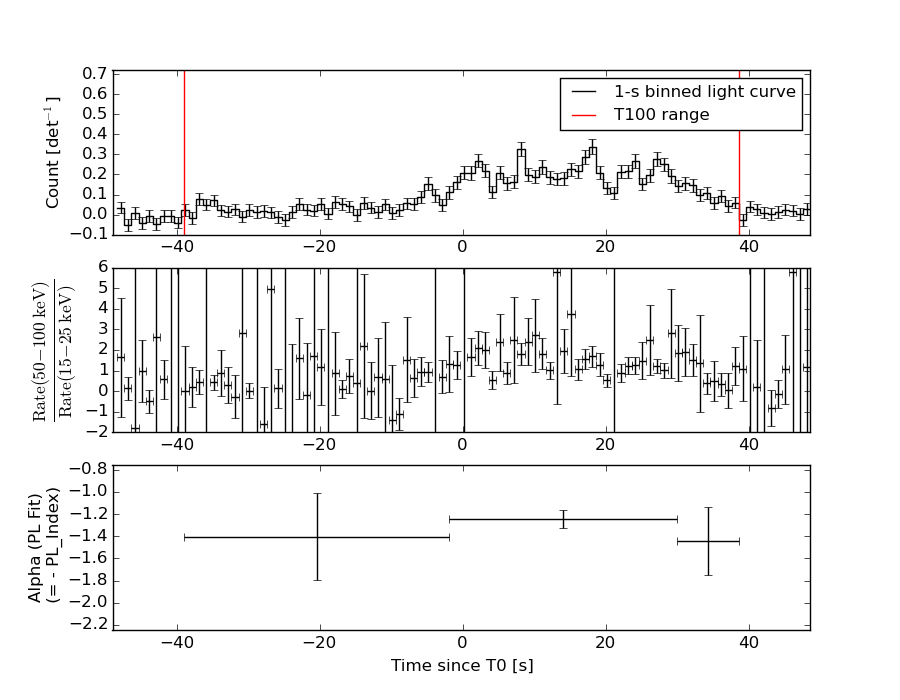
1 s binning
From T0-310 s to T0+310 s
From T100_start - 20 s to T100_end + 30 s
Full time interval
64 ms binning
Full time interval
From T100_start to T100_end
From T0-5 sec to T0+5 sec
16 ms binning
From T100_start-5 s to T100_start+5 s
Blue+Cyan dotted lines: Time interval of the scaled map
From 0.000000 to 12.160000
8 ms binning
From T100_start-3 s to T100_start+3 s
Blue+Cyan dotted lines: Time interval of the scaled map
From 0.000000 to 12.160000
2 ms binning
From T100_start-1 s to T100_start+1 s
Blue+Cyan dotted lines: Time interval of the scaled map
From 0.000000 to 12.160000
SN=5 or 10 sec. binning (whichever binning is satisfied first)
SN=5 or 10 sec. binning (T < 200 sec)
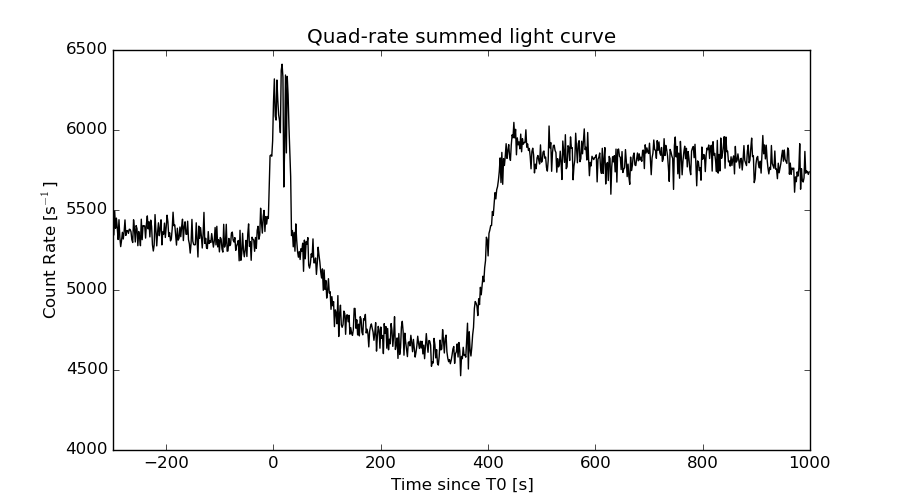
Quad-rate summed light curves (from T0-300s to T0+1000s)
Spectral Evolution
Spectra
Notes:
- 1) The fitting includes the systematic errors.
- 2) When the burst includes telescope slew time periods, the fitting uses an average response file made from multiple 5-s response files through out the slew time plus single time preiod for the non-slew times, and weighted by the total counts in the corresponding time period using addrmf. An average response file is needed becuase a spectral fit using the pre-slew DRM will introduce some errors in both a spectral shape and a normalization if the PHA file contains a lot of the slew/post-slew time interval.
- 3) For fits to more complicated models (e.g. a power-law over a cutoff power-law), the BAT team has decided to require a chi-square improvement of more than 6 for each extra dof.
Time averaged spectrum fit using the average DRM
Power-law model

Time interval is from  -38.984 sec. to   38.600 sec.

Spectral model in power-law:
------------------------------------------------------------
Parameters  : value       lower 90%   higher 90%
Photon index: 1.28205     ( -0.092149   0.0913393 )
Norm@50keV  : 8.20483E-03    ( -0.000418841   0.000417965 )
------------------------------------------------------------
#Fit statistic : Chi-Squared =          58.32 using 59 PHA bins.
# Reduced chi-squared =          1.023 for     57 degrees of freedom
# Null hypothesis probability =   4.264261e-01

Photon flux (15-150 keV)    in 77.58 sec: 0.975697 ( -0.0542504  0.0545432 ) ph/cm2/s
Energy fluence (15-150 keV)             : 6.31808e-06 ( -3.32859e-07  3.33482e-07 ) ergs/cm2
Cutoff power-law model
Time interval is from  -38.984 sec. to   38.600 sec.
Spectral model in the cutoff power-law:
------------------------------------------------------------
Parameters  : value       lower 90%   higher 90%
Photon index: 1.20911     ( -0.364743   0.099553 )
Epeak [keV] : 588.105      ( -996.195 -996.195 )
Norm@50keV  : 8.83148E-03    ( -0.000708066   0.00361354 )
------------------------------------------------------------
#Fit statistic : Chi-Squared =          58.36 using 59 PHA bins.
# Reduced chi-squared =          1.042 for     56 degrees of freedom
# Null hypothesis probability =   3.887577e-01

Photon flux (15-150 keV)    in 77.58 sec: 0.968785 ( -0.051552  0.062595 ) ph/cm2/s
Energy fluence (15-150 keV)             : 6.30596e-06 ( -3.40398e-07  3.34517e-07 ) ergs/cm2
Band function

Time interval is from  -38.984 sec. to   38.600 sec.

Spectral model in the Band function:
------------------------------------------------------------
Parameters  : value       lower 90%   higher 90%
alpha       : -9.02020   ( 9.0202   9.0202 )
beta        : -1.28205    ( -0.0913381   0.0921493 )
Epeak [keV] : 81.9473      ( -81.9473 -81.9473 )
Norm@50keV   : 1.11515    ( -0.0569266   0.0568073 )
------------------------------------------------------------
#Fit statistic : Chi-Squared =          58.32 using 59 PHA bins.
# Reduced chi-squared =          1.060 for     55 degrees of freedom
# Null hypothesis probability =   3.541573e-01

Photon flux (15-150 keV)    in 77.58 sec:  (    ) ph/cm2/s
Energy fluence (15-150 keV)             : 0 ( 0  0 ) ergs/cm2
Single BB
Spectral model blackbody:
------------------------------------------------------------
Parameters  : value    Lower 90%  Upper 90%
kT [keV]    : 20.1800  (  )
R^2/D10^2   : 4.18556E-02  (   )
(R is the radius in km and D10 is the distance to the source in units of 10 kpc)
------------------------------------------------------------
#Fit statistic : Chi-Squared =         146.17 using 59 PHA bins.
# Reduced chi-squared =         2.5643 for     57 degrees of freedom
# Null hypothesis probability =   9.042348e-10

Energy  Fluence     90% Error
[keV]   [erg/cm2]   [erg/cm2]
15- 25  2.540e-07   2.742e-08
25- 50  1.273e-06   9.697e-08
50-150  3.847e-06   3.006e-07
15-150  5.374e-06   3.286e-07
Thermal bremsstrahlung (OTTB)
Spectral model: thermal bremsstrahlung
------------------------------------------------------------
Parameters  : value         Lower 90%    Upper 90%
kT [keV]    : 200.000       (      )
Norm        : 4.16114       (-0.213018     0.212929)
------------------------------------------------------------
#Fit statistic : Chi-Squared =          89.39 using 59 PHA bins.
# Reduced chi-squared =          1.568 for     57 degrees of freedom
# Null hypothesis probability =   3.950329e-03

Energy  Fluence     90% Error
[keV]   [erg/cm2]   [erg/cm2]
15- 25  8.037e-07   4.659e-08
25- 50  1.546e-06   9.038e-08
50-150  3.391e-06   1.978e-07
15-150  5.741e-06   3.472e-07
Double BB
Spectral model: bbodyrad<1> + bbodyrad<2>
------------------------------------------------------------
Parameters  : value         Lower 90%    Upper 90%
kT1 [keV]   : 7.71292        (-1.44925      1.6944)
R1^2/D10^2  : 0.636175        (-0.2998      0.681637)
kT2 [keV]   : 32.2912        (-4.85926      8.13242)
R2^2/D10^2  : 7.51044E-03    (-0.00385387   0.00560375)
------------------------------------------------------------
#Fit statistic : Chi-Squared =          60.67 using 59 PHA bins.
# Reduced chi-squared =          1.103 for     55 degrees of freedom
# Null hypothesis probability =   2.789045e-01

Energy  Fluence     90% Error
[keV]   [erg/cm2]   [erg/cm2]
15- 25  6.067e-07   1.488e-07
25- 50  1.423e-06   2.242e-07
50-150  4.306e-06   7.075e-07
15-150  6.335e-06   9.841e-07
Peak spectrum fit
Power-law model
Time interval is from   17.388 sec. to   18.388 sec.

Spectral model in power-law:
------------------------------------------------------------
Parameters  : value       lower 90%   higher 90%
Photon index: 1.39009     ( -0.275052   0.27504 )
Norm@50keV  : 2.46418E-02    ( -0.00400574   0.00399476 )
------------------------------------------------------------
#Fit statistic : Chi-Squared =          74.59 using 59 PHA bins.
# Reduced chi-squared =          1.309 for     57 degrees of freedom
# Null hypothesis probability =   5.890228e-02

Photon flux (15-150 keV)    in 1 sec: 2.99423 ( -0.504629  0.506315 ) ph/cm2/s
Energy fluence (15-150 keV)             : 2.38592e-07 ( -4.17373e-08  4.20059e-08 ) ergs/cm2
Cutoff power-law model
Time interval is from   17.388 sec. to   18.388 sec.
Spectral model in the cutoff power-law:
------------------------------------------------------------
Parameters  : value       lower 90%   higher 90%
Photon index: 1.13370     ( -1.29189   1.55709 )
Epeak [keV] : 180.838      ( -180.838 -180.838 )
Norm@50keV  : 3.27994E-02    ( -0.0119099   0.0988502 )
------------------------------------------------------------
#Fit statistic : Chi-Squared =          74.43 using 59 PHA bins.
# Reduced chi-squared =          1.329 for     56 degrees of freedom
# Null hypothesis probability =   5.031863e-02

Photon flux (15-150 keV)    in 1 sec: 2.96912 ( -0.51619  0.5158 ) ph/cm2/s
Energy fluence (15-150 keV)             : 2.36066e-07 ( -4.4152e-08  4.3358e-08 ) ergs/cm2
Band function
Time interval is from   17.388 sec. to   18.388 sec.

Spectral model in the Band function:
------------------------------------------------------------
Parameters  : value       lower 90%   higher 90%
alpha       : -7.53326E-02   ( 0.528487   0.528487 )
beta        : -1.50988    ( 1.48713   0.352653 )
Epeak [keV] : 50.7888      ( -51.1454 162.419 )
Norm@50keV   : 0.161331    ( -0.171309   2.3705e+06 )
------------------------------------------------------------
#Fit statistic : Chi-Squared =          74.17 using 59 PHA bins.
# Reduced chi-squared =          1.348 for     55 degrees of freedom
# Null hypothesis probability =   4.345190e-02

Photon flux (15-150 keV)    in 1 sec:  (    ) ph/cm2/s
Energy fluence (15-150 keV)             : 0 ( 0  0 ) ergs/cm2
Single BB
Spectral model blackbody:
------------------------------------------------------------
Parameters  : value    Lower 90%  Upper 90%
kT [keV]    : 17.2218  (-3.22341  4.00439)
R^2/D10^2   : 0.220478  (-0.113669   0.229276)
(R is the radius in km and D10 is the distance to the source in units of 10 kpc)
------------------------------------------------------------
#Fit statistic : Chi-Squared =          82.81 using 59 PHA bins.
# Reduced chi-squared =          1.453 for     57 degrees of freedom
# Null hypothesis probability =   1.439861e-02

Energy  Fluence     90% Error
[keV]   [erg/cm2]   [erg/cm2]
15- 25  1.327e-08   4.498e-09
25- 50  5.932e-08   1.751e-08
50-150  1.261e-07   4.209e-08
15-150  1.987e-07   5.065e-08
Thermal bremsstrahlung (OTTB)
Spectral model: thermal bremsstrahlung
------------------------------------------------------------
Parameters  : value         Lower 90%    Upper 90%
kT [keV]    : 200.000       (      )
Norm        : 12.4826       (-2.02929     2.0291)
------------------------------------------------------------
#Fit statistic : Chi-Squared =          75.58 using 59 PHA bins.
# Reduced chi-squared =          1.326 for     57 degrees of freedom
# Null hypothesis probability =   5.037225e-02

Energy  Fluence     90% Error
[keV]   [erg/cm2]   [erg/cm2]
15- 25  3.110e-08   1.783e-08
25- 50  5.981e-08   3.344e-08
50-150  1.312e-07   7.405e-08
15-150  2.221e-07   1.235e-07
Double BB
Spectral model: bbodyrad<1> + bbodyrad<2>
------------------------------------------------------------
Parameters  : value         Lower 90%    Upper 90%
kT1 [keV]   : 7.83467        (-3.80575      6.21414)
R1^2/D10^2  : 1.99039        (-1.59085      18.7082)
kT2 [keV]   : 29.3573        (-10.7077      -29.4251)
R2^2/D10^2  : 2.75440E-02    (-0.0270746   0.0673249)
------------------------------------------------------------
#Fit statistic : Chi-Squared =          74.51 using 59 PHA bins.
# Reduced chi-squared =          1.355 for     55 degrees of freedom
# Null hypothesis probability =   4.104469e-02

Energy  Fluence     90% Error
[keV]   [erg/cm2]   [erg/cm2]
15- 25  2.551e-08   1.517e-08
25- 50  5.969e-08   3.222e-08
50-150  1.502e-07   8.405e-08
15-150  2.354e-07   1.210e-07
Pre-slew spectrum (Pre-slew PHA with pre-slew DRM)
Power-law model

Spectral model in power-law:
------------------------------------------------------------
Parameters  : value       lower 90%   higher 90%
Photon index: 1.28205     ( -0.092149   0.0913393 )
Norm@50keV  : 8.20483E-03    ( -0.000418841   0.000417965 )
------------------------------------------------------------
#Fit statistic : Chi-Squared =          58.32 using 59 PHA bins.
# Reduced chi-squared =          1.023 for     57 degrees of freedom
# Null hypothesis probability =   4.264261e-01

Photon flux (15-150 keV)    in 77.58 sec: 0.975697 ( -0.0542504  0.0545432 ) ph/cm2/s
Energy fluence (15-150 keV)             : 6.31808e-06 ( -3.32859e-07  3.33482e-07 ) ergs/cm2
Cutoff power-law model

Spectral model in the cutoff power-law:
------------------------------------------------------------
Parameters  : value       lower 90%   higher 90%
Photon index: 1.20911     ( -0.364743   0.099553 )
Epeak [keV] : 588.105      ( -996.195 -996.195 )
Norm@50keV  : 8.83148E-03    ( -0.000708066   0.00361354 )
------------------------------------------------------------
#Fit statistic : Chi-Squared =          58.36 using 59 PHA bins.
# Reduced chi-squared =          1.042 for     56 degrees of freedom
# Null hypothesis probability =   3.887577e-01

Photon flux (15-150 keV)    in 77.58 sec: 0.968785 ( -0.051552  0.062595 ) ph/cm2/s
Energy fluence (15-150 keV)             : 6.30596e-06 ( -3.40398e-07  3.34517e-07 ) ergs/cm2
Band function
Spectral model in the Band function:
------------------------------------------------------------
Parameters  : value       lower 90%   higher 90%
alpha       : -9.02020   ( 9.0202   9.0202 )
beta        : -1.28205    ( -0.0913381   0.0921493 )
Epeak [keV] : 81.9473      ( -81.9473 -81.9473 )
Norm@50keV   : 1.11515    ( -0.0569266   0.0568073 )
------------------------------------------------------------
#Fit statistic : Chi-Squared =          58.32 using 59 PHA bins.
# Reduced chi-squared =          1.060 for     55 degrees of freedom
# Null hypothesis probability =   3.541573e-01

Photon flux (15-150 keV)    in 77.58 sec:  (    ) ph/cm2/s
Energy fluence (15-150 keV)             : 0 ( 0  0 ) ergs/cm2
S(25-50 keV) vs. S(50-100 keV) plot
S(25-50 keV)  = 1.39e-06
S(50-100 keV) = 2.29e-06
T90 vs. Hardness ratio plot
T90                                   = 53.2000000476837 sec.
Hardness ratio (energy fluence ratio) = 1.64748
Color vs. Color plot
Count Ratio  (25-50 keV) / (15-25 keV) = 1.62096
Count Ratio (50-100 keV) / (15-25 keV) = 1.56044
Mask shadow pattern
IMX = 7.654619671080761E-01, IMY = -5.722318943621115E-01
TIME vs. PHA plot around the trigger time
Blue+Cyan dotted lines: Time interval of the scaled map
From 0.000000 to 12.160000
TIME vs. DetID plot around the trigger time
Blue+Cyan dotted lines: Time interval of the scaled map
From 0.000000 to 12.160000
100 us light curve (15-350 keV)
Blue+Cyan dotted lines: Time interval of the scaled map
From 0.000000 to 12.160000
Spacecraft aspect plot
Bright source in the pre-burst/pre-slew/post-slew images
Pre-burst image of 15-350 keV band
Time interval of the image:
-239.336000 -38.984000

# RAcent  DECcent POSerr Theta    Phi  PeakCts   SNR AngSep     Name
#  [deg]    [deg]    ['] [deg]  [deg]                   [']
170.1468 -60.5288    6.2  34.1  -91.6   0.7625   1.9    7.5	Cen X-3
186.7093 -62.7743    1.7  30.5 -105.3   1.9229   6.7    1.5	GX 301-2
244.9943 -15.6450    0.6  41.2  132.9  10.7369  17.8    0.9	Sco X-1
255.9938 -37.8416    1.8  41.7  169.8   2.2892   6.6    0.4	4U 1700-377
256.2596 -36.5287    0.0  42.2  167.9   0.5295   1.4   10.6	GX 349+2
262.8717 -24.6174   31.2  51.5  155.1  -0.3978  -0.4   10.7	GX 1+4
264.6097 -44.4384    9.2  46.9 -179.3   0.5245   1.3    5.7	4U 1735-44
262.9243 -33.8219    6.2  48.2  166.3   1.0757   1.9    3.3	GX 354-0
225.0038  -0.4576    3.6  39.1   93.9   2.5379   3.3 ------	UNKNOWN
217.1023  -4.4131    3.1  32.2   84.4   1.6641   3.7 ------	UNKNOWN
251.8589 -24.0150    2.5  42.7  148.5   2.6651   4.6 ------	UNKNOWN
195.2906 -61.6075    1.4  27.9 -112.0   2.2152   8.2 ------	UNKNOWN
146.5616  -6.8437    3.0  59.4  -17.2   4.6050   3.8 ------	UNKNOWN
263.8997 -67.5848    3.5  47.3 -147.5   1.5436   3.3 ------	UNKNOWN
Pre-slew background subtracted image of 15-350 keV band
Time interval of the image:
-38.984000 38.600000

# RAcent  DECcent POSerr Theta    Phi  PeakCts   SNR AngSep     Name
#  [deg]    [deg]    ['] [deg]  [deg]                   [']
170.5266 -60.5082    5.6  34.0  -91.8   0.4839   2.1    9.3	Cen X-3
186.7731 -62.7876    3.4  30.5 -105.4  -0.6218  -3.4    3.4	GX 301-2
245.1103 -15.7148    4.1  41.3  133.0  -1.0909  -2.8    8.8	Sco X-1
255.9347 -37.9109   17.0  41.6  169.9   0.1501   0.7    4.7	4U 1700-377
256.4479 -36.3633    5.9  42.4  167.8   0.4698   2.0    3.6	GX 349+2
263.0566 -24.7817   99.9  51.6  155.4  -0.0763  -0.1    3.4	GX 1+4
264.7874 -44.5201    5.1  47.0 -179.1   0.5817   2.3    4.6	4U 1735-44
263.1824 -33.9047    5.3  48.3  166.5   0.7198   2.2   10.5	GX 354-0
188.5387   6.9667    0.5  43.7   36.8   9.4345  24.7 ------	UNKNOWN
265.3551 -42.2689    2.5  47.8  178.0   1.1897   4.5 ------	UNKNOWN
159.9053 -33.6921    2.2  36.2  -42.7   0.9115   5.3 ------	UNKNOWN
232.5991 -70.9337    2.0  39.8 -135.0   1.1216   5.7 ------	UNKNOWN
253.4774 -76.0311    2.2  47.5 -135.2   2.0511   5.3 ------	UNKNOWN
143.1257 -30.3931    2.8  50.8  -44.4   2.3592   4.2 ------	UNKNOWN
Post-slew image of 15-350 keV band
Time interval of the image:
158.164600 334.964600

# RAcent  DECcent POSerr Theta    Phi  PeakCts   SNR AngSep     Name
#  [deg]    [deg]    ['] [deg]  [deg]                   [']
191.0539  -8.1591    3.3  15.3  132.4   0.5206   3.5 ------	UNKNOWN
185.0416   7.1117    2.1   3.5 -125.6   0.8350   5.5 ------	UNKNOWN
136.2316  -8.6194    3.5  54.5 -144.1   3.7625   3.3 ------	UNKNOWN
153.1990  30.9862    3.0  40.9  -87.6   3.0363   3.8 ------	UNKNOWN
Plot creation:
Thu May 28 12:56:22 EDT 2015