Click here for the BAT GCN circular template
Image
Pre-slew 15.0-350.0 keV image (Event data)
#   RAcent    DECcent   POSerr    Theta     Phi              Peak Cts       SNR   Name
  292.6621     4.1140   0.0093    43.5554  -154.6046         4.1803718     20.810 TRIG_00639278

Foreground time interval of the image:
-40.060  29.477 (delta_t =  69.537 [sec])
Background time interval of the image:
-239.024 -40.060 (delta_t = 198.964 [sec])
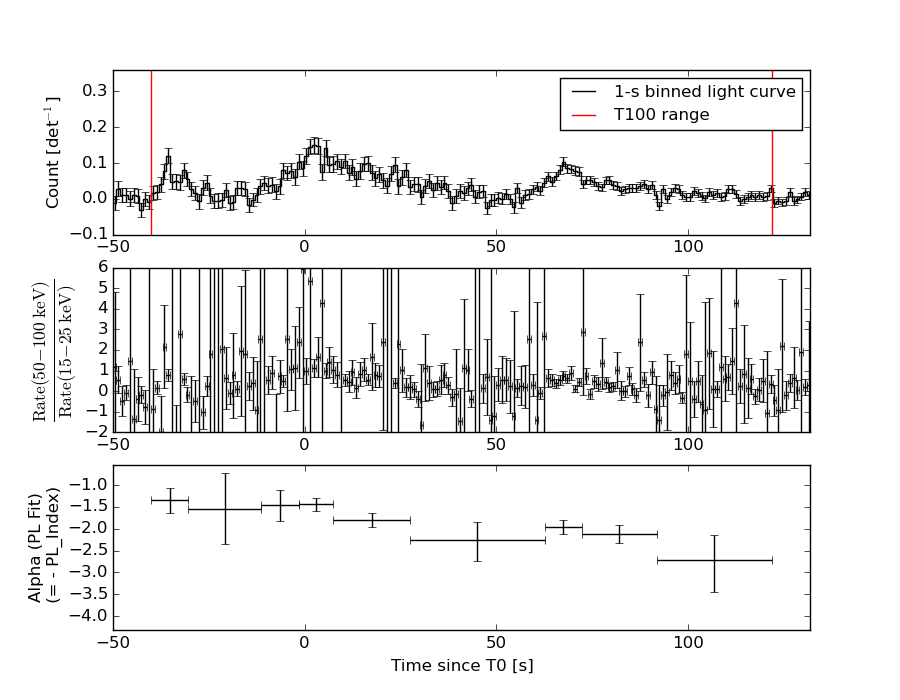
Lightcurves
Notes:
- 1) The mask-weighted light curves are using the flight position.
- 2) Multiple plots of different time binning/intervals are shown to cover all scenarios of short/long GRBs, rate/image triggers, and real/false positives.
- 3) For all the mask-weighted lightcurves, the y-axis units are counts/sec/det where a det is 0.4 x 0.4 = 0.16 sq cm.
- 4) The verticle lines correspond to following: green dotted lines are T50 interval, black dotted lines are T90 interval, blue solid line(s) is a spacecraft slew start time, and orange solid line(s) is a spacecraft slew end time.
- 5) Time of each bin is in the middle of the bin.
1 s binning
From T0-310 s to T0+310 s
From T100_start - 20 s to T100_end + 30 s

Full time interval

64 ms binning
Full time interval
From T100_start to T100_end
From T0-5 sec to T0+5 sec

16 ms binning
From T100_start-5 s to T100_start+5 s

Blue+Cyan dotted lines: Time interval of the scaled map
From 0.000000 to 2.048000
8 ms binning
From T100_start-3 s to T100_start+3 s
Blue+Cyan dotted lines: Time interval of the scaled map
From 0.000000 to 2.048000
2 ms binning
From T100_start-1 s to T100_start+1 s
Blue+Cyan dotted lines: Time interval of the scaled map
From 0.000000 to 2.048000
SN=5 or 10 sec. binning (whichever binning is satisfied first)

SN=5 or 10 sec. binning (T < 200 sec)
Quad-rate summed light curves (from T0-300s to T0+1000s)

Spectral Evolution
Spectra
Notes:
- 1) The fitting includes the systematic errors.
- 2) When the burst includes telescope slew time periods, the fitting uses an average response file made from multiple 5-s response files through out the slew time plus single time preiod for the non-slew times, and weighted by the total counts in the corresponding time period using addrmf. An average response file is needed becuase a spectral fit using the pre-slew DRM will introduce some errors in both a spectral shape and a normalization if the PHA file contains a lot of the slew/post-slew time interval.
- 3) For fits to more complicated models (e.g. a power-law over a cutoff power-law), the BAT team has decided to require a chi-square improvement of more than 6 for each extra dof.
Time averaged spectrum fit using the average DRM
Power-law model
Time interval is from  -40.060 sec. to  121.744 sec.

Spectral model in power-law:
------------------------------------------------------------
Parameters  : value       lower 90%   higher 90%
Photon index: 1.80811     ( -0.0981782   0.0992844 )
Norm@50keV  : 2.55804E-03    ( -0.000151299   0.000150608 )
------------------------------------------------------------
#Fit statistic : Chi-Squared =          48.99 using 59 PHA bins.
# Reduced chi-squared =         0.8596 for     57 degrees of freedom
# Null hypothesis probability =   7.657109e-01

Photon flux (15-150 keV)    in 161.8 sec: 0.353606 ( -0.0208688  0.0209264 ) ph/cm2/s
Energy fluence (15-150 keV)             : 3.80926e-06 ( -2.28403e-07  2.29352e-07 ) ergs/cm2
Cutoff power-law model

Time interval is from  -40.060 sec. to  121.744 sec.
Spectral model in the cutoff power-law:
------------------------------------------------------------
Parameters  : value       lower 90%   higher 90%
Photon index: 0.964583     ( -0.4917   0.440443 )
Epeak [keV] : 58.2951      ( -7.75108 15.4471 )
Norm@50keV  : 7.03198E-03    ( -0.00284182   0.00554515 )
------------------------------------------------------------
#Fit statistic : Chi-Squared =          37.31 using 59 PHA bins.
# Reduced chi-squared =         0.6662 for     56 degrees of freedom
# Null hypothesis probability =   9.743002e-01

Photon flux (15-150 keV)    in 161.8 sec: 0.338093 ( -0.022223  0.022271 ) ph/cm2/s
Energy fluence (15-150 keV)             : 3.57138e-06 ( -2.56453e-07  2.5854e-07 ) ergs/cm2
Band function
Time interval is from  -40.060 sec. to  121.744 sec.

Spectral model in the Band function:
------------------------------------------------------------
Parameters  : value       lower 90%   higher 90%
alpha       : -0.830666   ( -0.536089   4.06972 )
beta        : -2.50281    ( 2.49973   0.587594 )
Epeak [keV] : 54.7951      ( -24.7901 16.7074 )
Norm@50keV   : 8.45443E-03    ( -0.00407668   6.99972 )
------------------------------------------------------------
#Fit statistic : Chi-Squared =          36.83 using 59 PHA bins.
# Reduced chi-squared =         0.6696 for     55 degrees of freedom
# Null hypothesis probability =   9.716749e-01

Photon flux (15-150 keV)    in 161.8 sec:  (    ) ph/cm2/s
Energy fluence (15-150 keV)             : 3.59866e-06 ( 0  0 ) ergs/cm2
Single BB

Spectral model blackbody:
------------------------------------------------------------
Parameters  : value    Lower 90%  Upper 90%
kT [keV]    : 12.5955  (-0.805177  0.865282)
R^2/D10^2   : 7.02694E-02  (-0.0157042   0.0200667)
(R is the radius in km and D10 is the distance to the source in units of 10 kpc)
------------------------------------------------------------
#Fit statistic : Chi-Squared =          83.39 using 59 PHA bins.
# Reduced chi-squared =          1.463 for     57 degrees of freedom
# Null hypothesis probability =   1.290542e-02

Energy  Fluence     90% Error
[keV]   [erg/cm2]   [erg/cm2]
15- 25  3.825e-07   3.778e-08
25- 50  1.272e-06   8.009e-08
50-150  1.252e-06   1.452e-07
15-150  2.907e-06   1.845e-07
Thermal bremsstrahlung (OTTB)
Spectral model: thermal bremsstrahlung
------------------------------------------------------------
Parameters  : value         Lower 90%    Upper 90%
kT [keV]    : 104.330       (-20.6783      24.0445)
Norm        : 1.52977       (-0.116868     0.151285)
------------------------------------------------------------
#Fit statistic : Chi-Squared =          38.81 using 59 PHA bins.
# Reduced chi-squared =         0.6809 for     57 degrees of freedom
# Null hypothesis probability =   9.688215e-01

Energy  Fluence     90% Error
[keV]   [erg/cm2]   [erg/cm2]
15- 25  6.469e-07   6.407e-08
25- 50  1.128e-06   7.944e-08
50-150  1.872e-06   5.267e-07
15-150  3.646e-06   5.922e-07
Double BB
Spectral model: bbodyrad<1> + bbodyrad<2>
------------------------------------------------------------
Parameters  : value         Lower 90%    Upper 90%
kT1 [keV]   : 7.07490        (-1.41049      1.55951)
R1^2/D10^2  : 0.373015        (-0.169641      0.402128)
kT2 [keV]   : 21.0032        (-3.72568      7.0338)
R2^2/D10^2  : 7.26795E-03    (-0.00506394   0.00967076)
------------------------------------------------------------
#Fit statistic : Chi-Squared =          36.80 using 59 PHA bins.
# Reduced chi-squared =         0.6690 for     55 degrees of freedom
# Null hypothesis probability =   9.719323e-01

Energy  Fluence     90% Error
[keV]   [erg/cm2]   [erg/cm2]
15- 25  5.886e-07   1.314e-07
25- 50  1.190e-06   2.422e-07
50-150  1.774e-06   6.639e-07
15-150  3.553e-06   8.122e-07
Peak spectrum fit
Power-law model

Time interval is from    1.360 sec. to    2.360 sec.

Spectral model in power-law:
------------------------------------------------------------
Parameters  : value       lower 90%   higher 90%
Photon index: 1.39340     ( -0.321422   0.31433 )
Norm@50keV  : 1.22969E-02    ( -0.00242018   0.00241424 )
------------------------------------------------------------
#Fit statistic : Chi-Squared =          55.76 using 59 PHA bins.
# Reduced chi-squared =         0.9782 for     57 degrees of freedom
# Null hypothesis probability =   5.217965e-01

Photon flux (15-150 keV)    in 1 sec: 1.49537 ( -0.316005  0.320225 ) ph/cm2/s
Energy fluence (15-150 keV)             : 1.18981e-07 ( -2.40395e-08  2.41559e-08 ) ergs/cm2
Cutoff power-law model

Time interval is from    1.360 sec. to    2.360 sec.
Spectral model in the cutoff power-law:
------------------------------------------------------------
Parameters  : value       lower 90%   higher 90%
Photon index: 0.120346     ( -1.83043   1.30392 )
Epeak [keV] : 81.2436      ( -23.8389 2908.12 )
Norm@50keV  : 4.75528E-02    ( -0.0475526   0.281228 )
------------------------------------------------------------
#Fit statistic : Chi-Squared =          52.99 using 59 PHA bins.
# Reduced chi-squared =         0.9463 for     56 degrees of freedom
# Null hypothesis probability =   5.894798e-01

Photon flux (15-150 keV)    in 1 sec: 1.41520 ( -0.31951  0.32823 ) ph/cm2/s
Energy fluence (15-150 keV)             : 1.13148e-07 ( -2.54561e-08  2.5346e-08 ) ergs/cm2
Band function

Time interval is from    1.360 sec. to    2.360 sec.

Spectral model in the Band function:
------------------------------------------------------------
Parameters  : value       lower 90%   higher 90%
alpha       : 4.96934   ( -6.14448   -4.96934 )
beta        : -1.92404    ( -0.833299   0.517967 )
Epeak [keV] : 41.2789      ( -13.6404 9.52085 )
Norm@50keV   : 60.6525    ( -11.5546   435.645 )
------------------------------------------------------------
#Fit statistic : Chi-Squared =          51.65 using 59 PHA bins.
# Reduced chi-squared =         0.9390 for     55 degrees of freedom
# Null hypothesis probability =   6.035148e-01

Photon flux (15-150 keV)    in 1 sec: 1.44283 (    ) ph/cm2/s
Energy fluence (15-150 keV)             : 0 ( 0  0 ) ergs/cm2
Single BB

Spectral model blackbody:
------------------------------------------------------------
Parameters  : value    Lower 90%  Upper 90%
kT [keV]    : 17.2616  (-3.60485  4.85559)
R^2/D10^2   : 0.111201  (-0.0649923   0.144949)
(R is the radius in km and D10 is the distance to the source in units of 10 kpc)
------------------------------------------------------------
#Fit statistic : Chi-Squared =          55.36 using 59 PHA bins.
# Reduced chi-squared =         0.9711 for     57 degrees of freedom
# Null hypothesis probability =   5.370073e-01

Energy  Fluence     90% Error
[keV]   [erg/cm2]   [erg/cm2]
15- 25  6.719e-09   2.841e-09
25- 50  3.009e-08   1.162e-08
50-150  6.432e-08   2.432e-08
15-150  1.011e-07   3.197e-08
Thermal bremsstrahlung (OTTB)

Spectral model: thermal bremsstrahlung
------------------------------------------------------------
Parameters  : value         Lower 90%    Upper 90%
kT [keV]    : 199.357       (-85.6027      -199.362)
Norm        : 6.36298       (-1.24283     1.24637)
------------------------------------------------------------
#Fit statistic : Chi-Squared =          55.44 using 59 PHA bins.
# Reduced chi-squared =         0.9726 for     57 degrees of freedom
# Null hypothesis probability =   5.339047e-01

Energy  Fluence     90% Error
[keV]   [erg/cm2]   [erg/cm2]
15- 25  1.584e-08   9.280e-09
25- 50  3.048e-08   1.719e-08
50-150  6.685e-08   3.841e-08
15-150  1.132e-07   6.485e-08
Double BB

Spectral model: bbodyrad<1> + bbodyrad<2>
------------------------------------------------------------
Parameters  : value         Lower 90%    Upper 90%
kT1 [keV]   : 9.77130        (-3.92563      7.43043)
R1^2/D10^2  : 0.444003        (-0.393374      4.28402)
kT2 [keV]   : 27.4294        (-26.7068      -27.5295)
R2^2/D10^2  : 1.55759E-02    (-0.0153327   0.1028)
------------------------------------------------------------
#Fit statistic : Chi-Squared =          52.19 using 59 PHA bins.
# Reduced chi-squared =         0.9490 for     55 degrees of freedom
# Null hypothesis probability =   5.824938e-01

Energy  Fluence     90% Error
[keV]   [erg/cm2]   [erg/cm2]
15- 25  1.050e-08   6.270e-09
25- 50  3.207e-08   1.771e-08
50-150  7.286e-08   3.879e-08
15-150  1.154e-07   5.820e-08
Pre-slew spectrum (Pre-slew PHA with pre-slew DRM)
Power-law model

Spectral model in power-law:
------------------------------------------------------------
Parameters  : value       lower 90%   higher 90%
Photon index: 1.59092     ( -0.114679   0.114659 )
Norm@50keV  : 4.03633E-03    ( -0.000276188   0.000276053 )
------------------------------------------------------------
#Fit statistic : Chi-Squared =          61.82 using 59 PHA bins.
# Reduced chi-squared =          1.085 for     57 degrees of freedom
# Null hypothesis probability =   3.080922e-01

Photon flux (15-150 keV)    in 69.54 sec: 0.517240 ( -0.038141  0.0383195 ) ph/cm2/s
Energy fluence (15-150 keV)             : 2.62797e-06 ( -1.86789e-07  1.87276e-07 ) ergs/cm2
Cutoff power-law model

Spectral model in the cutoff power-law:
------------------------------------------------------------
Parameters  : value       lower 90%   higher 90%
Photon index: 0.494519     ( -0.62361   0.545587 )
Epeak [keV] : 70.6938      ( -10.0361 21.5459 )
Norm@50keV  : 1.38033E-02    ( -0.00621095   0.0135203 )
------------------------------------------------------------
#Fit statistic : Chi-Squared =          48.61 using 59 PHA bins.
# Reduced chi-squared =         0.8681 for     56 degrees of freedom
# Null hypothesis probability =   7.478180e-01

Photon flux (15-150 keV)    in 69.54 sec: 0.488351 ( -0.040301  0.040536 ) ph/cm2/s
Energy fluence (15-150 keV)             : 2.46196e-06 ( -2.04976e-07  2.05463e-07 ) ergs/cm2
Band function

Spectral model in the Band function:
------------------------------------------------------------
Parameters  : value       lower 90%   higher 90%
alpha       : 0.735068   ( -1.71195   4.01173 )
beta        : -2.00846    ( 2.00441   0.2625 )
Epeak [keV] : 48.0463      ( -11.8217 39.0574 )
Norm@50keV   : 8.04441E-02    ( -0.092379   24.1412 )
------------------------------------------------------------
#Fit statistic : Chi-Squared =          47.75 using 59 PHA bins.
# Reduced chi-squared =         0.8682 for     55 degrees of freedom
# Null hypothesis probability =   7.452882e-01

Photon flux (15-150 keV)    in 69.54 sec:  (    ) ph/cm2/s
Energy fluence (15-150 keV)             : 2.46939e-06 ( 0  0 ) ergs/cm2
S(25-50 keV) vs. S(50-100 keV) plot
S(25-50 keV)  = 1.08e-06
S(50-100 keV) = 1.23e-06
T90 vs. Hardness ratio plot

T90                                   = 130.947999954224 sec.
Hardness ratio (energy fluence ratio) = 1.13889
Color vs. Color plot
Count Ratio  (25-50 keV) / (15-25 keV) = 1.37049
Count Ratio (50-100 keV) / (15-25 keV) = 0.832263
Mask shadow pattern

IMX = -8.589281366023965E-01, IMY = 4.077643457333014E-01
TIME vs. PHA plot around the trigger time
Blue+Cyan dotted lines: Time interval of the scaled map
From 0.000000 to 2.048000
TIME vs. DetID plot around the trigger time

Blue+Cyan dotted lines: Time interval of the scaled map
From 0.000000 to 2.048000
100 us light curve (15-350 keV)

Blue+Cyan dotted lines: Time interval of the scaled map
From 0.000000 to 2.048000
Spacecraft aspect plot

Bright source in the pre-burst/pre-slew/post-slew images
Pre-burst image of 15-350 keV band
Time interval of the image:
-239.024000 -40.060000

# RAcent  DECcent POSerr Theta    Phi  PeakCts   SNR AngSep     Name
#  [deg]    [deg]    ['] [deg]  [deg]                   [']
244.9869 -15.6329    0.3  23.4  107.5  13.0598  40.1    0.6	Sco X-1
255.9917 -37.7952    2.5  10.4   25.0   1.1162   4.6    2.9	4U 1700-377
256.4968 -36.2818    5.1   9.1   30.3   0.5497   2.3    9.0	GX 349+2
262.9154 -24.6565    6.5   6.0  145.9   0.4309   1.8    7.4	GX 1+4
264.7059 -44.4174   21.5  14.0  -16.8   0.1219   0.5    2.5	4U 1735-44
268.4588  -1.5575    3.2  29.0  170.4  -1.0027  -3.6    8.3	SW J1753.5-0127
270.2784 -25.0855    1.9   7.2 -153.4   1.3110   6.0    0.5	GX 5-1
270.3315 -25.8849    3.7   6.6 -148.5   0.6703   3.2    8.7	GRS 1758-258
273.8826 -14.0083    2.9  18.4 -168.1   0.9594   4.0    7.4	GX 17+2
275.8645 -30.3427    4.5   9.5 -104.5   0.6215   2.6    3.5	H1820-303
284.9300 -24.7593    8.0  18.7 -119.7   0.3635   1.4   11.3	HT1900.1-2455
288.7896  10.9902    1.9  47.3 -164.3   3.1375   6.1    2.7	GRS 1915+105
263.1825 -33.8249    2.8   3.7    4.4   0.9484   4.0    9.7	GX 354-0
196.2693 -53.7559    2.6  53.5   26.0   5.6288   4.5 ------	UNKNOWN
227.0527 -33.9812    2.7  32.0   56.3   1.6543   4.3 ------	UNKNOWN
279.0921 -75.9508    3.5  46.1  -21.9   1.3665   3.3 ------	UNKNOWN
299.7600  16.6969    3.9  57.8 -156.7   5.2576   3.0 ------	UNKNOWN
312.7452 -30.9809    2.8  40.9  -93.6   5.2329   4.1 ------	UNKNOWN
Pre-slew background subtracted image of 15-350 keV band
Time interval of the image:
-40.060000 29.476600

# RAcent  DECcent POSerr Theta    Phi  PeakCts   SNR AngSep     Name
#  [deg]    [deg]    ['] [deg]  [deg]                   [']
245.1040 -15.7337    5.3  23.2  107.5   0.3394   2.2    9.1	Sco X-1
256.0048 -37.8718    8.4  10.5   24.7  -0.1612  -1.4    1.9	4U 1700-377
256.2896 -36.5278    3.5   9.4   29.7   0.4045   3.3    9.4	GX 349+2
262.9578 -24.5733    5.8   6.0  146.5  -0.2198  -2.0   10.7	GX 1+4
264.7998 -44.5547   89.1  14.2  -17.1   0.0154   0.1    6.7	4U 1735-44
268.3164  -1.4973    4.4  29.1  170.1   0.3604   2.6    4.1	SW J1753.5-0127
270.1962 -24.9842    6.2   7.2 -154.4  -0.2006  -1.9    7.4	GX 5-1
270.4993 -25.6348    3.3   6.9 -149.1   0.3801   3.6   12.5	GRS 1758-258
273.8981 -13.8554    0.0  18.5 -168.3   0.1365   1.2   12.5	GX 17+2
275.8938 -30.2102    6.8   9.6 -105.3  -0.1947  -1.7    9.5	H1820-303
284.8608 -25.0066    2.5  18.5 -119.1  -0.5629  -4.6   10.8	HT1900.1-2455
288.8922  10.8039    3.8  47.2 -164.1   0.7138   3.0   10.1	GRS 1915+105
263.0155 -33.6841   24.0   3.7    7.2   0.0527   0.5    9.1	GX 354-0
222.5562 -31.0596    2.6  36.1   60.7   1.2420   4.5 ------	UNKNOWN
233.3586 -16.6165    2.5  31.8   91.3   0.9644   4.6 ------	UNKNOWN
197.8762 -59.0153    2.1  52.6   19.5   3.0511   5.4 ------	UNKNOWN
198.0371 -68.9618    2.3  53.6    7.1   2.1122   4.9 ------	UNKNOWN
292.6621   4.1140    0.6  43.6 -154.6   4.1799  20.8 ------	UNKNOWN
293.2387 -58.6631    2.1  34.3  -43.2   0.8694   5.5 ------	UNKNOWN
303.4782 -25.9569    2.6  34.2 -104.8   0.9131   4.4 ------	UNKNOWN
Post-slew image of 15-350 keV band
Time interval of the image:
95.876670 963.066000

# RAcent  DECcent POSerr Theta    Phi  PeakCts   SNR AngSep     Name
#  [deg]    [deg]    ['] [deg]  [deg]                   [']
254.5950  35.3281    5.7  47.0  152.0   4.1941   2.0    6.8	Her X-1
263.0601 -24.8682    5.5  40.8   58.7   4.0182   2.1    7.9	GX 1+4
268.3528  -1.5501    5.4  24.9   92.7   1.8300   2.2    5.9	SW J1753.5-0127
270.2047 -25.1111    3.2  36.5   51.0   4.4192   3.6    4.7	GX 5-1
270.2647 -25.8766    6.1  37.0   50.1   2.3213   1.9    8.3	GRS 1758-258
273.9934 -14.0657    1.9  25.9   60.6   4.9550   6.1    1.9	GX 17+2
275.7733 -30.3838   18.7  38.1   39.3   0.7205   0.6    7.9	H1820-303
284.8863 -24.9389   19.7  30.0   29.6   0.4304   0.6    8.2	HT1900.1-2455
288.7704  10.9288    0.7   7.8  166.3  10.3986  17.1    1.9	GRS 1915+105
299.5892  35.2026    0.3  31.7 -153.7  25.2905  33.2    0.1	Cyg X-1
308.0686  40.9977    2.1  39.4 -146.1   5.9052   5.6    3.3	Cyg X-3
326.3189  38.4300    0.0  46.0 -127.4   2.1734   0.6    9.5	Cyg X-2
277.3568 -23.7932    2.5  31.6   42.8   4.0094   4.7 ------	UNKNOWN
266.9074  20.3081    2.7  29.8  140.4   3.6974   4.3 ------	UNKNOWN
261.6930  49.2225    2.3  52.2  170.3  10.0334   4.9 ------	UNKNOWN
290.1034  -3.3755    2.4   7.9   34.1   2.6800   4.9 ------	UNKNOWN
307.5034   0.4943    2.7  15.3  -61.3   2.5023   4.2 ------	UNKNOWN
315.5469 -12.9513    3.7  28.4  -37.4   1.9524   3.1 ------	UNKNOWN
323.7427 -11.1717    2.9  34.5  -48.0   3.6743   3.9 ------	UNKNOWN
325.4218  43.8638    3.0  49.1 -133.5  11.9296   3.9 ------	UNKNOWN
Plot creation:
Thu May 28 12:54:50 EDT 2015