Click here for the BAT GCN circular template
Image
Pre-slew 15.0-350.0 keV image (Event data)
#   RAcent    DECcent   POSerr    Theta     Phi              Peak Cts       SNR   Name
   49.0444   -22.8675   0.0059    35.2236   -28.5428         8.8075330     32.788 TRIG_00640584

Foreground time interval of the image:
-54.332 129.360 (delta_t = 183.692 [sec])
Background time interval of the image:
-239.312 -54.332 (delta_t = 184.980 [sec])
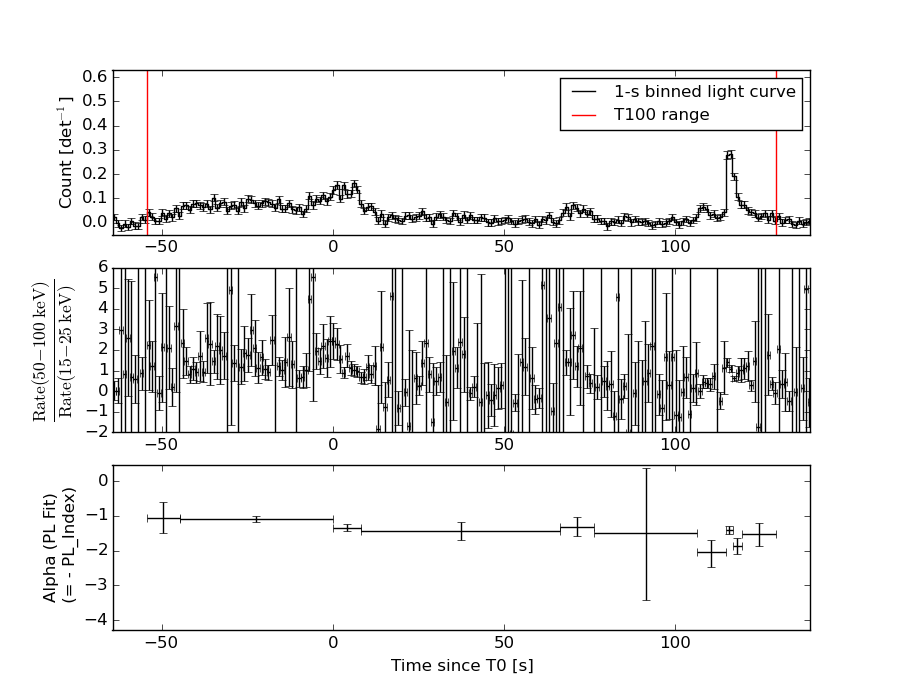
Lightcurves
Notes:
- 1) The mask-weighted light curves are using the flight position.
- 2) Multiple plots of different time binning/intervals are shown to cover all scenarios of short/long GRBs, rate/image triggers, and real/false positives.
- 3) For all the mask-weighted lightcurves, the y-axis units are counts/sec/det where a det is 0.4 x 0.4 = 0.16 sq cm.
- 4) The verticle lines correspond to following: green dotted lines are T50 interval, black dotted lines are T90 interval, blue solid line(s) is a spacecraft slew start time, and orange solid line(s) is a spacecraft slew end time.
- 5) Time of each bin is in the middle of the bin.
1 s binning
From T0-310 s to T0+310 s
From T100_start - 20 s to T100_end + 30 s
Full time interval
64 ms binning
Full time interval
From T100_start to T100_end
From T0-5 sec to T0+5 sec
16 ms binning
From T100_start-5 s to T100_start+5 s
8 ms binning
From T100_start-3 s to T100_start+3 s
2 ms binning
From T100_start-1 s to T100_start+1 s
SN=5 or 10 sec. binning (whichever binning is satisfied first)

SN=5 or 10 sec. binning (T < 200 sec)
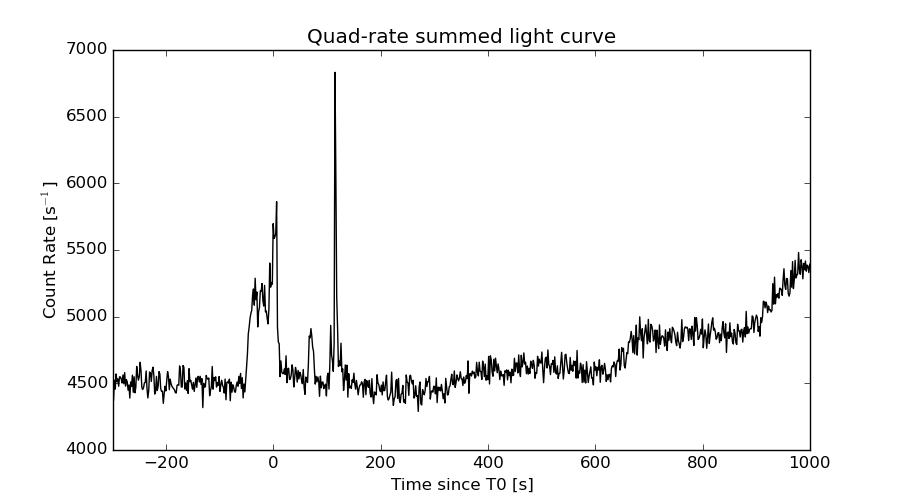
Quad-rate summed light curves (from T0-300s to T0+1000s)
Spectral Evolution
Spectra
Notes:
- 1) The fitting includes the systematic errors.
- 2) When the burst includes telescope slew time periods, the fitting uses an average response file made from multiple 5-s response files through out the slew time plus single time preiod for the non-slew times, and weighted by the total counts in the corresponding time period using addrmf. An average response file is needed becuase a spectral fit using the pre-slew DRM will introduce some errors in both a spectral shape and a normalization if the PHA file contains a lot of the slew/post-slew time interval.
- 3) For fits to more complicated models (e.g. a power-law over a cutoff power-law), the BAT team has decided to require a chi-square improvement of more than 6 for each extra dof.
Time averaged spectrum fit using the average DRM
Power-law model
Time interval is from  -54.332 sec. to  129.360 sec.

Spectral model in power-law:
------------------------------------------------------------
Parameters  : value       lower 90%   higher 90%
Photon index: 1.31043     ( -0.0722043   0.0717267 )
Norm@50keV  : 3.11592E-03    ( -0.000122922   0.000122868 )
------------------------------------------------------------
#Fit statistic : Chi-Squared =          62.32 using 59 PHA bins.
# Reduced chi-squared =          1.093 for     57 degrees of freedom
# Null hypothesis probability =   2.927247e-01

Photon flux (15-150 keV)    in 183.7 sec: 0.372460 ( -0.0158843  0.0159259 ) ph/cm2/s
Energy fluence (15-150 keV)             : 5.64203e-06 ( -2.35514e-07  2.35939e-07 ) ergs/cm2
Cutoff power-law model
Time interval is from  -54.332 sec. to  129.360 sec.
Spectral model in the cutoff power-law:
------------------------------------------------------------
Parameters  : value       lower 90%   higher 90%
Photon index: 1.23699     ( -0.289217   0.11979 )
Epeak [keV] : 573.070      (   )
Norm@50keV  : 3.36576E-03    (     )
------------------------------------------------------------
#Fit statistic : Chi-Squared =          62.04 using 59 PHA bins.
# Reduced chi-squared =          1.108 for     56 degrees of freedom
# Null hypothesis probability =   2.696514e-01

Photon flux (15-150 keV)    in 183.7 sec: 0.370708 ( -0.016748  0.016777 ) ph/cm2/s
Energy fluence (15-150 keV)             : 5.61947e-06 ( -2.50034e-07  2.48785e-07 ) ergs/cm2
Band function

Time interval is from  -54.332 sec. to  129.360 sec.

Spectral model in the Band function:
------------------------------------------------------------
Parameters  : value       lower 90%   higher 90%
alpha       : 0.632913   ( -4.33775   -4.33775 )
beta        : -1.36447    ( -0.0795611   0.0788779 )
Epeak [keV] : 38.6798      ( -38.6482 119.143 )
Norm@50keV   : 6.78421E-02    ( -0.0683103   75.5223 )
------------------------------------------------------------
#Fit statistic : Chi-Squared =          59.62 using 59 PHA bins.
# Reduced chi-squared =          1.084 for     55 degrees of freedom
# Null hypothesis probability =   3.113578e-01

Photon flux (15-150 keV)    in 183.7 sec:  (    ) ph/cm2/s
Energy fluence (15-150 keV)             : 0 ( 0  0 ) ergs/cm2
Single BB
Spectral model blackbody:
------------------------------------------------------------
Parameters  : value    Lower 90%  Upper 90%
kT [keV]    : 18.9749  (  )
R^2/D10^2   : 1.92708E-02  (   )
(R is the radius in km and D10 is the distance to the source in units of 10 kpc)
------------------------------------------------------------
#Fit statistic : Chi-Squared =         212.03 using 59 PHA bins.
# Reduced chi-squared =         3.7198 for     57 degrees of freedom
# Null hypothesis probability =   1.061788e-19

Energy  Fluence     90% Error
[keV]   [erg/cm2]   [erg/cm2]
15- 25  2.507e-07   2.397e-08
25- 50  1.204e-06   6.962e-08
50-150  3.186e-06   2.140e-07
15-150  4.641e-06   2.168e-07
Thermal bremsstrahlung (OTTB)
Spectral model: thermal bremsstrahlung
------------------------------------------------------------
Parameters  : value         Lower 90%    Upper 90%
kT [keV]    : 200.000       (      )
Norm        : 1.57354       (-0.0625787     0.0625533)
------------------------------------------------------------
#Fit statistic : Chi-Squared =         100.08 using 59 PHA bins.
# Reduced chi-squared =         1.7557 for     57 degrees of freedom
# Null hypothesis probability =   3.694261e-04

Energy  Fluence     90% Error
[keV]   [erg/cm2]   [erg/cm2]
15- 25  7.200e-07   3.105e-08
25- 50  1.385e-06   5.851e-08
50-150  3.038e-06   1.359e-07
15-150  5.143e-06   2.260e-07
Double BB
Spectral model: bbodyrad<1> + bbodyrad<2>
------------------------------------------------------------
Parameters  : value         Lower 90%    Upper 90%
kT1 [keV]   : 7.95670        (-0.938398      1.04122)
R1^2/D10^2  : 0.233795        (-0.0775748      0.124234)
kT2 [keV]   : 33.5443        (-4.27668      6.24012)
R2^2/D10^2  : 2.43956E-03    (-0.0010114   0.00139785)
------------------------------------------------------------
#Fit statistic : Chi-Squared =          55.69 using 59 PHA bins.
# Reduced chi-squared =          1.012 for     55 degrees of freedom
# Null hypothesis probability =   4.487731e-01

Energy  Fluence     90% Error
[keV]   [erg/cm2]   [erg/cm2]
15- 25  5.632e-07   8.266e-08
25- 50  1.322e-06   1.371e-07
50-150  3.789e-06   5.557e-07
15-150  5.674e-06   6.182e-07
Peak spectrum fit
Power-law model

Time interval is from  115.412 sec. to  116.412 sec.

Spectral model in power-law:
------------------------------------------------------------
Parameters  : value       lower 90%   higher 90%
Photon index: 1.40251     ( -0.150916   0.15162 )
Norm@50keV  : 2.39681E-02    ( -0.00207304   0.00206545 )
------------------------------------------------------------
#Fit statistic : Chi-Squared =          57.45 using 59 PHA bins.
# Reduced chi-squared =          1.008 for     57 degrees of freedom
# Null hypothesis probability =   4.582925e-01

Photon flux (15-150 keV)    in 1 sec: 2.92054 ( -0.257593  0.258078 ) ph/cm2/s
Energy fluence (15-150 keV)             : 2.31477e-07 ( -2.2039e-08  2.21507e-08 ) ergs/cm2
Cutoff power-law model
Time interval is from  115.412 sec. to  116.412 sec.
Spectral model in the cutoff power-law:
------------------------------------------------------------
Parameters  : value       lower 90%   higher 90%
Photon index: 1.39893     ( -0.542947   0.152536 )
Epeak [keV] : 9997.46      ( -9998.91 -9998.91 )
Norm@50keV  : 2.40593E-02    ( -0.0240551   0.0189608 )
------------------------------------------------------------
#Fit statistic : Chi-Squared =          57.46 using 59 PHA bins.
# Reduced chi-squared =          1.026 for     56 degrees of freedom
# Null hypothesis probability =   4.210437e-01

Photon flux (15-150 keV)    in 1 sec: 2.92062 ( -0.26018  0.25664 ) ph/cm2/s
Energy fluence (15-150 keV)             : 2.31127e-07 ( -2.2174e-08  2.2496e-08 ) ergs/cm2
Band function
Time interval is from  115.412 sec. to  116.412 sec.

Spectral model in the Band function:
------------------------------------------------------------
Parameters  : value       lower 90%   higher 90%
alpha       : -1.11675   ( 1.11675   1.11675 )
beta        : -1.40251    ( 1.40251   0.151 )
Epeak [keV] : 39.8769      ( -39.8769 -39.8769 )
Norm@50keV   : 4.69747E-02    ( -0.0194088   3.49136 )
------------------------------------------------------------
#Fit statistic : Chi-Squared =          57.45 using 59 PHA bins.
# Reduced chi-squared =          1.045 for     55 degrees of freedom
# Null hypothesis probability =   3.844352e-01

Photon flux (15-150 keV)    in 1 sec:  (    ) ph/cm2/s
Energy fluence (15-150 keV)             : 0 ( 0  0 ) ergs/cm2
Single BB
Spectral model blackbody:
------------------------------------------------------------
Parameters  : value    Lower 90%  Upper 90%
kT [keV]    : 17.4343  (-1.95552  2.25026)
R^2/D10^2   : 0.200579  (-0.0677619   0.10081)
(R is the radius in km and D10 is the distance to the source in units of 10 kpc)
------------------------------------------------------------
#Fit statistic : Chi-Squared =          96.84 using 59 PHA bins.
# Reduced chi-squared =          1.699 for     57 degrees of freedom
# Null hypothesis probability =   7.810467e-04

Energy  Fluence     90% Error
[keV]   [erg/cm2]   [erg/cm2]
15- 25  1.233e-08   2.300e-09
25- 50  5.564e-08   7.280e-09
50-150  1.217e-07   1.898e-08
15-150  1.897e-07   2.090e-08
Thermal bremsstrahlung (OTTB)
Spectral model: thermal bremsstrahlung
------------------------------------------------------------
Parameters  : value         Lower 90%    Upper 90%
kT [keV]    : 200.000       (      )
Norm        : 12.0660       (-1.03657     1.03651)
------------------------------------------------------------
#Fit statistic : Chi-Squared =          61.73 using 59 PHA bins.
# Reduced chi-squared =          1.083 for     57 degrees of freedom
# Null hypothesis probability =   3.108699e-01

Energy  Fluence     90% Error
[keV]   [erg/cm2]   [erg/cm2]
15- 25  3.004e-08   3.295e-09
25- 50  5.780e-08   1.792e-08
50-150  1.267e-07   4.832e-08
15-150  2.146e-07   5.645e-08
Double BB

Spectral model: bbodyrad<1> + bbodyrad<2>
------------------------------------------------------------
Parameters  : value         Lower 90%    Upper 90%
kT1 [keV]   : 5.57741        (-1.60062      2.22157)
R1^2/D10^2  : 6.48016        (-4.51953      20.5867)
kT2 [keV]   : 25.8297        (-4.60446      8.44832)
R2^2/D10^2  : 4.58970E-02    (-0.0284204   0.0460013)
------------------------------------------------------------
#Fit statistic : Chi-Squared =          58.24 using 59 PHA bins.
# Reduced chi-squared =          1.059 for     55 degrees of freedom
# Null hypothesis probability =   3.568903e-01

Energy  Fluence     90% Error
[keV]   [erg/cm2]   [erg/cm2]
15- 25  2.916e-08   1.380e-08
25- 50  5.041e-08   1.580e-08
50-150  1.497e-07   3.858e-08
15-150  2.292e-07   5.785e-08
Pre-slew spectrum (Pre-slew PHA with pre-slew DRM)
Power-law model

Spectral model in power-law:
------------------------------------------------------------
Parameters  : value       lower 90%   higher 90%
Photon index: 1.31043     ( -0.0722043   0.0717267 )
Norm@50keV  : 3.11592E-03    ( -0.000122922   0.000122868 )
------------------------------------------------------------
#Fit statistic : Chi-Squared =          62.32 using 59 PHA bins.
# Reduced chi-squared =          1.093 for     57 degrees of freedom
# Null hypothesis probability =   2.927247e-01

Photon flux (15-150 keV)    in 183.7 sec: 0.372460 ( -0.0158843  0.0159259 ) ph/cm2/s
Energy fluence (15-150 keV)             : 5.64203e-06 ( -2.35514e-07  2.35939e-07 ) ergs/cm2
Cutoff power-law model

Spectral model in the cutoff power-law:
------------------------------------------------------------
Parameters  : value       lower 90%   higher 90%
Photon index: 1.23699     ( -0.289217   0.11979 )
Epeak [keV] : 573.070      (   )
Norm@50keV  : 3.36576E-03    (     )
------------------------------------------------------------
#Fit statistic : Chi-Squared =          62.04 using 59 PHA bins.
# Reduced chi-squared =          1.108 for     56 degrees of freedom
# Null hypothesis probability =   2.696514e-01

Photon flux (15-150 keV)    in 183.7 sec: 0.370708 ( -0.016748  0.016777 ) ph/cm2/s
Energy fluence (15-150 keV)             : 5.61947e-06 ( -2.50034e-07  2.48785e-07 ) ergs/cm2
Band function
Spectral model in the Band function:
------------------------------------------------------------
Parameters  : value       lower 90%   higher 90%
alpha       : 0.632913   ( -4.33775   -4.33775 )
beta        : -1.36447    ( -0.0795611   0.0788779 )
Epeak [keV] : 38.6798      ( -38.6482 119.143 )
Norm@50keV   : 6.78421E-02    ( -0.0683103   75.527 )
------------------------------------------------------------
#Fit statistic : Chi-Squared =          59.62 using 59 PHA bins.
# Reduced chi-squared =          1.084 for     55 degrees of freedom
# Null hypothesis probability =   3.113578e-01

Photon flux (15-150 keV)    in 183.7 sec:  (    ) ph/cm2/s
Energy fluence (15-150 keV)             : 0 ( 0  0 ) ergs/cm2
S(25-50 keV) vs. S(50-100 keV) plot
S(25-50 keV)  = 1.26e-06
S(50-100 keV) = 2.04e-06
T90 vs. Hardness ratio plot
T90                                   = 161.563999950886 sec.
Hardness ratio (energy fluence ratio) = 1.61905
Color vs. Color plot
Count Ratio  (25-50 keV) / (15-25 keV) = 1.64516
Count Ratio (50-100 keV) / (15-25 keV) = 1.48289
Mask shadow pattern
IMX = 6.202286225659043E-01, IMY = 3.373561259981325E-01
TIME vs. PHA plot around the trigger time
TIME vs. DetID plot around the trigger time
100 us light curve (15-350 keV)

Spacecraft aspect plot
Bright source in the pre-burst/pre-slew/post-slew images
Pre-burst image of 15-350 keV band
Time interval of the image:
-239.312000 -54.332000

# RAcent  DECcent POSerr Theta    Phi  PeakCts   SNR AngSep     Name
#  [deg]    [deg]    ['] [deg]  [deg]                   [']
327.6067  11.4625    2.6  54.1  177.0   3.0105   4.5 ------	UNKNOWN
333.0673   6.7252    2.8  46.9  176.6   1.5368   4.2 ------	UNKNOWN
327.7788  13.4759    2.8  55.3  179.1   3.4430   4.2 ------	UNKNOWN
 25.0866   4.8044    3.1  30.4  -98.1   0.9299   3.7 ------	UNKNOWN
  5.7670  26.7342    2.0  49.2 -133.0   4.4198   5.8 ------	UNKNOWN
Pre-slew background subtracted image of 15-350 keV band
Time interval of the image:
-54.332000 129.360000

# RAcent  DECcent POSerr Theta    Phi  PeakCts   SNR AngSep     Name
#  [deg]    [deg]    ['] [deg]  [deg]                   [']
 49.6879 -45.2244    1.9  39.1    8.4   1.8282   5.9 ------	UNKNOWN
 49.0444 -22.8675    0.4  35.2  -28.5   8.8063  32.8 ------	UNKNOWN
 44.6623  -9.3088    2.4  34.9  -53.4   1.5269   4.7 ------	UNKNOWN
Post-slew image of 15-350 keV band
Time interval of the image:
381.188600 627.888590

# RAcent  DECcent POSerr Theta    Phi  PeakCts   SNR AngSep     Name
#  [deg]    [deg]    ['] [deg]  [deg]                   [']
 83.6563  21.9976    1.0  45.8  -57.8  11.5051  11.3    1.6	Crab
 78.9809 -70.0285    2.7  47.6  139.1   3.8036   4.3 ------	UNKNOWN
 24.7996 -39.4041    2.9  58.4 -170.1   4.7608   4.0 ------	UNKNOWN
121.3130  29.1695    2.8  59.4  -17.2   6.2964   4.1 ------	UNKNOWN
Plot creation:
Sun May 31 23:25:00 EDT 2015