Click here for the BAT GCN circular template
Image
Pre-slew 15-350 keV image (Event data; bkg subtracted)

#   RAcent  DECcent POSerr  Theta    Phi     Peak Cts     SNR  Name
  306.0164 +33.8565 0.0150   21.0  107.1       2.7429    12.7  TRIG_00643949
------------------------------------------

Foreground time interval of the image:
-16.699 120.401 (delta_t = 137.100 [sec])
Background time interval of the image:
Lightcurves
Notes:
- 1) All plots contain as much data as has been downloaded to date.
- 2) The mask-weighted light curves are using the flight position.
- 3) Multiple plots of different time binning/intervals are shown to cover all scenarios of short/long GRBs, rate/image triggers, and real/false positives.
- 4) For all the mask-weighted lightcurves, the y-axis units are counts/sec/det where a det is 0.4 x 0.4 = 0.16 sq cm.
- 5) The verticle lines correspond to following: green dotted lines are T50 interval, black dotted lines are T90 interval, blue solid line(s) is a spacecraft slew start time, and orange solid line(s) is a spacecraft slew end time.
- 6) Time of each bin is in the middle of the bin.
1 s binning
From T0-310 s to T0+310 s

From T100_start - 20 s to T100_end + 30 s

Full time interval

64 ms binning
Full time interval

From T100_start to T100_end

From T0-5 sec to T0+5 sec

16 ms binning
From T100_start-5 s to T100_start+5 s

8 ms binning
From T100_start-3 s to T100_start+3 s

2 ms binning
From T100_start-1 s to T100_start+1 s

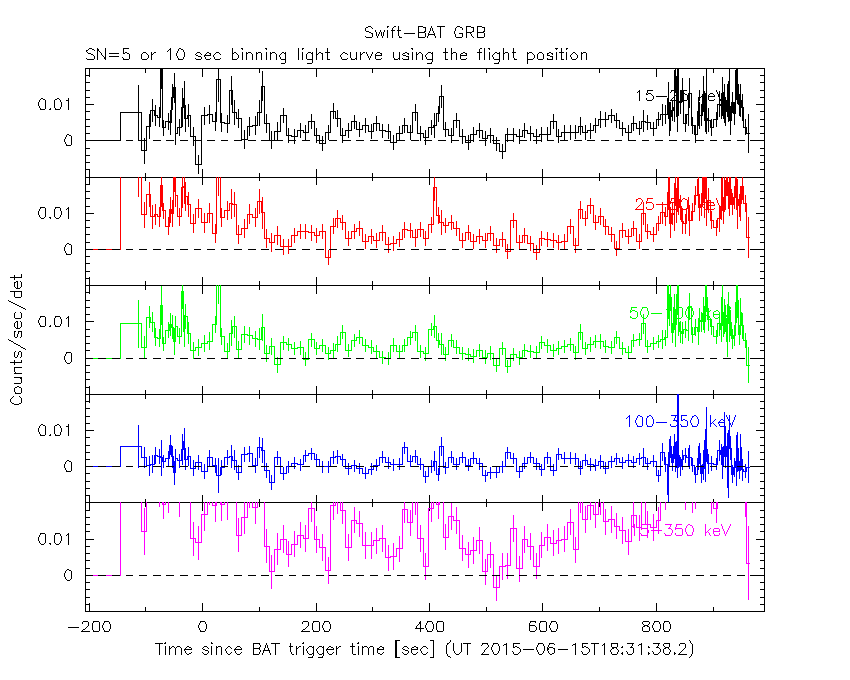
SN=5 or 10 sec. binning (whichever binning is satisfied first)
SN=5 or 10 sec. binning (T < 200 sec)

Spectra
Notes:
- 1) The fitting includes the systematic errors.
- 2) For long bursts, a spectral fit of the pre-slew DRM will introduce some errors in both a spectral shape and a normalization if the PHA file contains a lot of the slew/post-slew time interval.
- 3) For fits to more complicated models (e.g. a power-law over a cutoff power-law), the BAT team has decided to require a chi-square improvement of more than 6 for each extra dof.
- 4) For short bursts (T90<1sec), the specrtum is also fit with Blackbody, OTTB, and Double Blackbody.
Time averaged spectrum fit using the pre-slew DRM
Power-law model

Time interval is from -100.056 sec. to  953.764 sec.

Spectral model in power-law:
------------------------------------------------------------
Parameters  : value       lower 90%   higher 90%
Photon index: 1.52216     ( -0.0711949   0.0712238 )
Norm@50keV  : 1.05582E-03    ( -4.12153e-05   4.11636e-05 )
------------------------------------------------------------
#Fit statistic : Chi-Squared =          68.53 using 59 PHA bins.
# Reduced chi-squared =          1.202 for     57 degrees of freedom
# Null hypothesis probability =   1.409705e-01

Photon flux (15-150 keV)    in 1054 sec: 0.132609 ( -0.00535265  0.0053624 ) ph/cm2/s
Energy fluence (15-150 keV)             : 1.05198e-05 ( -4.45202e-07  4.4691e-07 ) ergs/cm2
Cutoff power-law model

Time interval is from -100.056 sec. to  953.764 sec.
Spectral model in the cutoff power-law:
------------------------------------------------------------
Parameters  : value       lower 90%   higher 90%
Photon index: 1.26670     ( -0.293101   0.273293 )
Epeak [keV] : 143.187      ( -51.3879 -143.189 )
Norm@50keV  : 1.41831E-03    ( -0.000348815   0.000555875 )
------------------------------------------------------------
#Fit statistic : Chi-Squared =          65.99 using 59 PHA bins.
# Reduced chi-squared =          1.178 for     56 degrees of freedom
# Null hypothesis probability =   1.696467e-01

Photon flux (15-150 keV)    in 1054 sec: 0.130575 ( -0.005758  0.005759 ) ph/cm2/s
Energy fluence (15-150 keV)             : 1.02807e-05 ( -5.19127e-07  5.15764e-07 ) ergs/cm2
Band function

Time interval is from -100.056 sec. to  953.764 sec.

Spectral model in the Band function:
------------------------------------------------------------
Parameters  : value       lower 90%   higher 90%
alpha       : 2.42984   ( -4.41486   -3.85908 )
beta        : -1.63999    ( -0.104248   0.095798 )
Epeak [keV] : 30.6944      ( -3.92138 21.6634 )
Norm@50keV   : 0.652537    ( -0.652226   23.5888 )
------------------------------------------------------------
#Fit statistic : Chi-Squared =          57.53 using 59 PHA bins.
# Reduced chi-squared =          1.046 for     55 degrees of freedom
# Null hypothesis probability =   3.816454e-01

Photon flux (15-150 keV)    in 1054 sec:  (    ) ph/cm2/s
Energy fluence (15-150 keV)             : 0 ( 0  0 ) ergs/cm2
Single BB

Spectral model blackbody:
------------------------------------------------------------
Parameters  : value    Lower 90%  Upper 90%
kT [keV]    : 14.6823  (  )
R^2/D10^2   : 1.56233E-02  (   )
(R is the radius in km and D10 is the distance to the source in units of 10 kpc)
------------------------------------------------------------
#Fit statistic : Chi-Squared =         201.37 using 59 PHA bins.
# Reduced chi-squared =         3.5328 for     57 degrees of freedom
# Null hypothesis probability =   5.404778e-18

Energy  Fluence     90% Error
[keV]   [erg/cm2]   [erg/cm2]
15- 25  7.456e-07   5.818e-08
25- 50  2.904e-06   1.339e-07
50-150  4.219e-06   3.557e-07
15-150  7.869e-06   3.620e-07
Thermal bremsstrahlung (OTTB)

Spectral model: thermal bremsstrahlung
------------------------------------------------------------
Parameters  : value         Lower 90%    Upper 90%
kT [keV]    : 200.000       (      )
Norm        : 0.540208       (-0.0207216     0.0207138)
------------------------------------------------------------
#Fit statistic : Chi-Squared =          66.44 using 59 PHA bins.
# Reduced chi-squared =          1.166 for     57 degrees of freedom
# Null hypothesis probability =   1.837527e-01

Energy  Fluence     90% Error
[keV]   [erg/cm2]   [erg/cm2]
15- 25  1.418e-06   5.744e-08
25- 50  2.728e-06   1.086e-07
50-150  5.983e-06   2.498e-07
15-150  1.013e-05   4.053e-07
Double BB

Spectral model: bbodyrad<1> + bbodyrad<2>
------------------------------------------------------------
Parameters  : value         Lower 90%    Upper 90%
kT1 [keV]   : 8.14399        (-0.987613      1.05341)
R1^2/D10^2  : 8.83231E-02        (-0.0277989      0.0450781)
kT2 [keV]   : 31.9104        (-5.65428      9.85197)
R2^2/D10^2  : 7.97663E-04    (-0.000455405   0.000775124)
------------------------------------------------------------
#Fit statistic : Chi-Squared =          60.60 using 59 PHA bins.
# Reduced chi-squared =          1.102 for     55 degrees of freedom
# Null hypothesis probability =   2.809877e-01

Energy  Fluence     90% Error
[keV]   [erg/cm2]   [erg/cm2]
15- 25  1.260e-06   1.401e-07
25- 50  2.856e-06   2.735e-07
50-150  6.272e-06   1.474e-06
15-150  1.039e-05   1.541e-06
Peak spectrum fit
Power-law model

Time interval is from   58.152 sec. to   59.152 sec.

Spectral model in power-law:
------------------------------------------------------------
Parameters  : value       lower 90%   higher 90%
Photon index: 1.42437     ( -0.517485   0.51973 )
Norm@50keV  : 5.18116E-03    ( -0.0015422   0.0015195 )
------------------------------------------------------------
#Fit statistic : Chi-Squared =          48.37 using 59 PHA bins.
# Reduced chi-squared =         0.8486 for     57 degrees of freedom
# Null hypothesis probability =   7.850932e-01

Photon flux (15-150 keV)    in 1 sec: 0.634562 ( -0.186639  0.18738 ) ph/cm2/s
Energy fluence (15-150 keV)             : 4.98211e-08 ( -1.60487e-08  1.64803e-08 ) ergs/cm2
Cutoff power-law model

Time interval is from   58.152 sec. to   59.152 sec.
Spectral model in the cutoff power-law:
------------------------------------------------------------
Parameters  : value       lower 90%   higher 90%
Photon index: 0.977816     ( -3.49565   1.45522 )
Epeak [keV] : 116.049      ( -142.977 -142.977 )
Norm@50keV  : 8.63287E-03    (     )
------------------------------------------------------------
#Fit statistic : Chi-Squared =          48.20 using 59 PHA bins.
# Reduced chi-squared =         0.8608 for     56 degrees of freedom
# Null hypothesis probability =   7.611774e-01

Photon flux (15-150 keV)    in 1 sec: 0.621282 ( -0.197678  0.193877 ) ph/cm2/s
Energy fluence (15-150 keV)             : 4.82061e-08 ( -1.66962e-08  1.75799e-08 ) ergs/cm2
Band function

Time interval is from   58.152 sec. to   59.152 sec.

Spectral model in the Band function:
------------------------------------------------------------
Parameters  : value       lower 90%   higher 90%
alpha       : -0.874696   ( 0.874287   3.65383 )
beta        : -2.22124    ( 2.04132   11.1612 )
Epeak [keV] : 101.728      ( -101.904 -101.904 )
Norm@50keV   : 9.86915E-03    ( -0.00510008   0 )
------------------------------------------------------------
#Fit statistic : Chi-Squared =          48.19 using 59 PHA bins.
# Reduced chi-squared =         0.8763 for     55 degrees of freedom
# Null hypothesis probability =   7.302307e-01

Photon flux (15-150 keV)    in 1 sec:  (    ) ph/cm2/s
Energy fluence (15-150 keV)             : 0 ( 0  0 ) ergs/cm2
Single BB

Spectral model blackbody:
------------------------------------------------------------
Parameters  : value    Lower 90%  Upper 90%
kT [keV]    : 16.9454  (-4.82061  7.35424)
R^2/D10^2   : 4.89364E-02  (-0.0489364   0.10659)
(R is the radius in km and D10 is the distance to the source in units of 10 kpc)
------------------------------------------------------------
#Fit statistic : Chi-Squared =          49.85 using 59 PHA bins.
# Reduced chi-squared =         0.8745 for     57 degrees of freedom
# Null hypothesis probability =   7.379233e-01

Energy  Fluence     90% Error
[keV]   [erg/cm2]   [erg/cm2]
15- 25  2.864e-09   1.798e-09
25- 50  1.264e-08   7.850e-09
50-150  2.589e-08   1.712e-08
15-150  4.140e-08   2.580e-08
Thermal bremsstrahlung (OTTB)

Spectral model: thermal bremsstrahlung
------------------------------------------------------------
Parameters  : value         Lower 90%    Upper 90%
kT [keV]    : 199.363       (-126.341      -199.363)
Norm        : 2.61903       (-0.756601     0.756649)
------------------------------------------------------------
#Fit statistic : Chi-Squared =          48.44 using 59 PHA bins.
# Reduced chi-squared =         0.8498 for     57 degrees of freedom
# Null hypothesis probability =   7.829882e-01

Energy  Fluence     90% Error
[keV]   [erg/cm2]   [erg/cm2]
15- 25  6.522e-09   4.169e-09
25- 50  1.254e-08   7.580e-09
50-150  2.751e-08   1.675e-08
15-150  4.658e-08   2.876e-08
Double BB

Spectral model: bbodyrad<1> + bbodyrad<2>
------------------------------------------------------------
Parameters  : value         Lower 90%    Upper 90%
kT1 [keV]   : 3.82932        (-3.67154      13.5731)
R1^2/D10^2  : 5.88312        (-5.87766      -5.88657)
kT2 [keV]   : 20.0499        (-6.26283      177.859)
R2^2/D10^2  : 2.51286E-02    (-0.0250931   0.0564859)
------------------------------------------------------------
#Fit statistic : Chi-Squared =          47.13 using 59 PHA bins.
# Reduced chi-squared =         0.8568 for     55 degrees of freedom
# Null hypothesis probability =   7.659469e-01

Energy  Fluence     90% Error
[keV]   [erg/cm2]   [erg/cm2]
15- 25  6.260e-09   3.683e-09
25- 50  1.108e-08   6.155e-09
50-150  2.895e-08   1.829e-08
15-150  4.629e-08   2.634e-08
Pre-slew spectrum (Pre-slew PHA with pre-slew DRM)
Power-law model

Spectral model in power-law:
------------------------------------------------------------
Parameters  : value       lower 90%   higher 90%
Photon index: 1.50771     ( -0.16635   0.167765 )
Norm@50keV  : 1.25929E-03    ( -0.00013169   0.000130854 )
------------------------------------------------------------
#Fit statistic : Chi-Squared =          77.89 using 59 PHA bins.
# Reduced chi-squared =          1.366 for     57 degrees of freedom
# Null hypothesis probability =   3.444759e-02

Photon flux (15-150 keV)    in 137.1 sec: 0.157536 ( -0.0158417  0.0158538 ) ph/cm2/s
Energy fluence (15-150 keV)             : 1.63579e-06 ( -1.8659e-07  1.8919e-07 ) ergs/cm2
Cutoff power-law model

Spectral model in the cutoff power-law:
------------------------------------------------------------
Parameters  : value       lower 90%   higher 90%
Photon index: 0.283773     ( -1.05559   0.83154 )
Epeak [keV] : 63.6836      ( -12.4025 41.6773 )
Norm@50keV  : 5.79485E-03    ( -0.00370569   0.0157518 )
------------------------------------------------------------
#Fit statistic : Chi-Squared =          71.00 using 59 PHA bins.
# Reduced chi-squared =          1.268 for     56 degrees of freedom
# Null hypothesis probability =   8.551301e-02

Photon flux (15-150 keV)    in 137.1 sec: 0.149965 ( -0.016692  0.016655 ) ph/cm2/s
Energy fluence (15-150 keV)             : 1.45041e-06 ( -2.1116e-07  2.22925e-07 ) ergs/cm2
Band function

Spectral model in the Band function:
------------------------------------------------------------
Parameters  : value       lower 90%   higher 90%
alpha       : 0.416380   ( -1.27765   -0.436569 )
beta        : -2.13472    ( 2.13218   0.467592 )
Epeak [keV] : 50.6375      ( -18.6104 29.4971 )
Norm@50keV   : 1.61915E-02    ( -0.0179577   17.9399 )
------------------------------------------------------------
#Fit statistic : Chi-Squared =          69.21 using 59 PHA bins.
# Reduced chi-squared =          1.258 for     55 degrees of freedom
# Null hypothesis probability =   9.417097e-02

Photon flux (15-150 keV)    in 137.1 sec:  (    ) ph/cm2/s
Energy fluence (15-150 keV)             : 1.50676e-06 ( 0  0 ) ergs/cm2
S(25-50 keV) vs. S(50-100 keV) plot

S(25-50 keV)  = 2.63e-06
S(50-100 keV) = 3.66e-06
T90 vs. Hardness ratio plot

T90                                   = 1025.97199994326 sec.
Hardness ratio (energy fluence ratio) = 1.39163
Color vs. Color plot

Count Ratio  (25-50 keV) / (15-25 keV) = 1.54193
Count Ratio (50-100 keV) / (15-25 keV) = 1.05668
Mask shadow pattern

IMX = -1.131747111925404E-01, IMY = -3.672063116602112E-01
TIME vs. PHA plot around the trigger time

TIME vs. DetID plot around the trigger time

100 us light curve (15-350 keV)

Spacecraft aspect plot

Bright source in the pre-burst/pre-slew/post-slew images
Pre-burst image of 15-350 keV band
Time interval of the image:
Pre-slew background subtracted image of 15-350 keV band
Time interval of the image:
-16.699400 120.400600

# RAcent  DECcent POSerr Theta    Phi  PeakCts   SNR AngSep     Name
#  [deg]    [deg]    ['] [deg]  [deg]                   [']
299.5985  35.1948    0.7  25.1  116.5   3.7524  16.2    0.6	Cyg X-1
307.9775  41.0139    2.8  16.9  126.0   0.7065   4.2    7.0	Cyg X-3
325.9581  38.2985   18.9   5.3   76.2   0.0940   0.6   10.2	Cyg X-2
307.1857  11.6846    2.2  36.7   73.1   2.7626   5.4 ------	UNKNOWN
286.5312  31.0446    3.1  36.7  119.4   1.7329   3.7 ------	UNKNOWN
303.7367  25.0147    2.8  28.0   93.2   1.1921   4.1 ------	UNKNOWN
306.0164  33.8565    0.9  21.0  107.1   2.7414  12.8 ------	UNKNOWN
Post-slew image of 15-350 keV band
Time interval of the image:
163.300600 919.300600

# RAcent  DECcent POSerr Theta    Phi  PeakCts   SNR AngSep     Name
#  [deg]    [deg]    ['] [deg]  [deg]                   [']
254.4192  35.2280    6.5  42.1  156.2   2.2347   1.8    7.1	Her X-1
288.9937  10.9903    6.2  27.7   87.4  -1.7687  -1.9   11.8	GRS 1915+105
299.5911  35.1983    0.3   5.5  155.0  18.6513  37.2    0.2	Cyg X-1
308.1030  40.9176    1.1   7.2 -118.5   5.6492  10.1    2.1	Cyg X-3
326.1747  38.3395    4.1  16.8  -62.1   1.5139   2.8    1.1	Cyg X-2
306.0101  33.8810    0.6   0.0  164.2  10.6526  20.3 ------	UNKNOWN
319.9743  80.2446    3.5  46.7 -127.7   7.3109   3.3 ------	UNKNOWN
Plot creation:
Tue Jun 16 12:23:53 EDT 2015