Special notes of this burst
Image
Pre-slew 15.0-350.0 keV image (Event data)

#   RAcent    DECcent   POSerr    Theta     Phi              Peak Cts       SNR   Name
  314.7121   -53.4024   0.0079    40.1680  -123.2269        24.9704569     24.319 TRIG_00644259

Foreground time interval of the image:
-48.140 492.809 (delta_t = 540.949 [sec])
Background time interval of the image:
-239.992 -48.140 (delta_t = 191.852 [sec])
Lightcurves
Notes:
- 1) The mask-weighted light curves are using the flight position.
- 2) Multiple plots of different time binning/intervals are shown to cover all scenarios of short/long GRBs, rate/image triggers, and real/false positives.
- 3) For all the mask-weighted lightcurves, the y-axis units are counts/sec/det where a det is 0.4 x 0.4 = 0.16 sq cm.
- 4) The verticle lines correspond to following: green dotted lines are T50 interval, black dotted lines are T90 interval, blue solid line(s) is a spacecraft slew start time, and orange solid line(s) is a spacecraft slew end time.
- 5) Time of each bin is in the middle of the bin.
1 s binning
From T0-310 s to T0+310 s

From T100_start - 20 s to T100_end + 30 s

Full time interval

64 ms binning
Full time interval

From T100_start to T100_end

From T0-5 sec to T0+5 sec

16 ms binning
From T100_start-5 s to T100_start+5 s

Blue+Cyan dotted lines: Time interval of the scaled map
From 0.000000 to 16.384000
8 ms binning
From T100_start-3 s to T100_start+3 s
Blue+Cyan dotted lines: Time interval of the scaled map
From 0.000000 to 16.384000
2 ms binning
From T100_start-1 s to T100_start+1 s

Blue+Cyan dotted lines: Time interval of the scaled map
From 0.000000 to 16.384000
SN=5 or 10 sec. binning (whichever binning is satisfied first)

SN=5 or 10 sec. binning (T < 200 sec)

Quad-rate summed light curves (from T0-300s to T0+1000s)

Spectral Evolution

Spectra
Notes:
- 1) The fitting includes the systematic errors.
- 2) When the burst includes telescope slew time periods, the fitting uses an average response file made from multiple 5-s response files through out the slew time plus single time preiod for the non-slew times, and weighted by the total counts in the corresponding time period using addrmf. An average response file is needed becuase a spectral fit using the pre-slew DRM will introduce some errors in both a spectral shape and a normalization if the PHA file contains a lot of the slew/post-slew time interval.
- 3) For fits to more complicated models (e.g. a power-law over a cutoff power-law), the BAT team has decided to require a chi-square improvement of more than 6 for each extra dof.
Time averaged spectrum fit using the average DRM
Power-law model

Time interval is from  -48.140 sec. to  705.776 sec.

Spectral model in power-law:
------------------------------------------------------------
Parameters  : value       lower 90%   higher 90%
Photon index: 1.66075     ( -0.0569761   0.0570713 )
Norm@50keV  : 2.80031E-03    ( -8.50317e-05   8.50102e-05 )
------------------------------------------------------------
#Fit statistic : Chi-Squared =          44.53 using 59 PHA bins.
# Reduced chi-squared =         0.7813 for     57 degrees of freedom
# Null hypothesis probability =   8.853150e-01

Photon flux (15-150 keV)    in 753.9 sec: 0.366958 ( -0.0125712  0.0126224 ) ph/cm2/s
Energy fluence (15-150 keV)             : 1.96138e-05 ( -6.14249e-07  6.14903e-07 ) ergs/cm2
Cutoff power-law model

Time interval is from  -48.140 sec. to  705.776 sec.
Spectral model in the cutoff power-law:
------------------------------------------------------------
Parameters  : value       lower 90%   higher 90%
Photon index: 1.42784     ( -0.235619   0.22362 )
Epeak [keV] : 131.717      ( -40.6975 868.236 )
Norm@50keV  : 3.60039E-03    ( -0.000754084   0.00101209 )
------------------------------------------------------------
#Fit statistic : Chi-Squared =          41.37 using 59 PHA bins.
# Reduced chi-squared =         0.7388 for     56 degrees of freedom
# Null hypothesis probability =   9.279019e-01

Photon flux (15-150 keV)    in 753.9 sec: 0.360419 ( -0.013891  0.013957 ) ph/cm2/s
Energy fluence (15-150 keV)             : 1.93146e-05 ( -6.84164e-07  6.81149e-07 ) ergs/cm2
Band function

Time interval is from  -48.140 sec. to  705.776 sec.

Spectral model in the Band function:
------------------------------------------------------------
Parameters  : value       lower 90%   higher 90%
alpha       : -1.26514   ( -0.42924   3.31977 )
beta        : -1.78727    ( 1.77063   0.122467 )
Epeak [keV] : 86.1327      ( -49.4357 457.598 )
Norm@50keV   : 4.47196E-03    ( -0.00154117   260.132 )
------------------------------------------------------------
#Fit statistic : Chi-Squared =          40.84 using 59 PHA bins.
# Reduced chi-squared =         0.7426 for     55 degrees of freedom
# Null hypothesis probability =   9.224504e-01

Photon flux (15-150 keV)    in 753.9 sec:  (    ) ph/cm2/s
Energy fluence (15-150 keV)             : 1.92741e-05 ( -1.92689e-05  -6.7851e-07 ) ergs/cm2
Single BB

Spectral model blackbody:
------------------------------------------------------------
Parameters  : value    Lower 90%  Upper 90%
kT [keV]    : 15.3170  (  )
R^2/D10^2   : 3.56265E-02  (   )
(R is the radius in km and D10 is the distance to the source in units of 10 kpc)
------------------------------------------------------------
#Fit statistic : Chi-Squared =         275.11 using 59 PHA bins.
# Reduced chi-squared =         4.8266 for     57 degrees of freedom
# Null hypothesis probability =   2.543301e-30

Energy  Fluence     90% Error
[keV]   [erg/cm2]   [erg/cm2]
15- 25  1.315e-06   7.577e-08
25- 50  5.323e-06   2.171e-07
50-150  8.578e-06   5.127e-07
15-150  1.522e-05   5.390e-07
Thermal bremsstrahlung (OTTB)

Spectral model: thermal bremsstrahlung
------------------------------------------------------------
Parameters  : value         Lower 90%    Upper 90%
kT [keV]    : 166.463       (-23.6885      30.7959)
Norm        : 1.47609       (-0.0564851     0.0610851)
------------------------------------------------------------
#Fit statistic : Chi-Squared =          42.49 using 59 PHA bins.
# Reduced chi-squared =         0.7455 for     57 degrees of freedom
# Null hypothesis probability =   9.237819e-01

Energy  Fluence     90% Error
[keV]   [erg/cm2]   [erg/cm2]
15- 25  2.830e-06   1.640e-07
25- 50  5.323e-06   3.298e-07
50-150  1.095e-05   2.663e-06
15-150  1.910e-05   2.846e-06
Double BB

Spectral model: bbodyrad<1> + bbodyrad<2>
------------------------------------------------------------
Parameters  : value         Lower 90%    Upper 90%
kT1 [keV]   : 7.34938        (-0.832207      0.897412)
R1^2/D10^2  : 0.333393        (-0.106523      0.176887)
kT2 [keV]   : 26.4600        (-2.87315      3.96829)
R2^2/D10^2  : 3.86863E-03    (-0.00155169   0.00213327)
------------------------------------------------------------
#Fit statistic : Chi-Squared =          49.96 using 59 PHA bins.
# Reduced chi-squared =         0.9083 for     55 degrees of freedom
# Null hypothesis probability =   6.672645e-01

Energy  Fluence     90% Error
[keV]   [erg/cm2]   [erg/cm2]
15- 25  2.632e-06   3.057e-07
25- 50  5.444e-06   3.777e-07
50-150  1.099e-05   1.029e-06
15-150  1.906e-05   1.225e-06
Peak spectrum fit
Power-law model

Time interval is from   93.584 sec. to   94.584 sec.

Spectral model in power-law:
------------------------------------------------------------
Parameters  : value       lower 90%   higher 90%
Photon index: 1.58792     ( -0.217534   0.221935 )
Norm@50keV  : 2.19124E-02    ( -0.00282874   0.00280999 )
------------------------------------------------------------
#Fit statistic : Chi-Squared =          60.15 using 59 PHA bins.
# Reduced chi-squared =          1.055 for     57 degrees of freedom
# Null hypothesis probability =   3.623411e-01

Photon flux (15-150 keV)    in 1 sec: 2.80542 ( -0.366809  0.368333 ) ph/cm2/s
Energy fluence (15-150 keV)             : 2.05235e-07 ( -2.80916e-08  2.82751e-08 ) ergs/cm2
Cutoff power-law model

Time interval is from   93.584 sec. to   94.584 sec.
Spectral model in the cutoff power-law:
------------------------------------------------------------
Parameters  : value       lower 90%   higher 90%
Photon index: 1.35407     ( -0.913395   0.444513 )
Epeak [keV] : 147.054      ( -146.965 -146.965 )
Norm@50keV  : 2.84355E-02    (     )
------------------------------------------------------------
#Fit statistic : Chi-Squared =          59.90 using 59 PHA bins.
# Reduced chi-squared =          1.070 for     56 degrees of freedom
# Null hypothesis probability =   3.361131e-01

Photon flux (15-150 keV)    in 1 sec: 2.77599 ( -0.38135  0.37943 ) ph/cm2/s
Energy fluence (15-150 keV)             : 2.03237e-07 ( -2.916e-08  2.8934e-08 ) ergs/cm2
Band function

Time interval is from   93.584 sec. to   94.584 sec.

Spectral model in the Band function:
------------------------------------------------------------
Parameters  : value       lower 90%   higher 90%
alpha       : -1.35107   ( 1.17232   0.760489 )
beta        : -10.0000    ( 10   9.23706e-14 )
Epeak [keV] : 144.144      ( -72.618 -144.348 )
Norm@50keV   : 2.86533E-02    ( -0.00933285   0.046446 )
------------------------------------------------------------
#Fit statistic : Chi-Squared =          59.90 using 59 PHA bins.
# Reduced chi-squared =          1.089 for     55 degrees of freedom
# Null hypothesis probability =   3.024492e-01

Photon flux (15-150 keV)    in 1 sec:  (    ) ph/cm2/s
Energy fluence (15-150 keV)             : 0 ( 0  0 ) ergs/cm2
Single BB

Spectral model blackbody:
------------------------------------------------------------
Parameters  : value    Lower 90%  Upper 90%
kT [keV]    : 16.5008  (-2.41825  2.82796)
R^2/D10^2   : 0.224105  (-0.0962207   0.167936)
(R is the radius in km and D10 is the distance to the source in units of 10 kpc)
------------------------------------------------------------
#Fit statistic : Chi-Squared =          76.22 using 59 PHA bins.
# Reduced chi-squared =          1.337 for     57 degrees of freedom
# Null hypothesis probability =   4.542702e-02

Energy  Fluence     90% Error
[keV]   [erg/cm2]   [erg/cm2]
15- 25  1.252e-08   3.240e-09
25- 50  5.409e-08   1.032e-08
50-150  1.041e-07   2.609e-08
15-150  1.707e-07   2.975e-08
Thermal bremsstrahlung (OTTB)

Spectral model: thermal bremsstrahlung
------------------------------------------------------------
Parameters  : value         Lower 90%    Upper 90%
kT [keV]    : 199.148       (-89.1803      -199.148)
Norm        : 11.3835       (-1.42699     1.71292)
------------------------------------------------------------
#Fit statistic : Chi-Squared =          59.99 using 59 PHA bins.
# Reduced chi-squared =          1.052 for     57 degrees of freedom
# Null hypothesis probability =   3.677951e-01

Energy  Fluence     90% Error
[keV]   [erg/cm2]   [erg/cm2]
15- 25  2.835e-08   1.597e-08
25- 50  5.453e-08   3.008e-08
50-150  1.196e-07   6.595e-08
15-150  2.024e-07   1.113e-07
Double BB

Spectral model: bbodyrad<1> + bbodyrad<2>
------------------------------------------------------------
Parameters  : value         Lower 90%    Upper 90%
kT1 [keV]   : 4.40451        (-1.23153      1.86771)
R1^2/D10^2  : 18.4432        (-11.8017      73.0179)
kT2 [keV]   : 21.5251        (-3.81501      5.71484)
R2^2/D10^2  : 7.75315E-02    (-0.0446514   0.0808731)
------------------------------------------------------------
#Fit statistic : Chi-Squared =          56.48 using 59 PHA bins.
# Reduced chi-squared =          1.027 for     55 degrees of freedom
# Null hypothesis probability =   4.193499e-01

Energy  Fluence     90% Error
[keV]   [erg/cm2]   [erg/cm2]
15- 25  3.296e-08   1.672e-08
25- 50  4.741e-08   1.698e-08
50-150  1.215e-07   4.919e-08
15-150  2.018e-07   6.338e-08
Pre-slew spectrum (Pre-slew PHA with pre-slew DRM)
Power-law model

Spectral model in power-law:
------------------------------------------------------------
Parameters  : value       lower 90%   higher 90%
Photon index: 1.63553     ( -0.057251   0.0573171 )
Norm@50keV  : 3.67300E-03    ( -0.000112598   0.000112583 )
------------------------------------------------------------
#Fit statistic : Chi-Squared =          46.25 using 59 PHA bins.
# Reduced chi-squared =         0.8115 for     57 degrees of freedom
# Null hypothesis probability =   8.447349e-01

Photon flux (15-150 keV)    in 540.9 sec: 0.477340 ( -0.01657  0.0166384 ) ph/cm2/s
Energy fluence (15-150 keV)             : 1.85049e-05 ( -5.85146e-07  5.85741e-07 ) ergs/cm2
Cutoff power-law model

Spectral model in the cutoff power-law:
------------------------------------------------------------
Parameters  : value       lower 90%   higher 90%
Photon index: 1.37981     ( -0.236362   0.224409 )
Epeak [keV] : 131.505      ( -38.4907 433.805 )
Norm@50keV  : 4.82748E-03    ( -0.00100497   0.00134759 )
------------------------------------------------------------
#Fit statistic : Chi-Squared =          42.45 using 59 PHA bins.
# Reduced chi-squared =         0.7581 for     56 degrees of freedom
# Null hypothesis probability =   9.093353e-01

Photon flux (15-150 keV)    in 540.9 sec: 0.468083 ( -0.018235  0.018327 ) ph/cm2/s
Energy fluence (15-150 keV)             : 1.82104e-05 ( -6.46213e-07  6.42535e-07 ) ergs/cm2
Band function

Spectral model in the Band function:
------------------------------------------------------------
Parameters  : value       lower 90%   higher 90%
alpha       : -1.37990   ( -0.304808   4.23651 )
beta        : -2.64746    ( 9.15778   6.4673 )
Epeak [keV] : 131.684      ( -25.3219 156.256 )
Norm@50keV   : 4.82651E-03    ( -0.000729938   0.000917091 )
------------------------------------------------------------
#Fit statistic : Chi-Squared =          42.45 using 59 PHA bins.
# Reduced chi-squared =         0.7718 for     55 degrees of freedom
# Null hypothesis probability =   8.919490e-01

Photon flux (15-150 keV)    in 540.9 sec: 0.467182 (    ) ph/cm2/s
Energy fluence (15-150 keV)             : 1.81858e-05 ( 0  0 ) ergs/cm2
S(25-50 keV) vs. S(50-100 keV) plot

S(25-50 keV)  = 5.22e-06
S(50-100 keV) = 6.61e-06
T90 vs. Hardness ratio plot

T90                                   = 608.407999992371 sec.
Hardness ratio (energy fluence ratio) = 1.26628
Color vs. Color plot

Count Ratio  (25-50 keV) / (15-25 keV) = 1.33326
Count Ratio (50-100 keV) / (15-25 keV) = 0.974371
Mask shadow pattern

IMX = -4.625346132641776E-01, IMY = 7.061034131319260E-01
TIME vs. PHA plot around the trigger time

Blue+Cyan dotted lines: Time interval of the scaled map
From 0.000000 to 16.384000
TIME vs. DetID plot around the trigger time
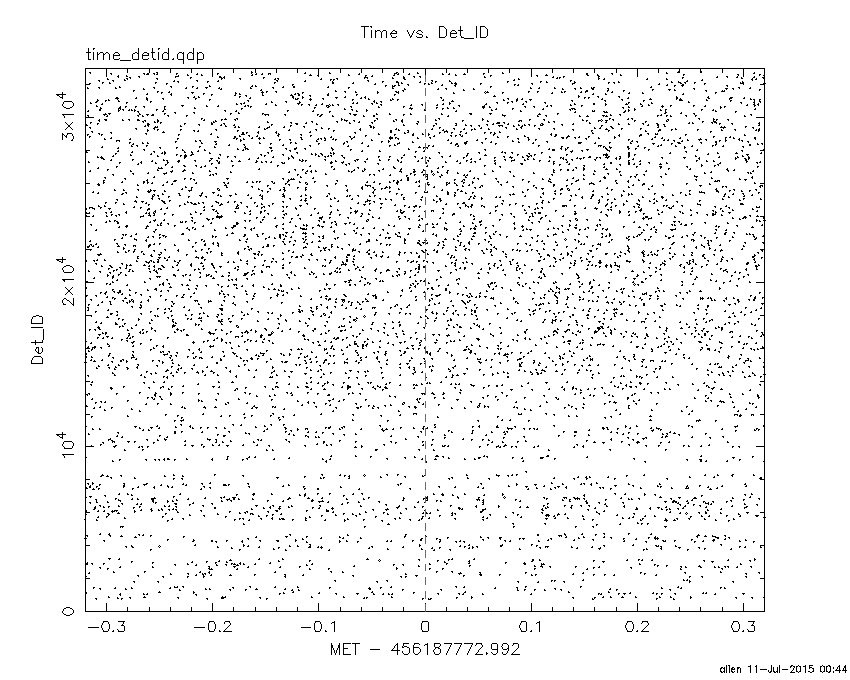
Blue+Cyan dotted lines: Time interval of the scaled map
From 0.000000 to 16.384000
100 us light curve (15-350 keV)

Blue+Cyan dotted lines: Time interval of the scaled map
From 0.000000 to 16.384000
Spacecraft aspect plot

Bright source in the pre-burst/pre-slew/post-slew images
Pre-burst image of 15-350 keV band
Time interval of the image:
-239.992000 -48.140000

# RAcent  DECcent POSerr Theta    Phi  PeakCts   SNR AngSep     Name
#  [deg]    [deg]    ['] [deg]  [deg]                   [']
244.9892 -15.6351    0.4  25.6   45.8   7.1498  27.1    0.6	Sco X-1
256.0070 -37.7787    2.7  10.2  -25.4   0.8279   4.3    4.0	4U 1700-377
256.5355 -36.4489    5.2   9.2  -19.4   0.4302   2.2    5.1	GX 349+2
262.8692 -24.9004   17.1   8.0   76.4  -0.1236  -0.7   12.0	GX 1+4
264.8734 -44.4618   12.3  12.3  -74.3  -0.1795  -0.9    5.6	4U 1735-44
268.3480  -1.4560   88.5  30.9  104.1  -0.0539  -0.1    1.2	SW J1753.5-0127
270.2776 -25.0278    3.0   8.0  126.3   0.7390   3.8    3.1	GX 5-1
270.3491 -25.7625    8.7   7.3  129.1   0.2464   1.3    2.8	GRS 1758-258
274.0059 -14.0781    4.3  19.5  122.9   0.5855   2.7    2.5	GX 17+2
275.9779 -30.3400    6.8   8.4  179.6   0.3091   1.7    3.2	H1820-303
284.9329 -25.1037    0.0  17.7  171.2   0.2203   1.2   12.3	HT1900.1-2455
263.0828 -33.6716    4.4   3.1  -17.0   0.4857   2.6   10.8	GX 354-0
266.6228 -32.2957    1.5   0.2 -158.3   1.3561   7.6 ------	UNKNOWN
333.3019 -21.8767    3.9  59.5 -161.6   5.3957   3.0 ------	UNKNOWN
197.6286 -59.0879    2.7  52.0  -42.2   4.4555   4.3 ------	UNKNOWN
327.8658 -49.9785    2.9  48.0 -129.1   3.3672   4.0 ------	UNKNOWN
Pre-slew background subtracted image of 15-350 keV band
Time interval of the image:
-48.140000 492.808600

# RAcent  DECcent POSerr Theta    Phi  PeakCts   SNR AngSep     Name
#  [deg]    [deg]    ['] [deg]  [deg]                   [']
244.8351 -15.5077    0.0  25.8   45.8   1.5056   2.2   11.5	Sco X-1
255.9467 -37.8610    2.0  10.2  -25.6   3.0215   5.8    2.1	4U 1700-377
256.3516 -36.5770    8.3   9.4  -19.8   0.7319   1.4   10.1	GX 349+2
263.1634 -24.6803    3.3   8.1   78.8   1.7774   3.5    9.3	GX 1+4
264.8304 -44.4040    4.6  12.2  -74.2   1.2812   2.5    4.7	4U 1735-44
268.3557  -1.5320   15.9  30.8  104.1  -0.7263  -0.7    4.8	SW J1753.5-0127
270.3807 -25.1702    9.7   7.9  127.3  -0.5972  -1.2    7.6	GX 5-1
270.2862 -25.7682    9.5   7.3  128.7   0.6475   1.3    1.7	GRS 1758-258
273.8908 -14.1771    5.1  19.3  122.7   1.3297   2.2   10.8	GX 17+2
275.9232 -30.5213   28.9   8.3 -179.3  -0.1927  -0.4    9.3	H1820-303
285.0159 -24.7757    4.4  17.9  170.4   1.2903   2.6    8.8	HT1900.1-2455
263.1406 -33.6644    0.0   3.1  -17.3  -0.7951  -1.6   12.7	GX 354-0
294.9005   7.8434    2.6  48.4  139.5  11.2468   4.3 ------	UNKNOWN
314.7121 -53.4024    0.5  40.2 -123.2  24.9712  24.3 ------	UNKNOWN
Post-slew image of 15-350 keV band
Time interval of the image:
559.808600 962.143200

# RAcent  DECcent POSerr Theta    Phi  PeakCts   SNR AngSep     Name
#  [deg]    [deg]    ['] [deg]  [deg]                   [']
264.7908 -44.5643    9.1  33.2   66.0   0.9979   1.3    7.2	4U 1735-44
275.8686 -30.4894   34.2  36.1   94.8  -0.3474  -0.3    7.9	H1820-303
285.0348 -24.9233   16.0  36.1  111.6   0.6033   0.7    0.2	HT1900.1-2455
308.9706  -3.5032    3.0  50.1  153.8   4.2217   3.9 ------	UNKNOWN
288.0068 -41.4511    3.8  21.4   94.2   1.1431   3.1 ------	UNKNOWN
314.7427 -53.3532    1.6   0.1 -158.0   1.9056   7.2 ------	UNKNOWN
325.9090 -78.1058    3.3  25.0  -24.2   0.8780   3.5 ------	UNKNOWN
347.6895  -1.3851    3.9  58.7 -159.2   5.9282   3.0 ------	UNKNOWN
 21.4701 -48.4924    3.5  40.8  -87.5   4.4423   3.4 ------	UNKNOWN
Plot creation:
Sat Jul 11 00:44:29 EDT 2015