Special notes of this burst
Image
Pre-slew 15.0-350.0 keV image (Event data)

#   RAcent    DECcent   POSerr    Theta     Phi              Peak Cts       SNR   Name
  111.3496   -37.7910   0.0107    43.7989   -28.5522         1.5736167     17.848 TRIG_00646603

Foreground time interval of the image:
 -6.576  16.205 (delta_t =  22.781 [sec])
Background time interval of the image:
-239.296  -6.576 (delta_t = 232.720 [sec])
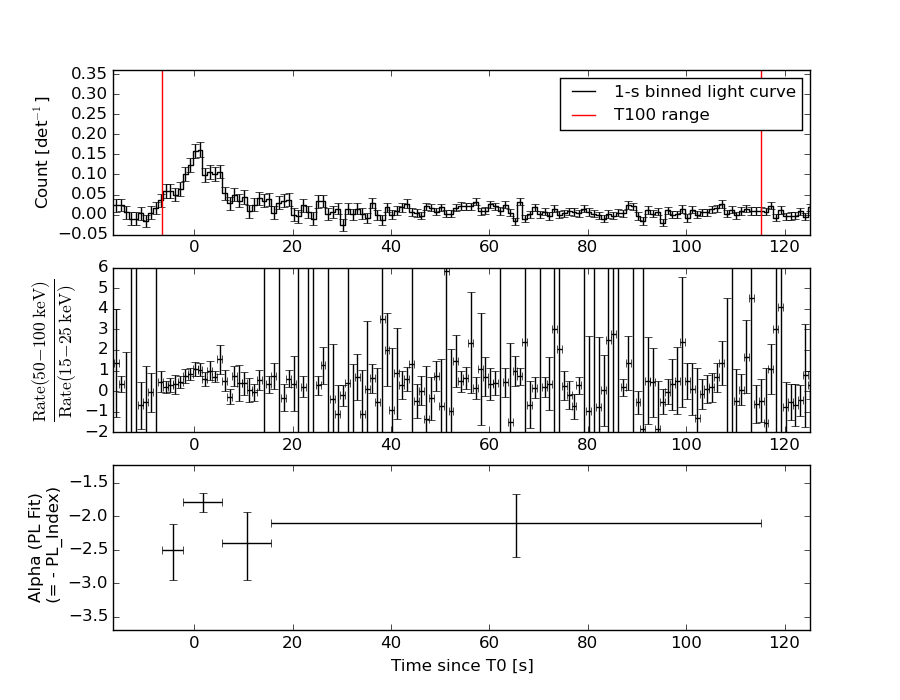
Lightcurves
Notes:
- 1) The mask-weighted light curves are using the flight position.
- 2) Multiple plots of different time binning/intervals are shown to cover all scenarios of short/long GRBs, rate/image triggers, and real/false positives.
- 3) For all the mask-weighted lightcurves, the y-axis units are counts/sec/det where a det is 0.4 x 0.4 = 0.16 sq cm.
- 4) The verticle lines correspond to following: green dotted lines are T50 interval, black dotted lines are T90 interval, blue solid line(s) is a spacecraft slew start time, and orange solid line(s) is a spacecraft slew end time.
- 5) Time of each bin is in the middle of the bin.
1 s binning
From T0-310 s to T0+310 s

From T100_start - 20 s to T100_end + 30 s

Full time interval
64 ms binning
Full time interval

From T100_start to T100_end

From T0-5 sec to T0+5 sec
16 ms binning
From T100_start-5 s to T100_start+5 s

Blue+Cyan dotted lines: Time interval of the scaled map
From 0.000000 to 1.024000
8 ms binning
From T100_start-3 s to T100_start+3 s

Blue+Cyan dotted lines: Time interval of the scaled map
From 0.000000 to 1.024000
2 ms binning
From T100_start-1 s to T100_start+1 s
Blue+Cyan dotted lines: Time interval of the scaled map
From 0.000000 to 1.024000
SN=5 or 10 sec. binning (whichever binning is satisfied first)

SN=5 or 10 sec. binning (T < 200 sec)

Quad-rate summed light curves (from T0-300s to T0+1000s)

Spectral Evolution
Spectra
Notes:
- 1) The fitting includes the systematic errors.
- 2) When the burst includes telescope slew time periods, the fitting uses an average response file made from multiple 5-s response files through out the slew time plus single time preiod for the non-slew times, and weighted by the total counts in the corresponding time period using addrmf. An average response file is needed becuase a spectral fit using the pre-slew DRM will introduce some errors in both a spectral shape and a normalization if the PHA file contains a lot of the slew/post-slew time interval.
- 3) For fits to more complicated models (e.g. a power-law over a cutoff power-law), the BAT team has decided to require a chi-square improvement of more than 6 for each extra dof.
Time averaged spectrum fit using the average DRM
Power-law model

Time interval is from   -6.576 sec. to  115.152 sec.

Spectral model in power-law:
------------------------------------------------------------
Parameters  : value       lower 90%   higher 90%
Photon index: 2.03226     ( -0.175927   0.184774 )
Norm@50keV  : 1.21989E-03    ( -0.000139226   0.000135509 )
------------------------------------------------------------
#Fit statistic : Chi-Squared =          54.60 using 59 PHA bins.
# Reduced chi-squared =         0.9580 for     57 degrees of freedom
# Null hypothesis probability =   5.654623e-01

Photon flux (15-150 keV)    in 121.7 sec: 0.185751 ( -0.0166771  0.0167045 ) ph/cm2/s
Energy fluence (15-150 keV)             : 1.37172e-06 ( -1.436e-07  1.45724e-07 ) ergs/cm2
Cutoff power-law model

Time interval is from   -6.576 sec. to  115.152 sec.
Spectral model in the cutoff power-law:
------------------------------------------------------------
Parameters  : value       lower 90%   higher 90%
Photon index: 2.12302     (     )
Epeak [keV] : 63.2280      (   )
Norm@50keV  : 1.08466E-03    (     )
------------------------------------------------------------
#Fit statistic : Chi-Squared =          54.37 using 59 PHA bins.
# Reduced chi-squared =         0.9710 for     56 degrees of freedom
# Null hypothesis probability =   5.365984e-01

Photon flux (15-150 keV)    in 121.7 sec: 0.185907 (    ) ph/cm2/s
Energy fluence (15-150 keV)             : 1.36656e-06 ( -1.40393e-07  1.48097e-07 ) ergs/cm2
Band function

Time interval is from   -6.576 sec. to  115.152 sec.

Spectral model in the Band function:
------------------------------------------------------------
Parameters  : value       lower 90%   higher 90%
alpha       : -1.61818   ( 1.61818   1.61818 )
beta        : -2.03225    ( -0.185738   0.175742 )
Epeak [keV] : 10.2719      ( -10.2719 -10.2719 )
Norm@50keV   : 3.43690E-03    ( -0.0034369   938.371 )
------------------------------------------------------------
#Fit statistic : Chi-Squared =          54.60 using 59 PHA bins.
# Reduced chi-squared =         0.9928 for     55 degrees of freedom
# Null hypothesis probability =   4.896712e-01

Photon flux (15-150 keV)    in 121.7 sec:  (    ) ph/cm2/s
Energy fluence (15-150 keV)             : 0 ( 0  0 ) ergs/cm2
Single BB

Spectral model blackbody:
------------------------------------------------------------
Parameters  : value    Lower 90%  Upper 90%
kT [keV]    : 9.62447  (-1.30843  1.56548)
R^2/D10^2   : 9.37529E-02  (-0.0408224   0.071924)
(R is the radius in km and D10 is the distance to the source in units of 10 kpc)
------------------------------------------------------------
#Fit statistic : Chi-Squared =         103.22 using 59 PHA bins.
# Reduced chi-squared =         1.8109 for     57 degrees of freedom
# Null hypothesis probability =   1.739101e-04

Energy  Fluence     90% Error
[keV]   [erg/cm2]   [erg/cm2]
15- 25  2.122e-07   3.371e-08
25- 50  4.993e-07   6.237e-08
50-150  2.330e-07   5.945e-08
15-150  9.445e-07   1.165e-07
Thermal bremsstrahlung (OTTB)

Spectral model: thermal bremsstrahlung
------------------------------------------------------------
Parameters  : value         Lower 90%    Upper 90%
kT [keV]    : 69.8220       (-18.3992      29.3285)
Norm        : 0.896375       (-0.131522     0.155305)
------------------------------------------------------------
#Fit statistic : Chi-Squared =          59.96 using 59 PHA bins.
# Reduced chi-squared =          1.052 for     57 degrees of freedom
# Null hypothesis probability =   3.688725e-01

Energy  Fluence     90% Error
[keV]   [erg/cm2]   [erg/cm2]
15- 25  2.798e-07   3.371e-08
25- 50  4.449e-07   4.107e-08
50-150  5.703e-07   1.223e-07
15-150  1.295e-06   1.504e-07
Double BB

Spectral model: bbodyrad<1> + bbodyrad<2>
------------------------------------------------------------
Parameters  : value         Lower 90%    Upper 90%
kT1 [keV]   : 5.16273        (-0.928574      1.04388)
R1^2/D10^2  : 0.861488        (-0.453667      1.17012)
kT2 [keV]   : 21.8608        (-4.52128      7.38233)
R2^2/D10^2  : 3.23138E-03    (-0.0020915   0.0045702)
------------------------------------------------------------
#Fit statistic : Chi-Squared =          52.61 using 59 PHA bins.
# Reduced chi-squared =         0.9566 for     55 degrees of freedom
# Null hypothesis probability =   5.664441e-01

Energy  Fluence     90% Error
[keV]   [erg/cm2]   [erg/cm2]
15- 25  3.242e-07   1.155e-07
25- 50  3.881e-07   1.112e-07
50-150  6.657e-07   3.122e-07
15-150  1.378e-06   4.553e-07
Peak spectrum fit
Power-law model
Time interval is from    0.356 sec. to    1.356 sec.

Spectral model in power-law:
------------------------------------------------------------
Parameters  : value       lower 90%   higher 90%
Photon index: 1.74394     ( -0.252464   0.263818 )
Norm@50keV  : 1.25033E-02    ( -0.00213072   0.0020985 )
------------------------------------------------------------
#Fit statistic : Chi-Squared =          69.17 using 59 PHA bins.
# Reduced chi-squared =          1.213 for     57 degrees of freedom
# Null hypothesis probability =   1.294714e-01

Photon flux (15-150 keV)    in 1 sec: 1.68689 ( -0.271638  0.272166 ) ph/cm2/s
Energy fluence (15-150 keV)             : 1.15415e-07 ( -2.00513e-08  2.02803e-08 ) ergs/cm2
Cutoff power-law model
Time interval is from    0.356 sec. to    1.356 sec.
Spectral model in the cutoff power-law:
------------------------------------------------------------
Parameters  : value       lower 90%   higher 90%
Photon index: 0.452264     ( -1.68157   1.20725 )
Epeak [keV] : 56.3378      ( -12.9597 107.048 )
Norm@50keV  : 6.07955E-02    ( -0.0607961   0.427611 )
------------------------------------------------------------
#Fit statistic : Chi-Squared =          65.82 using 59 PHA bins.
# Reduced chi-squared =          1.175 for     56 degrees of freedom
# Null hypothesis probability =   1.734328e-01

Photon flux (15-150 keV)    in 1 sec: 1.62562 ( -0.27887  0.27904 ) ph/cm2/s
Energy fluence (15-150 keV)             : 1.07426e-07 ( -2.10535e-08  2.1729e-08 ) ergs/cm2
Band function

Time interval is from    0.356 sec. to    1.356 sec.

Spectral model in the Band function:
------------------------------------------------------------
Parameters  : value       lower 90%   higher 90%
alpha       : 0.391095   ( -2.7181   -0.423343 )
beta        : -2.37054    ( 2.37569   0.617176 )
Epeak [keV] : 45.5403      ( -14.5054 60.1577 )
Norm@50keV   : 0.209503    ( -0.24457   101.69 )
------------------------------------------------------------
#Fit statistic : Chi-Squared =          65.39 using 59 PHA bins.
# Reduced chi-squared =          1.189 for     55 degrees of freedom
# Null hypothesis probability =   1.594081e-01

Photon flux (15-150 keV)    in 1 sec: 1.61400 (    ) ph/cm2/s
Energy fluence (15-150 keV)             : 1.09375e-07 ( 0  0 ) ergs/cm2
Single BB
Spectral model blackbody:
------------------------------------------------------------
Parameters  : value    Lower 90%  Upper 90%
kT [keV]    : 12.5316  (-1.94339  2.36418)
R^2/D10^2   : 0.370871  (-0.17755   0.320547)
(R is the radius in km and D10 is the distance to the source in units of 10 kpc)
------------------------------------------------------------
#Fit statistic : Chi-Squared =          69.51 using 59 PHA bins.
# Reduced chi-squared =          1.220 for     57 degrees of freedom
# Null hypothesis probability =   1.235874e-01

Energy  Fluence     90% Error
[keV]   [erg/cm2]   [erg/cm2]
15- 25  1.235e-08   3.385e-09
25- 50  4.085e-08   9.220e-09
50-150  3.966e-08   1.351e-08
15-150  9.286e-08   2.257e-08
Thermal bremsstrahlung (OTTB)

Spectral model: thermal bremsstrahlung
------------------------------------------------------------
Parameters  : value         Lower 90%    Upper 90%
kT [keV]    : 111.030       (-44.2947      -110.921)
Norm        : 7.41276       (-1.29263     1.78184)
------------------------------------------------------------
#Fit statistic : Chi-Squared =          67.01 using 59 PHA bins.
# Reduced chi-squared =          1.176 for     57 degrees of freedom
# Null hypothesis probability =   1.711336e-01

Energy  Fluence     90% Error
[keV]   [erg/cm2]   [erg/cm2]
15- 25  1.936e-08   4.250e-09
25- 50  3.415e-08   7.895e-09
50-150  5.858e-08   3.435e-08
15-150  1.121e-07   4.542e-08
Double BB
------------------------------------------------------------
Parameters  : value         Lower 90%    Upper 90%
kT1 [keV]   : 8.86587        (      )
R1^2/D10^2  : 0.904468        (-0.562503      -0.894783)
kT2 [keV]   : 23.7803        (-24.0763      -24.7375)
R2^2/D10^2  : 1.86365E-02    (-0.0153868   0.34479)
------------------------------------------------------------
#Fit statistic : Chi-Squared =          66.83 using 59 PHA bins.
#Fit statistic : Chi-Squared =          65.48 using 59 PHA bins.
# Reduced chi-squared =          1.215 for     55 degrees of freedom
# Reduced chi-squared =          1.191 for     55 degrees of freedom
# Null hypothesis probability =   1.316882e-01
# Null hypothesis probability =   1.574272e-01

Energy  Fluence     90% Error
[keV]   [erg/cm2]   [erg/cm2]
15- 25  1.563e-08   5.277e-09
25- 50  3.773e-08   1.325e-08
50-150  4.392e-08   1.668e-08
15-150  9.728e-08   2.333e-08
Pre-slew spectrum (Pre-slew PHA with pre-slew DRM)
Power-law model

Spectral model in power-law:
------------------------------------------------------------
Parameters  : value       lower 90%   higher 90%
Photon index: 2.02999     ( -0.149927   0.156213 )
Norm@50keV  : 4.59190E-03    ( -0.000450279   0.000441996 )
------------------------------------------------------------
#Fit statistic : Chi-Squared =          40.60 using 59 PHA bins.
# Reduced chi-squared =         0.7124 for     57 degrees of freedom
# Null hypothesis probability =   9.504963e-01

Photon flux (15-150 keV)    in 22.78 sec: 0.698459 ( -0.0574448  0.0575186 ) ph/cm2/s
Energy fluence (15-150 keV)             : 9.66359e-07 ( -8.82784e-08  8.91621e-08 ) ergs/cm2
Cutoff power-law model
Spectral model in the cutoff power-law:
------------------------------------------------------------
Parameters  : value       lower 90%   higher 90%
Photon index: 1.71350     ( -0.65966   0.423072 )
Epeak [keV] : 40.1565      ( -32.8084 -40.1565 )
Norm@50keV  : 6.87696E-03    ( -0.00351599   0.00895995 )
------------------------------------------------------------
#Fit statistic : Chi-Squared =          39.75 using 59 PHA bins.
# Reduced chi-squared =         0.7098 for     56 degrees of freedom
# Null hypothesis probability =   9.506626e-01

Photon flux (15-150 keV)    in 22.78 sec: 0.688786 ( -0.060072  0.060006 ) ph/cm2/s
Energy fluence (15-150 keV)             : 9.41304e-07 ( -9.95782e-08  1.00136e-07 ) ergs/cm2
Band function

Spectral model in the Band function:
------------------------------------------------------------
Parameters  : value       lower 90%   higher 90%
alpha       : -1.43616   ( 1.43444   1.43444 )
beta        : -2.21648    ( 2.21448   0.301048 )
Epeak [keV] : 35.8596      ( -35.6267 28.5237 )
Norm@50keV   : 1.04625E-02    ( -0.006356   939.419 )
------------------------------------------------------------
#Fit statistic : Chi-Squared =          39.52 using 59 PHA bins.
# Reduced chi-squared =         0.7185 for     55 degrees of freedom
# Null hypothesis probability =   9.426687e-01

Photon flux (15-150 keV)    in 22.78 sec:  (    ) ph/cm2/s
Energy fluence (15-150 keV)             : 9.44288e-07 ( 0  0 ) ergs/cm2
S(25-50 keV) vs. S(50-100 keV) plot

S(25-50 keV)  = 4.17e-07
S(50-100 keV) = 4.08e-07
T90 vs. Hardness ratio plot

T90                                   = 97.2640000581741 sec.
Hardness ratio (energy fluence ratio) = 0.978417
Color vs. Color plot

Count Ratio  (25-50 keV) / (15-25 keV) = 0.980515
Count Ratio (50-100 keV) / (15-25 keV) = 0.66851
Mask shadow pattern

IMX = 8.423049718904094E-01, IMY = 4.583284421965760E-01
TIME vs. PHA plot around the trigger time
Blue+Cyan dotted lines: Time interval of the scaled map
From 0.000000 to 1.024000
TIME vs. DetID plot around the trigger time

Blue+Cyan dotted lines: Time interval of the scaled map
From 0.000000 to 1.024000
100 us light curve (15-350 keV)

Blue+Cyan dotted lines: Time interval of the scaled map
From 0.000000 to 1.024000
Spacecraft aspect plot

Bright source in the pre-burst/pre-slew/post-slew images
Pre-burst image of 15-350 keV band
Time interval of the image:
-239.296000 -6.576000

# RAcent  DECcent POSerr Theta    Phi  PeakCts   SNR AngSep     Name
#  [deg]    [deg]    ['] [deg]  [deg]                   [']
135.6020 -40.6231   31.9  55.7   -9.1   0.2254   0.4    5.3	Vela X-1
259.3158 -85.6548    3.0  40.1   60.4   2.2714   3.9 ------	UNKNOWN
148.1251 -67.7949    3.3  44.2   24.7   1.2538   3.5 ------	UNKNOWN
124.8088 -51.8821    3.4  42.8   -3.8   0.9851   3.4 ------	UNKNOWN
 19.0002 -15.0668    3.1  45.9 -167.5   1.2683   3.8 ------	UNKNOWN
 14.6072  -2.8481    2.6  58.8 -166.0   5.2494   4.5 ------	UNKNOWN
Pre-slew background subtracted image of 15-350 keV band
Time interval of the image:
-6.576000 16.204600

# RAcent  DECcent POSerr Theta    Phi  PeakCts   SNR AngSep     Name
#  [deg]    [deg]    ['] [deg]  [deg]                   [']
135.5681 -40.6096    6.2  55.7   -9.1   0.3071   1.9    3.8	Vela X-1
111.3496 -37.7910    0.6  43.8  -28.6   1.5739  17.9 ------	UNKNOWN
Post-slew image of 15-350 keV band
Time interval of the image:
77.004590 962.784000

# RAcent  DECcent POSerr Theta    Phi  PeakCts   SNR AngSep     Name
#  [deg]    [deg]    ['] [deg]  [deg]                   [']
135.5275 -40.5500    0.7  18.9   33.5   7.7707  15.8    0.3	Vela X-1
143.4726 -20.6725    2.6  32.6   -5.1   2.6881   4.4 ------	UNKNOWN
 87.9874 -16.0686    3.2  29.9 -122.4   2.5842   3.7 ------	UNKNOWN
 53.0791 -17.7811    2.5  54.3 -157.9   8.7151   4.6 ------	UNKNOWN
 65.9822 -14.7118    3.6  46.2 -145.2   3.7976   3.2 ------	UNKNOWN
 78.9722  -3.4172    3.0  45.3 -121.3   9.5498   3.9 ------	UNKNOWN
Plot creation:
Sat Jul 11 00:45:55 EDT 2015