Click here for the BAT GCN circular template
Image
Pre-slew 15-350 keV image (Event data; bkg subtracted)

#   RAcent  DECcent POSerr  Theta    Phi     Peak Cts     SNR  Name
  306.0193 +33.8633 0.0021    0.0  125.1     571.3545    90.5  TRIG_00646721
------------------------------------------

Foreground time interval of the image:
 -1.424   7.581 (delta_t =   9.005 [sec])
163.544 362.592 (delta_t = 199.048 [sec])
368.544 602.589 (delta_t = 234.045 [sec])
644.544 722.744 (delta_t =  78.200 [sec])
Background time interval of the image:
 -2.456  -1.424 (delta_t =   1.032 [sec])
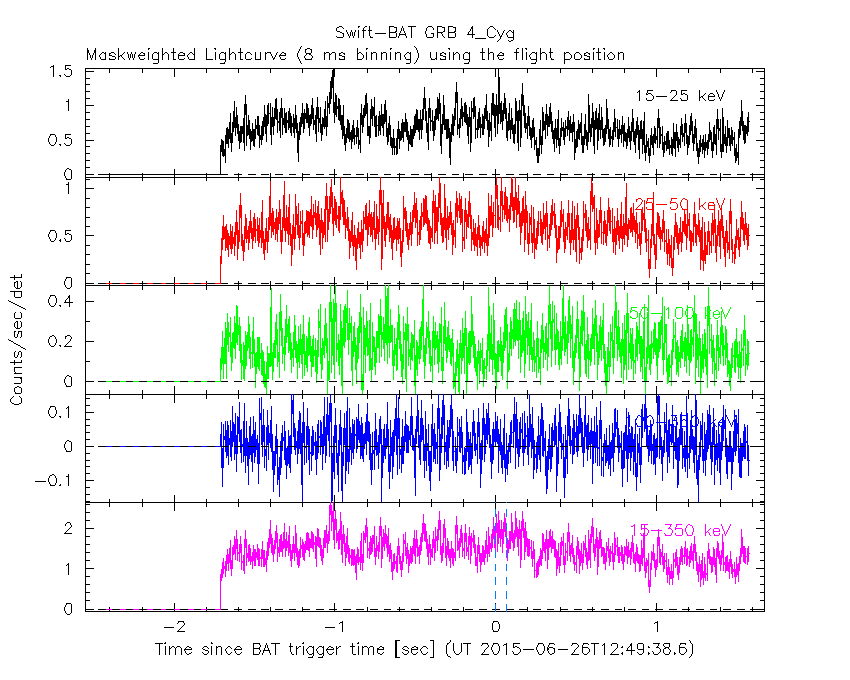
Lightcurves
Notes:
- 1) All plots contain as much data as has been downloaded to date.
- 2) The mask-weighted light curves are using the flight position.
- 3) Multiple plots of different time binning/intervals are shown to cover all scenarios of short/long GRBs, rate/image triggers, and real/false positives.
- 4) For all the mask-weighted lightcurves, the y-axis units are counts/sec/det where a det is 0.4 x 0.4 = 0.16 sq cm.
- 5) The verticle lines correspond to following: green dotted lines are T50 interval, black dotted lines are T90 interval, blue solid line(s) is a spacecraft slew start time, and orange solid line(s) is a spacecraft slew end time.
- 6) Time of each bin is in the middle of the bin.
1 s binning
From T0-310 s to T0+310 s

From T100_start - 20 s to T100_end + 30 s

Full time interval

64 ms binning
Full time interval

From T100_start to T100_end

From T0-5 sec to T0+5 sec

16 ms binning
From T100_start-5 s to T100_start+5 s

Blue+Cyan dotted lines: Time interval of the scaled map
From 0.000000 to 0.064000
8 ms binning
From T100_start-3 s to T100_start+3 s
Blue+Cyan dotted lines: Time interval of the scaled map
From 0.000000 to 0.064000
2 ms binning
From T100_start-1 s to T100_start+1 s

Blue+Cyan dotted lines: Time interval of the scaled map
From 0.000000 to 0.064000
SN=5 or 10 sec. binning (whichever binning is satisfied first)

SN=5 or 10 sec. binning (T < 200 sec)

Spectra
Notes:
- 1) The fitting includes the systematic errors.
- 2) For long bursts, a spectral fit of the pre-slew DRM will introduce some errors in both a spectral shape and a normalization if the PHA file contains a lot of the slew/post-slew time interval.
- 3) For fits to more complicated models (e.g. a power-law over a cutoff power-law), the BAT team has decided to require a chi-square improvement of more than 6 for each extra dof.
- 4) For short bursts (T90<1sec), the specrtum is also fit with Blackbody, OTTB, and Double Blackbody.
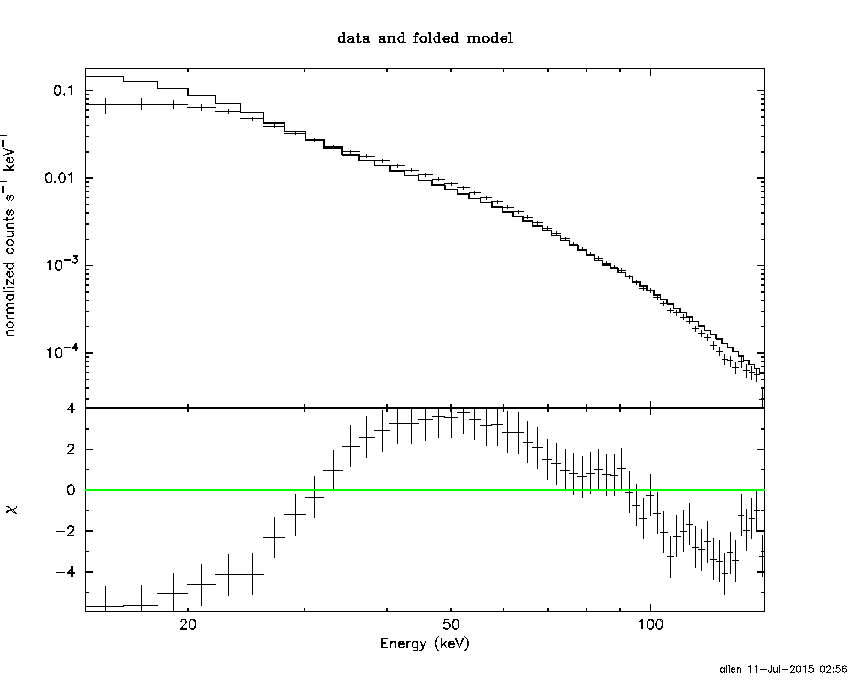
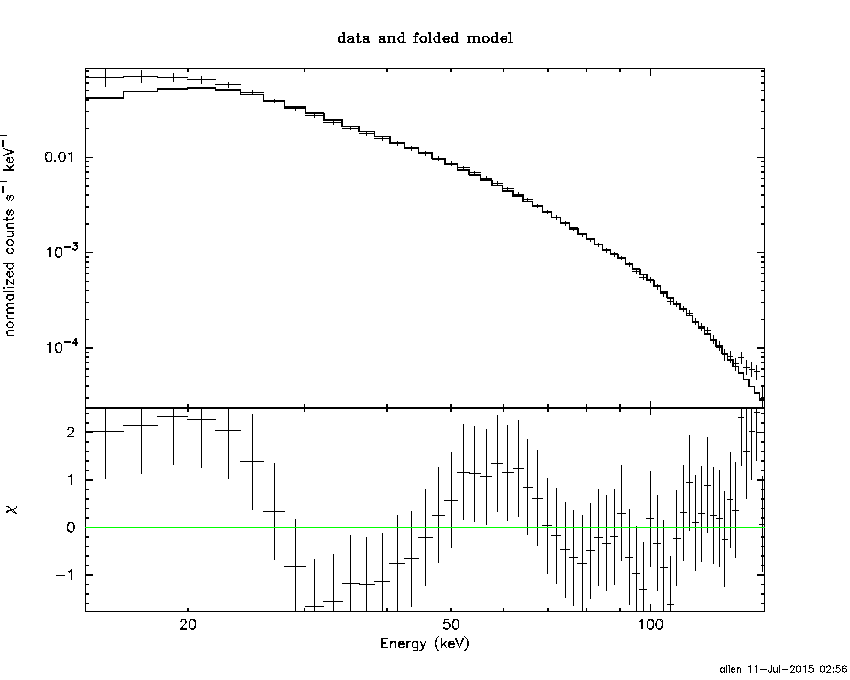
Time averaged spectrum fit using the pre-slew DRM
Power-law model
Multiple GTIs in the spectrum
tstart tstop
-1.424000 7.580900
163.544000 362.591800
368.544000 602.588800
644.544000 722.744000
780.544000 868.380000

Spectral model in power-law:
------------------------------------------------------------
Parameters  : value       lower 90%   higher 90%
Photon index: 3.10386     (     )
Norm@50keV  : 4.88067E-02    (     )
------------------------------------------------------------
#Fit statistic : Chi-Squared =         447.40 using 59 PHA bins.
# Reduced chi-squared =         7.8492 for     57 degrees of freedom
# Null hypothesis probability =   5.774730e-62

Photon flux (15-150 keV)    in 608.1 sec: 14.4904 (    ) ph/cm2/s
Energy fluence (15-150 keV)             : 0.000374731 ( 0  0 ) ergs/cm2
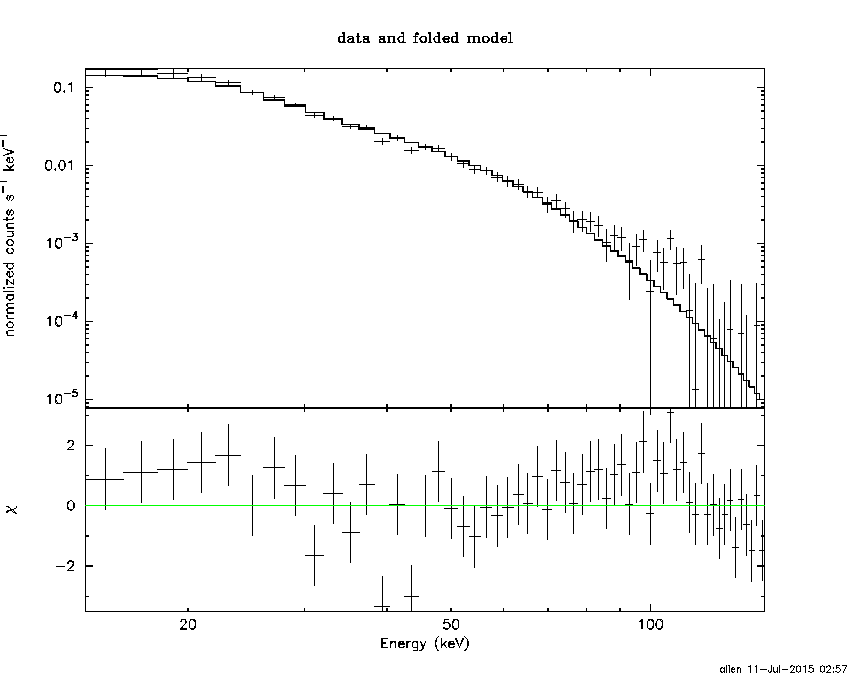
Cutoff power-law model

Multiple GTIs in the spectrum
tstart tstop
-1.424000 7.580900
163.544000 362.591800
368.544000 602.588800
644.544000 722.744000
780.544000 868.380000
Spectral model in the cutoff power-law:
------------------------------------------------------------
Parameters  : value       lower 90%   higher 90%
Photon index: 1.97608     (     )
Epeak [keV] : 1.26813      ( -0.365208 1.41497 )
Norm@50keV  : 0.145548    ( -0.00463654   0.00403595 )
------------------------------------------------------------
#Fit statistic : Chi-Squared =          48.81 using 59 PHA bins.
# Reduced chi-squared =         0.8716 for     56 degrees of freedom
# Null hypothesis probability =   7.412420e-01

Photon flux (15-150 keV)    in 608.1 sec: 11.9313 ( -0.3347  0.3391 ) ph/cm2/s
Energy fluence (15-150 keV)             : 0.000334482 ( -6.72923e-06  6.79004e-06 ) ergs/cm2
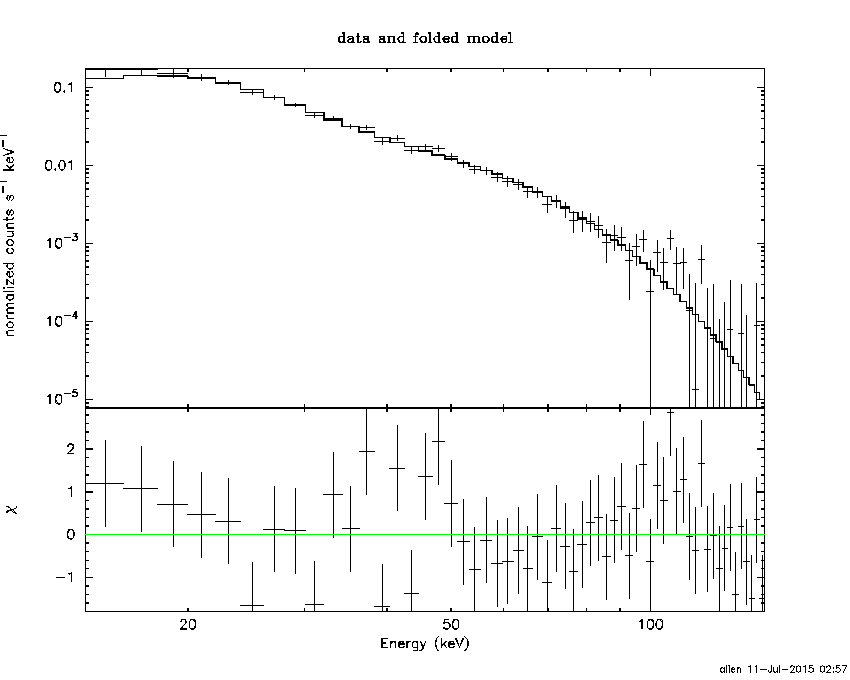
Band function

Multiple GTIs in the spectrum
tstart tstop
-1.424000 7.580900
163.544000 362.591800
368.544000 602.588800
644.544000 722.744000
780.544000 868.380000

Spectral model in the Band function:
------------------------------------------------------------
Parameters  : value       lower 90%   higher 90%
alpha       : -1.55600   (     )
beta        : -9.27202    (     )
Epeak [keV] : 19.8344      (   )
Norm@50keV   : 0.166301    (     )
------------------------------------------------------------
#Fit statistic : Chi-Squared =         305.81 using 59 PHA bins.
# Reduced chi-squared =         5.5602 for     55 degrees of freedom
# Null hypothesis probability =   1.752323e-36

Photon flux (15-150 keV)    in 608.1 sec:  (    ) ph/cm2/s
Energy fluence (15-150 keV)             : 0 ( 0  0 ) ergs/cm2
Single BB
Spectral model blackbody:
------------------------------------------------------------
Parameters  : value    Lower 90%  Upper 90%
kT [keV]    : 12.5639  (  )
R^2/D10^2   : 1.28137  (   )
(R is the radius in km and D10 is the distance to the source in units of 10 kpc)
------------------------------------------------------------
#Fit statistic : Chi-Squared =        2499.47 using 59 PHA bins.
# Reduced chi-squared =        43.8503 for     57 degrees of freedom
# Null hypothesis probability =   0.000000e+00

Energy  Fluence     90% Error
[keV]   [erg/cm2]   [erg/cm2]
15- 25  2.608e-05   7.480e-07
25- 50  8.652e-05   1.824e-06
50-150  8.458e-05   1.034e-06
15-150  1.972e-04   2.858e-06
Thermal bremsstrahlung (OTTB)
Spectral model: thermal bremsstrahlung
------------------------------------------------------------
Parameters  : value         Lower 90%    Upper 90%
kT [keV]    : 35.9154       (      )
Norm        : 71.5412       (     )
------------------------------------------------------------
#Fit statistic : Chi-Squared =         200.62 using 59 PHA bins.
# Reduced chi-squared =         3.5197 for     57 degrees of freedom
# Null hypothesis probability =   7.091571e-18

Energy  Fluence     90% Error
[keV]   [erg/cm2]   [erg/cm2]
15- 25  9.604e-05   2.159e-06
25- 50  1.203e-04   2.037e-06
50-150  8.240e-05   9.426e-07
15-150  2.988e-04   4.257e-06
Double BB
Spectral model: bbodyrad<1> + bbodyrad<2>
------------------------------------------------------------
Parameters  : value         Lower 90%    Upper 90%
kT1 [keV]   : 6.87527        (-0.18936      0.190604)
R1^2/D10^2  : 17.9911        (-2.1023      2.44866)
kT2 [keV]   : 18.3762        (-0.468886      0.506)
R2^2/D10^2  : 0.129790    (-0.0186468   0.0208333)
------------------------------------------------------------
#Fit statistic : Chi-Squared =          74.94 using 59 PHA bins.
# Reduced chi-squared =          1.363 for     55 degrees of freedom
# Null hypothesis probability =   3.816446e-02

Energy  Fluence     90% Error
[keV]   [erg/cm2]   [erg/cm2]
15- 25  8.681e-05   3.801e-06
25- 50  1.327e-04   2.463e-06
50-150  7.805e-05   1.064e-06
15-150  2.975e-04   5.260e-06
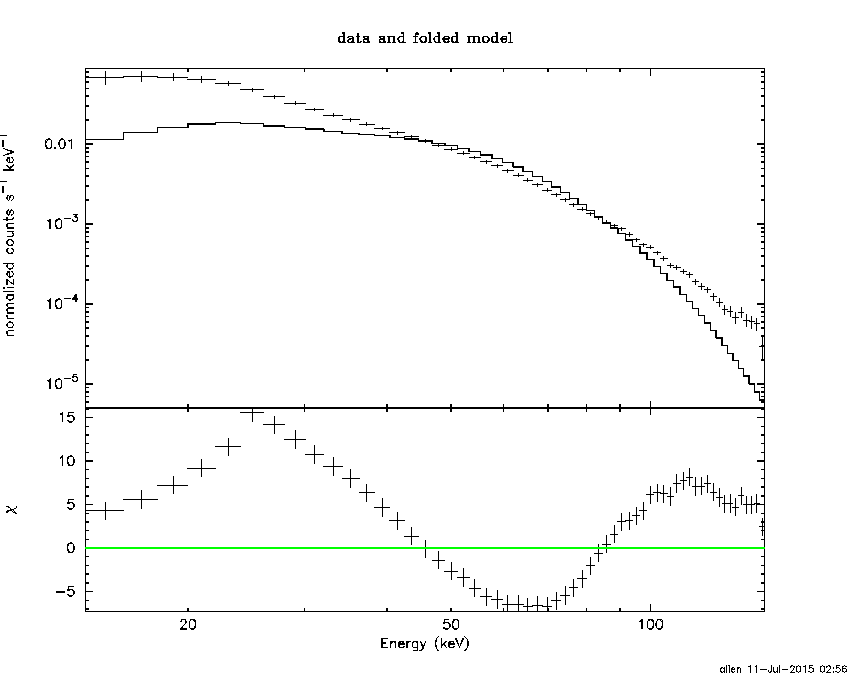
Peak spectrum fit
Power-law model

Time interval is from  533.248 sec. to  534.248 sec.

Spectral model in power-law:
------------------------------------------------------------
Parameters  : value       lower 90%   higher 90%
Photon index: 3.12532     ( -0.0586508   0.0594136 )
Norm@50keV  : 7.89489E-02    ( -0.0026174   0.00260397 )
------------------------------------------------------------
#Fit statistic : Chi-Squared =          75.59 using 59 PHA bins.
# Reduced chi-squared =          1.326 for     57 degrees of freedom
# Null hypothesis probability =   5.029394e-02

Photon flux (15-150 keV)    in 1 sec: 23.8186 ( -0.835707  0.845208 ) ph/cm2/s
Energy fluence (15-150 keV)             : 1.00752e-06 ( -2.77306e-08  2.78083e-08 ) ergs/cm2
Cutoff power-law model

Time interval is from  533.248 sec. to  534.248 sec.
Spectral model in the cutoff power-law:
------------------------------------------------------------
Parameters  : value       lower 90%   higher 90%
Photon index: 1.97752     (     )
Epeak [keV] : 0.827478      ( -0.215647 3.30585 )
Norm@50keV  : 0.335581    ( -0.0243479   0.0228195 )
------------------------------------------------------------
#Fit statistic : Chi-Squared =          56.74 using 59 PHA bins.
# Reduced chi-squared =          1.013 for     56 degrees of freedom
# Null hypothesis probability =   4.473346e-01

Photon flux (15-150 keV)    in 1 sec: 22.1103 ( -0.9954  1.0085 ) ph/cm2/s
Energy fluence (15-150 keV)             : 9.46068e-07 ( -3.4198e-08  3.4419e-08 ) ergs/cm2
Band function

Time interval is from  533.248 sec. to  534.248 sec.

Spectral model in the Band function:
------------------------------------------------------------
Parameters  : value       lower 90%   higher 90%
alpha       : -1.98848   ( -0.0250852   0.0257335 )
beta        : -3.52185    ( -0.30808   0.188443 )
Epeak [keV] : 0.391223      ( -0.0342914 0.0366775 )
Norm@50keV   : 0.359633    ( -0.00931906   0.00931907 )
------------------------------------------------------------
#Fit statistic : Chi-Squared =          51.40 using 59 PHA bins.
# Reduced chi-squared =         0.9345 for     55 degrees of freedom
# Null hypothesis probability =   6.130852e-01

Photon flux (15-150 keV)    in 1 sec:  (    ) ph/cm2/s
Energy fluence (15-150 keV)             : 0 ( 0  0 ) ergs/cm2
Single BB

Spectral model blackbody:
------------------------------------------------------------
Parameters  : value    Lower 90%  Upper 90%
kT [keV]    : 7.73899  (  )
R^2/D10^2   : 21.8697  (   )
(R is the radius in km and D10 is the distance to the source in units of 10 kpc)
------------------------------------------------------------
#Fit statistic : Chi-Squared =         310.75 using 59 PHA bins.
# Reduced chi-squared =         5.4518 for     57 degrees of freedom
# Null hypothesis probability =   1.284843e-36

Energy  Fluence     90% Error
[keV]   [erg/cm2]   [erg/cm2]
15- 25  2.308e-07   1.220e-08
25- 50  3.811e-07   1.030e-08
50-150  8.961e-08   6.310e-09
15-150  7.015e-07   2.025e-08
Thermal bremsstrahlung (OTTB)
Spectral model: thermal bremsstrahlung
------------------------------------------------------------
Parameters  : value         Lower 90%    Upper 90%
kT [keV]    : 24.4157       (-1.15604      1.22919)
Norm        : 198.247       (-14.371     15.619)
------------------------------------------------------------
#Fit statistic : Chi-Squared =          79.82 using 59 PHA bins.
# Reduced chi-squared =          1.400 for     57 degrees of freedom
# Null hypothesis probability =   2.469873e-02

Energy  Fluence     90% Error
[keV]   [erg/cm2]   [erg/cm2]
15- 25  3.575e-07   1.535e-08
25- 50  3.608e-07   9.700e-09
50-150  1.482e-07   9.900e-09
15-150  8.664e-07   2.125e-08
Double BB
Spectral model: bbodyrad<1> + bbodyrad<2>
------------------------------------------------------------
Parameters  : value         Lower 90%    Upper 90%
kT1 [keV]   : 4.83666        (-0.407551      0.414856)
R1^2/D10^2  : 158.722        (-49.3652      81.851)
kT2 [keV]   : 13.2028        (-1.18704      1.46051)
R2^2/D10^2  : 1.11948    (-0.473369   0.733322)
------------------------------------------------------------
#Fit statistic : Chi-Squared =          60.70 using 59 PHA bins.
# Reduced chi-squared =          1.104 for     55 degrees of freedom
# Null hypothesis probability =   2.779437e-01

Energy  Fluence     90% Error
[keV]   [erg/cm2]   [erg/cm2]
15- 25  3.787e-07   3.240e-08
25- 50  3.477e-07   2.315e-08
50-150  1.681e-07   1.745e-08
15-150  8.945e-07   5.915e-08
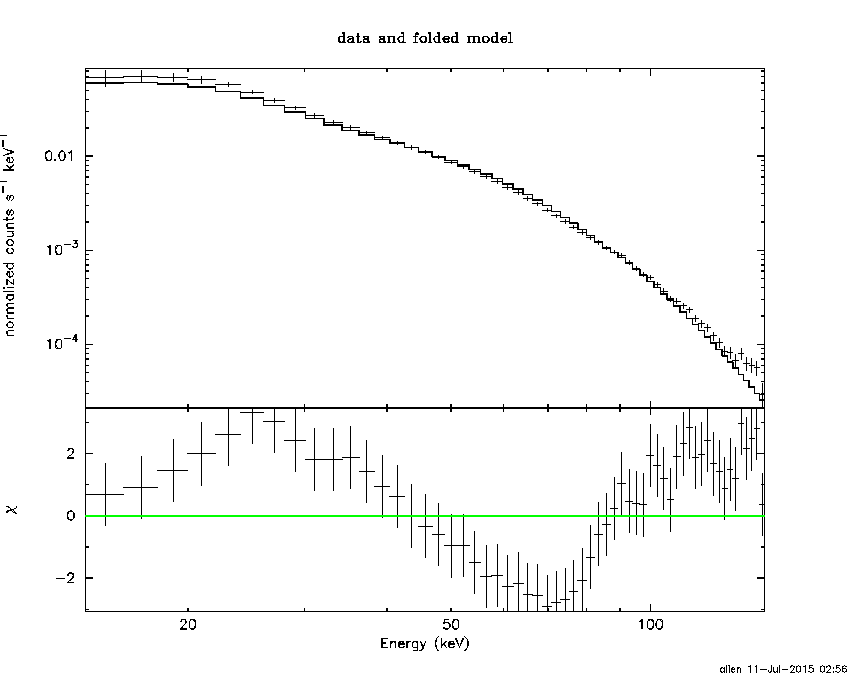
Pre-slew spectrum (Pre-slew PHA with pre-slew DRM)
Power-law model

Spectral model in power-law:
------------------------------------------------------------
Parameters  : value       lower 90%   higher 90%
Photon index: 3.13176     (     )
Norm@50keV  : 5.36548E-02    (     )
------------------------------------------------------------
#Fit statistic : Chi-Squared =         458.30 using 59 PHA bins.
# Reduced chi-squared =         8.0404 for     57 degrees of freedom
# Null hypothesis probability =   4.794034e-64

Photon flux (15-150 keV)    in 520.3 sec: 16.2664 (    ) ph/cm2/s
Energy fluence (15-150 keV)             : 0.000357423 ( 0  0 ) ergs/cm2
Cutoff power-law model

Spectral model in the cutoff power-law:
------------------------------------------------------------
Parameters  : value       lower 90%   higher 90%
Photon index: 1.97380     (     )
Epeak [keV] : 1.36222      ( -0.473635 1.09288 )
Norm@50keV  : 0.163609    ( -0.00534063   0.00462398 )
------------------------------------------------------------
#Fit statistic : Chi-Squared =          55.51 using 59 PHA bins.
# Reduced chi-squared =         0.9913 for     56 degrees of freedom
# Null hypothesis probability =   4.932036e-01

Photon flux (15-150 keV)    in 520.3 sec: 13.3679 ( -0.375  0.3799 ) ph/cm2/s
Energy fluence (15-150 keV)             : 0.000318523 ( -6.44027e-06  6.49386e-06 ) ergs/cm2
Band function

Spectral model in the Band function:
------------------------------------------------------------
Parameters  : value       lower 90%   higher 90%
alpha       : -1.54491   (     )
beta        : -9.18504    (     )
Epeak [keV] : 20.2623      (   )
Norm@50keV   : 0.181412    (     )
------------------------------------------------------------
#Fit statistic : Chi-Squared =         377.80 using 59 PHA bins.
# Reduced chi-squared =         6.8692 for     55 degrees of freedom
# Null hypothesis probability =   1.064630e-49

Photon flux (15-150 keV)    in 520.3 sec:  (    ) ph/cm2/s
Energy fluence (15-150 keV)             : 0 ( 0  0 ) ergs/cm2
S(25-50 keV) vs. S(50-100 keV) plot

S(25-50 keV)  = 1.24e-04
S(50-100 keV) = 5.76e-05
T90 vs. Hardness ratio plot

T90                                   = 503.575999975204 sec.
Hardness ratio (energy fluence ratio) = 0.464516
Color vs. Color plot

Count Ratio  (25-50 keV) / (15-25 keV) = 0.799629
Count Ratio (50-100 keV) / (15-25 keV) = 0.218818
Mask shadow pattern

IMX = -9.998916046811751E-05, IMY = -1.425195088651695E-04
TIME vs. PHA plot around the trigger time

Blue+Cyan dotted lines: Time interval of the scaled map
From 0.000000 to 0.064000
TIME vs. DetID plot around the trigger time

Blue+Cyan dotted lines: Time interval of the scaled map
From 0.000000 to 0.064000
100 us light curve (15-350 keV)

Blue+Cyan dotted lines: Time interval of the scaled map
From 0.000000 to 0.064000
Spacecraft aspect plot

Bright source in the pre-burst/pre-slew/post-slew images
Pre-burst image of 15-350 keV band
Time interval of the image:
-2.456000 -1.424000

# RAcent  DECcent POSerr Theta    Phi  PeakCts   SNR AngSep     Name
#  [deg]    [deg]    ['] [deg]  [deg]                   [']
254.4902  35.4547    8.6  41.9  165.5  -0.0257  -1.3    6.9	Her X-1
288.7018  10.9256    4.0  27.9   96.9  -0.0452  -2.9    5.8	GRS 1915+105
299.4652  35.3288    6.3   5.6  165.2   0.0173   1.8    9.8	Cyg X-1
308.2436  41.0660   16.0   7.4 -108.8   0.0067   0.7    9.1	Cyg X-3
326.1831  38.3030   16.3  16.8  -52.9  -0.0073  -0.7    1.2	Cyg X-2
291.5905  -3.8041    2.9  40.1   80.9   0.1589   4.0 ------	UNKNOWN
306.0040  33.8526    0.3   0.0  113.9   0.3794  37.5 ------	UNKNOWN
346.2343   5.7199    2.3  46.6   -3.9   0.0853   5.0 ------	UNKNOWN
  0.4379  41.0501    2.4  43.1  -57.9   0.1530   4.8 ------	UNKNOWN
Pre-slew background subtracted image of 15-350 keV band
Time interval of the image:
-1.424000 7.580900
163.544000 362.591800
368.544000 602.588800
644.544000 722.744000

# RAcent  DECcent POSerr Theta    Phi  PeakCts   SNR AngSep     Name
#  [deg]    [deg]    ['] [deg]  [deg]                   [']
254.4680  35.4565   18.8  42.0  165.6  -7.1866  -0.6    6.9	Her X-1
288.8223  10.9210    4.2  27.8   96.7  26.5293   2.7    2.0	GRS 1915+105
299.3820  35.1234    5.7   5.6  163.0  12.8958   2.0   11.2	Cyg X-1
307.9243  41.0100    9.1   7.3 -110.5  -7.5171  -1.3    9.1	Cyg X-3
326.0259  38.2272   11.3  16.7  -52.7   6.2408   1.0    8.9	Cyg X-2
306.0193  33.8633    0.1   0.0  125.0 571.3591  90.5 ------	UNKNOWN
290.5652  47.1736    2.2  17.7 -158.4  32.0783   5.2 ------	UNKNOWN
358.9209   7.7765    2.7  55.1  -16.2  85.1515   4.2  471.0	UNKNOWN
Post-slew image of 15-350 keV band
Time interval of the image:
915.444600 928.644590

# RAcent  DECcent POSerr Theta    Phi  PeakCts   SNR AngSep     Name
#  [deg]    [deg]    ['] [deg]  [deg]                   [']
245.0081 -15.6711    0.6  32.1   31.1   1.0040  19.0    2.5	Sco X-1
256.0698 -37.9483    5.7  12.8  -12.6   0.0823   2.0    7.4	4U 1700-377
256.6562 -36.3128    0.0  12.4   -4.9   0.0507   1.3   12.5	GX 349+2
263.1944 -24.6168    0.0  14.5   52.6  -0.0870  -2.1   12.7	GX 1+4
264.7340 -44.4442  125.3   9.4  -58.8  -0.0036  -0.1    0.5	4U 1735-44
268.4948  -1.4246   12.0  35.7   80.6   0.1001   1.0    7.8	SW J1753.5-0127
270.2765 -25.1238    3.9  11.9   78.8   0.1157   3.0    2.7	GX 5-1
270.2331 -25.8890    3.2  11.2   78.1   0.1354   3.5    9.5	GRS 1758-258
273.9219 -14.1256    3.2  22.9   91.4   0.1958   3.6    7.2	GX 17+2
275.7630 -30.5138    6.1   7.1  113.2   0.0695   1.9   12.2	H1820-303
285.1763 -25.0625   15.0  16.3  133.7   0.0318   0.8   11.4	HT1900.1-2455
263.1414 -33.8589    7.8   7.9   17.0  -0.0562  -1.5    7.7	GX 354-0
223.0170 -13.0522    2.0  49.8   12.2   0.6372   5.8 ------	UNKNOWN
293.1465 -73.6446    2.6  38.1 -102.6   0.4720   4.5 ------	UNKNOWN
Plot creation:
Sat Jul 11 02:57:57 EDT 2015