Special notes of this burst
Image
Pre-slew 15.0-350.0 keV image (Event data)
#   RAcent    DECcent   POSerr    Theta     Phi              Peak Cts       SNR   Name
  187.6230    66.7960   0.0161    44.4767     8.5100         1.6144993     11.911 TRIG_00646786

Foreground time interval of the image:
-15.560  32.440 (delta_t =  48.000 [sec])
Background time interval of the image:
-239.560 -15.560 (delta_t = 224.000 [sec])
Lightcurves
Notes:
- 1) The mask-weighted light curves are using the flight position.
- 2) Multiple plots of different time binning/intervals are shown to cover all scenarios of short/long GRBs, rate/image triggers, and real/false positives.
- 3) For all the mask-weighted lightcurves, the y-axis units are counts/sec/det where a det is 0.4 x 0.4 = 0.16 sq cm.
- 4) The verticle lines correspond to following: green dotted lines are T50 interval, black dotted lines are T90 interval, blue solid line(s) is a spacecraft slew start time, and orange solid line(s) is a spacecraft slew end time.
- 5) Time of each bin is in the middle of the bin.
1 s binning
From T0-310 s to T0+310 s
From T100_start - 20 s to T100_end + 30 s
Full time interval

64 ms binning
Full time interval
From T100_start to T100_end

From T0-5 sec to T0+5 sec
16 ms binning
From T100_start-5 s to T100_start+5 s

8 ms binning
From T100_start-3 s to T100_start+3 s

2 ms binning
From T100_start-1 s to T100_start+1 s

SN=5 or 10 sec. binning (whichever binning is satisfied first)
SN=5 or 10 sec. binning (T < 200 sec)
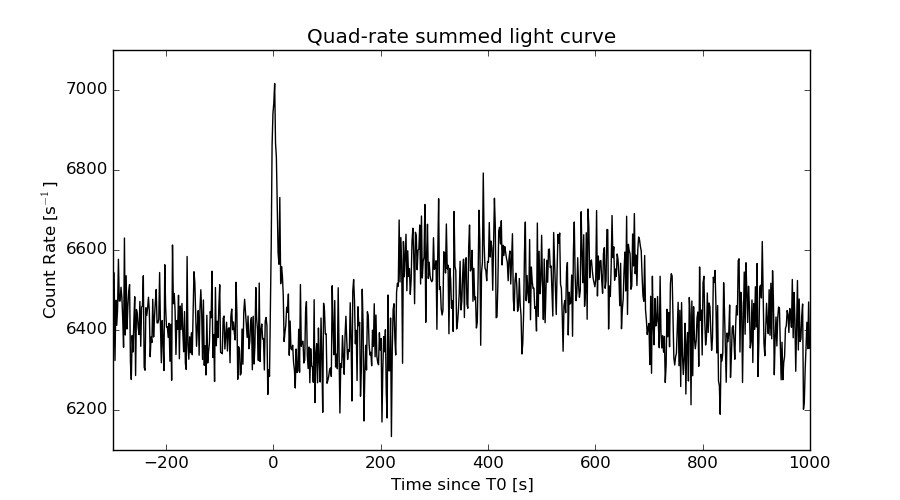
Quad-rate summed light curves (from T0-300s to T0+1000s)
Spectral Evolution

Spectra
Notes:
- 1) The fitting includes the systematic errors.
- 2) When the burst includes telescope slew time periods, the fitting uses an average response file made from multiple 5-s response files through out the slew time plus single time preiod for the non-slew times, and weighted by the total counts in the corresponding time period using addrmf. An average response file is needed becuase a spectral fit using the pre-slew DRM will introduce some errors in both a spectral shape and a normalization if the PHA file contains a lot of the slew/post-slew time interval.
- 3) For fits to more complicated models (e.g. a power-law over a cutoff power-law), the BAT team has decided to require a chi-square improvement of more than 6 for each extra dof.
Time averaged spectrum fit using the average DRM
Power-law model
Time interval is from  -15.560 sec. to   32.440 sec.

Spectral model in power-law:
------------------------------------------------------------
Parameters  : value       lower 90%   higher 90%
Photon index: 1.26518     ( -0.21845   0.212758 )
Norm@50keV  : 2.16446E-03    ( -0.000269055   0.000268435 )
------------------------------------------------------------
#Fit statistic : Chi-Squared =          60.27 using 59 PHA bins.
# Reduced chi-squared =          1.057 for     57 degrees of freedom
# Null hypothesis probability =   3.585407e-01

Photon flux (15-150 keV)    in 48 sec: 0.256644 ( -0.0342053  0.0344139 ) ph/cm2/s
Energy fluence (15-150 keV)             : 1.03567e-06 ( -1.33496e-07  1.33905e-07 ) ergs/cm2
Cutoff power-law model

Time interval is from  -15.560 sec. to   32.440 sec.
Spectral model in the cutoff power-law:
------------------------------------------------------------
Parameters  : value       lower 90%   higher 90%
Photon index: 1.02327     ( -0.882055   0.431369 )
Epeak [keV] : 231.900      ( -231.713 -231.713 )
Norm@50keV  : 2.77889E-03    ( -0.00277964   0.00378573 )
------------------------------------------------------------
#Fit statistic : Chi-Squared =          59.98 using 59 PHA bins.
# Reduced chi-squared =          1.071 for     56 degrees of freedom
# Null hypothesis probability =   3.336318e-01

Photon flux (15-150 keV)    in 48 sec: 0.253788 ( -0.035385  0.034554 ) ph/cm2/s
Energy fluence (15-150 keV)             : 1.02713e-06 ( -1.37832e-07  1.3715e-07 ) ergs/cm2
Band function

Time interval is from  -15.560 sec. to   32.440 sec.

Spectral model in the Band function:
------------------------------------------------------------
Parameters  : value       lower 90%   higher 90%
alpha       : 4.56659   ( -4.56659   -4.56659 )
beta        : -1.33542    ( -0.25082   0.242622 )
Epeak [keV] : 27.4881      ( -27.4881 162.802 )
Norm@50keV   : 52.1241    ( -6.40324   755031 )
------------------------------------------------------------
#Fit statistic : Chi-Squared =          59.58 using 59 PHA bins.
# Reduced chi-squared =          1.083 for     55 degrees of freedom
# Null hypothesis probability =   3.125248e-01

Photon flux (15-150 keV)    in 48 sec: 0.253383 (    ) ph/cm2/s
Energy fluence (15-150 keV)             : 0 ( 0  0 ) ergs/cm2
Single BB

Spectral model blackbody:
------------------------------------------------------------
Parameters  : value    Lower 90%  Upper 90%
kT [keV]    : 20.7655  (-3.1908  3.95106)
R^2/D10^2   : 1.01751E-02  (-0.00449369   0.00773124)
(R is the radius in km and D10 is the distance to the source in units of 10 kpc)
------------------------------------------------------------
#Fit statistic : Chi-Squared =          74.25 using 59 PHA bins.
# Reduced chi-squared =          1.303 for     57 degrees of freedom
# Null hypothesis probability =   6.204651e-02

Energy  Fluence     90% Error
[keV]   [erg/cm2]   [erg/cm2]
15- 25  3.998e-08   1.089e-08
25- 50  2.041e-07   4.370e-08
50-150  6.552e-07   1.396e-07
15-150  8.992e-07   1.474e-07
Thermal bremsstrahlung (OTTB)

Spectral model: thermal bremsstrahlung
------------------------------------------------------------
Parameters  : value         Lower 90%    Upper 90%
kT [keV]    : 200.000       (      )
Norm        : 1.09380       (-0.136806     0.136785)
------------------------------------------------------------
#Fit statistic : Chi-Squared =          65.78 using 59 PHA bins.
# Reduced chi-squared =          1.154 for     57 degrees of freedom
# Null hypothesis probability =   1.990815e-01

Energy  Fluence     90% Error
[keV]   [erg/cm2]   [erg/cm2]
15- 25  1.308e-07   7.373e-08
25- 50  2.516e-07   1.391e-07
50-150  5.518e-07   3.036e-07
15-150  9.341e-07   5.160e-07
Double BB

Spectral model: bbodyrad<1> + bbodyrad<2>
------------------------------------------------------------
Parameters  : value         Lower 90%    Upper 90%
kT1 [keV]   : 6.99108        (-2.12172      2.86561)
R1^2/D10^2  : 0.235880        (-0.164082      0.355094)
kT2 [keV]   : 30.3329        (-6.95025      14.4819)
R2^2/D10^2  : 2.50946E-03    (-0.00175798   0.00357206)
------------------------------------------------------------
#Fit statistic : Chi-Squared =          57.56 using 59 PHA bins.
# Reduced chi-squared =          1.047 for     55 degrees of freedom
# Null hypothesis probability =   3.805950e-01

Energy  Fluence     90% Error
[keV]   [erg/cm2]   [erg/cm2]
15- 25  1.060e-07   5.701e-08
25- 50  2.280e-07   1.212e-07
50-150  7.105e-07   3.838e-07
15-150  1.044e-06   4.852e-07
Peak spectrum fit
Power-law model

Time interval is from    7.940 sec. to    8.940 sec.

Spectral model in power-law:
------------------------------------------------------------
Parameters  : value       lower 90%   higher 90%
Photon index: 1.67266     ( -0.793898   0.783923 )
Norm@50keV  : 3.83039E-03    ( -0.00190678   0.00187069 )
------------------------------------------------------------
#Fit statistic : Chi-Squared =          59.96 using 59 PHA bins.
# Reduced chi-squared =          1.052 for     57 degrees of freedom
# Null hypothesis probability =   3.687939e-01

Photon flux (15-150 keV)    in 1 sec: 0.503868 ( -0.241911  0.244619 ) ph/cm2/s
Energy fluence (15-150 keV)             : 3.55587e-08 ( -1.72963e-08  1.85102e-08 ) ergs/cm2
Cutoff power-law model

Time interval is from    7.940 sec. to    8.940 sec.
Spectral model in the cutoff power-law:
------------------------------------------------------------
Parameters  : value       lower 90%   higher 90%
Photon index: -9.91267     (     )
Epeak [keV] : 34.2940      ( -5.75786 7.51429 )
Norm@50keV  : 1.05360E+05    (     )
------------------------------------------------------------
#Fit statistic : Chi-Squared =          54.65 using 59 PHA bins.
# Reduced chi-squared =         0.9758 for     56 degrees of freedom
# Null hypothesis probability =   5.262578e-01

Photon flux (15-150 keV)    in 1 sec: 0.457649 ( -0.183804  0.200863 ) ph/cm2/s
Energy fluence (15-150 keV)             : 2.32304e-08 ( -9.1898e-09  1.06306e-08 ) ergs/cm2
Band function

Time interval is from    7.940 sec. to    8.940 sec.

Spectral model in the Band function:
------------------------------------------------------------
Parameters  : value       lower 90%   higher 90%
alpha       : 5.00000   ( -14.2966   -5 )
beta        : -3.79635    ( 3.79386   2.04078 )
Epeak [keV] : 35.2352      ( -9.45787 10.1775 )
Norm@50keV   : 84.0933    ( -33.3268   442.922 )
------------------------------------------------------------
#Fit statistic : Chi-Squared =          55.28 using 59 PHA bins.
# Reduced chi-squared =          1.005 for     55 degrees of freedom
# Null hypothesis probability =   4.640794e-01

Photon flux (15-150 keV)    in 1 sec:  (    ) ph/cm2/s
Energy fluence (15-150 keV)             : 0 ( 0  0 ) ergs/cm2
Single BB

Spectral model blackbody:
------------------------------------------------------------
Parameters  : value    Lower 90%  Upper 90%
kT [keV]    : 9.77770  (-2.82795  4.9173)
R^2/D10^2   : 0.304447  (-0.304298   0.824257)
(R is the radius in km and D10 is the distance to the source in units of 10 kpc)
------------------------------------------------------------
#Fit statistic : Chi-Squared =          57.20 using 59 PHA bins.
# Reduced chi-squared =          1.003 for     57 degrees of freedom
# Null hypothesis probability =   4.678071e-01

Energy  Fluence     90% Error
[keV]   [erg/cm2]   [erg/cm2]
15- 25  5.880e-09   3.816e-09
25- 50  1.416e-08   9.265e-09
50-150  6.921e-09   5.725e-09
15-150  2.696e-08   1.787e-08
Thermal bremsstrahlung (OTTB)

Spectral model: thermal bremsstrahlung
------------------------------------------------------------
Parameters  : value         Lower 90%    Upper 90%
kT [keV]    : 97.2884       (-97.2884      -97.2884)
Norm        : 2.32866       (-1.19781     2.36272)
------------------------------------------------------------
#Fit statistic : Chi-Squared =          59.52 using 59 PHA bins.
# Reduced chi-squared =          1.044 for     57 degrees of freedom
# Null hypothesis probability =   3.840268e-01

Energy  Fluence     90% Error
[keV]   [erg/cm2]   [erg/cm2]
15- 25  6.086e-09   3.946e-09
25- 50  1.046e-08   7.015e-09
50-150  1.669e-08   1.486e-08
15-150  3.324e-08   2.436e-08
Double BB

------------------------------------------------------------
Parameters  : value         Lower 90%    Upper 90%
kT1 [keV]   : 200.000        (      )
R1^2/D10^2  : 4.51910E-05        (-4.5194e-05      -4.5194e-05)
kT2 [keV]   : 9.09914        (-2.60103      4.31171)
R2^2/D10^2  : 0.373989    (-0.276747   1.03231)
------------------------------------------------------------
#Fit statistic : Chi-Squared =          55.97 using 59 PHA bins.
#Fit statistic : Chi-Squared =          55.96 using 59 PHA bins.
# Reduced chi-squared =          1.018 for     55 degrees of freedom
# Reduced chi-squared =          1.017 for     55 degrees of freedom
# Null hypothesis probability =   4.382705e-01
# Null hypothesis probability =   4.387440e-01

Energy  Fluence     90% Error
[keV]   [erg/cm2]   [erg/cm2]
15- 25  6.132e-09   4.161e-09
25- 50  1.360e-08   8.785e-09
50-150  1.607e-08   5.515e-09
15-150  3.581e-08   1.803e-08
Pre-slew spectrum (Pre-slew PHA with pre-slew DRM)
Power-law model

Spectral model in power-law:
------------------------------------------------------------
Parameters  : value       lower 90%   higher 90%
Photon index: 1.26518     ( -0.21845   0.212758 )
Norm@50keV  : 2.16446E-03    ( -0.000269055   0.000268435 )
------------------------------------------------------------
#Fit statistic : Chi-Squared =          60.27 using 59 PHA bins.
# Reduced chi-squared =          1.057 for     57 degrees of freedom
# Null hypothesis probability =   3.585407e-01

Photon flux (15-150 keV)    in 48 sec: 0.256644 ( -0.0342053  0.0344139 ) ph/cm2/s
Energy fluence (15-150 keV)             : 1.03567e-06 ( -1.33496e-07  1.33905e-07 ) ergs/cm2
Cutoff power-law model
Spectral model in the cutoff power-law:
------------------------------------------------------------
Parameters  : value       lower 90%   higher 90%
Photon index: 1.02327     ( -0.882055   0.431369 )
Epeak [keV] : 231.900      ( -231.713 -231.713 )
Norm@50keV  : 2.77889E-03    ( -0.00277964   0.00378573 )
------------------------------------------------------------
#Fit statistic : Chi-Squared =          59.98 using 59 PHA bins.
# Reduced chi-squared =          1.071 for     56 degrees of freedom
# Null hypothesis probability =   3.336318e-01

Photon flux (15-150 keV)    in 48 sec: 0.253788 ( -0.035385  0.034554 ) ph/cm2/s
Energy fluence (15-150 keV)             : 1.02713e-06 ( -1.37832e-07  1.3715e-07 ) ergs/cm2
Band function
Spectral model in the Band function:
------------------------------------------------------------
Parameters  : value       lower 90%   higher 90%
alpha       : 4.56659   ( -4.56659   -4.56659 )
beta        : -1.33542    ( -0.25082   0.242622 )
Epeak [keV] : 27.4881      ( -27.4881 162.802 )
Norm@50keV   : 52.1241    ( -6.40324   755031 )
------------------------------------------------------------
#Fit statistic : Chi-Squared =          59.58 using 59 PHA bins.
# Reduced chi-squared =          1.083 for     55 degrees of freedom
# Null hypothesis probability =   3.125248e-01

Photon flux (15-150 keV)    in 48 sec: 0.253383 (    ) ph/cm2/s
Energy fluence (15-150 keV)             : 0 ( 0  0 ) ergs/cm2
S(25-50 keV) vs. S(50-100 keV) plot
S(25-50 keV)  = 2.26e-07
S(50-100 keV) = 3.76e-07
T90 vs. Hardness ratio plot

T90                                   = 48 sec.
Hardness ratio (energy fluence ratio) = 1.66372
Color vs. Color plot
Count Ratio  (25-50 keV) / (15-25 keV) = 1.68843
Count Ratio (50-100 keV) / (15-25 keV) = 1.60788
Mask shadow pattern

IMX = 9.710885768240416E-01, IMY = -1.453035710561384E-01
TIME vs. PHA plot around the trigger time

TIME vs. DetID plot around the trigger time

100 us light curve (15-350 keV)
Spacecraft aspect plot
Bright source in the pre-burst/pre-slew/post-slew images
Pre-burst image of 15-350 keV band
Time interval of the image:
-239.560000 -15.560000

# RAcent  DECcent POSerr Theta    Phi  PeakCts   SNR AngSep     Name
#  [deg]    [deg]    ['] [deg]  [deg]                   [']
163.2774  49.3225    2.1  23.1   11.9   0.8563   5.6 ------	UNKNOWN
105.6827  12.5606    2.5  43.5 -114.7   3.2736   4.7 ------	UNKNOWN
Pre-slew background subtracted image of 15-350 keV band
Time interval of the image:
-15.560000 32.440000

# RAcent  DECcent POSerr Theta    Phi  PeakCts   SNR AngSep     Name
#  [deg]    [deg]    ['] [deg]  [deg]                   [']
191.8663  20.2605    2.1  39.6   80.6   1.6360   5.4 ------	UNKNOWN
159.8740 -22.0795    2.1  52.0  155.4   1.9292   5.5 ------	UNKNOWN
187.6233  66.7959    1.0  44.5    8.5   1.6149  11.9 ------	UNKNOWN
141.4585 -10.9481    2.5  40.5  179.7   0.5199   4.6 ------	UNKNOWN
 85.8429  78.0839    2.7  56.4  -24.8   1.2742   4.2 ------	UNKNOWN
Post-slew image of 15-350 keV band
Time interval of the image:
110.340600 962.554200

# RAcent  DECcent POSerr Theta    Phi  PeakCts   SNR AngSep     Name
#  [deg]    [deg]    ['] [deg]  [deg]                   [']
223.6218  72.5701    4.0  13.5   37.4   1.1711   2.9 ------	UNKNOWN
 13.6910  58.7334    3.3  54.4  -15.3   4.6904   3.6 ------	UNKNOWN
 71.9404  57.3859    3.2  47.0  -53.0   8.7744   3.6 ------	UNKNOWN
139.0405  28.5640    3.9  48.0 -129.1   5.8946   3.0 ------	UNKNOWN
Plot creation:
Sat Jul 11 00:47:16 EDT 2015