Special notes of this burst
Image
Pre-slew 15.0-350.0 keV image (Event data)

#   RAcent    DECcent   POSerr    Theta     Phi              Peak Cts       SNR   Name
  194.4852    14.3097   0.0111     5.7392    52.8854         0.1024303     17.193 TRIG_00648437

Foreground time interval of the image:
  0.016   0.224 (delta_t =   0.208 [sec])
Background time interval of the image:
-239.568   0.016 (delta_t = 239.584 [sec])
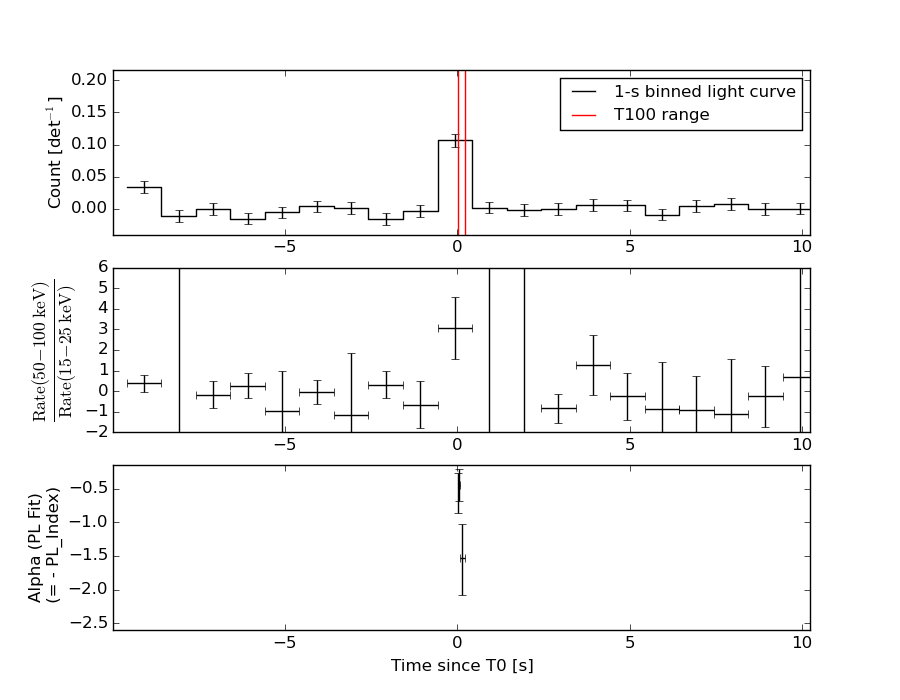
Lightcurves
Notes:
- 1) The mask-weighted light curves are using the flight position.
- 2) Multiple plots of different time binning/intervals are shown to cover all scenarios of short/long GRBs, rate/image triggers, and real/false positives.
- 3) For all the mask-weighted lightcurves, the y-axis units are counts/sec/det where a det is 0.4 x 0.4 = 0.16 sq cm.
- 4) The verticle lines correspond to following: green dotted lines are T50 interval, black dotted lines are T90 interval, blue solid line(s) is a spacecraft slew start time, and orange solid line(s) is a spacecraft slew end time.
- 5) Time of each bin is in the middle of the bin.
1 s binning
From T0-310 s to T0+310 s

From T100_start - 20 s to T100_end + 30 s

Full time interval

64 ms binning
Full time interval

From T100_start to T100_end

From T0-5 sec to T0+5 sec

16 ms binning
From T100_start-5 s to T100_start+5 s

Blue+Cyan dotted lines: Time interval of the scaled map
From 0.000000 to 0.032000
8 ms binning
From T100_start-3 s to T100_start+3 s

Blue+Cyan dotted lines: Time interval of the scaled map
From 0.000000 to 0.032000
2 ms binning
From T100_start-1 s to T100_start+1 s

Blue+Cyan dotted lines: Time interval of the scaled map
From 0.000000 to 0.032000
SN=5 or 10 sec. binning (whichever binning is satisfied first)

SN=5 or 10 sec. binning (T < 200 sec)

Quad-rate summed light curves (from T0-300s to T0+1000s)

Spectral Evolution
Spectra
Notes:
- 1) The fitting includes the systematic errors.
- 2) When the burst includes telescope slew time periods, the fitting uses an average response file made from multiple 5-s response files through out the slew time plus single time preiod for the non-slew times, and weighted by the total counts in the corresponding time period using addrmf. An average response file is needed becuase a spectral fit using the pre-slew DRM will introduce some errors in both a spectral shape and a normalization if the PHA file contains a lot of the slew/post-slew time interval.
- 3) For fits to more complicated models (e.g. a power-law over a cutoff power-law), the BAT team has decided to require a chi-square improvement of more than 6 for each extra dof.
Time averaged spectrum fit using the average DRM
Power-law model

Time interval is from    0.016 sec. to    0.224 sec.

Spectral model in power-law:
------------------------------------------------------------
Parameters  : value       lower 90%   higher 90%
Photon index: 0.636140     ( -0.209712   0.200031 )
Norm@50keV  : 2.71103E-02    ( -0.00326803   0.0032222 )
------------------------------------------------------------
#Fit statistic : Chi-Squared =          55.81 using 59 PHA bins.
# Reduced chi-squared =         0.9791 for     57 degrees of freedom
# Null hypothesis probability =   5.199094e-01

Photon flux (15-150 keV)    in 0.208 sec: 3.15228 ( -0.35909  0.359386 ) ph/cm2/s
Energy fluence (15-150 keV)             : 7.08843e-08 ( -8.82827e-09  8.88019e-09 ) ergs/cm2
Cutoff power-law model

Time interval is from    0.016 sec. to    0.224 sec.
Spectral model in the cutoff power-law:
------------------------------------------------------------
Parameters  : value       lower 90%   higher 90%
Photon index: 0.395620     ( -0.980939   0.416716 )
Epeak [keV] : 403.817      ( -403.745 -403.745 )
Norm@50keV  : 3.42926E-02    ( -0.00994209   0.0508784 )
------------------------------------------------------------
#Fit statistic : Chi-Squared =          55.57 using 59 PHA bins.
# Reduced chi-squared =         0.9923 for     56 degrees of freedom
# Null hypothesis probability =   4.911649e-01

Photon flux (15-150 keV)    in 0.208 sec: 3.13136 ( -0.36767  0.36641 ) ph/cm2/s
Energy fluence (15-150 keV)             : 7.02899e-08 ( -9.37373e-09  9.17446e-09 ) ergs/cm2
Band function

Time interval is from    0.016 sec. to    0.224 sec.

Spectral model in the Band function:
------------------------------------------------------------
Parameters  : value       lower 90%   higher 90%
alpha       : -0.922133   ( 0.922133   0.922133 )
beta        : -0.636141    ( -0.200033   0.210089 )
Epeak [keV] : 15.6010      ( -15.601 -15.601 )
Norm@50keV   : 3.80646E-02    ( -0.0140918   471477 )
------------------------------------------------------------
#Fit statistic : Chi-Squared =          55.81 using 59 PHA bins.
# Reduced chi-squared =          1.015 for     55 degrees of freedom
# Null hypothesis probability =   4.442864e-01

Photon flux (15-150 keV)    in 0.208 sec:  (    ) ph/cm2/s
Energy fluence (15-150 keV)             : 0 ( 0  0 ) ergs/cm2
Single BB

Spectral model blackbody:
------------------------------------------------------------
Parameters  : value    Lower 90%  Upper 90%
kT [keV]    : 27.3806  (-4.23481  5.6745)
R^2/D10^2   : 6.38455E-02  (-0.0260559   0.0396452)
(R is the radius in km and D10 is the distance to the source in units of 10 kpc)
------------------------------------------------------------
#Fit statistic : Chi-Squared =          62.51 using 59 PHA bins.
# Reduced chi-squared =          1.097 for     57 degrees of freedom
# Null hypothesis probability =   2.868497e-01

Energy  Fluence     90% Error
[keV]   [erg/cm2]   [erg/cm2]
15- 25  1.645e-09   3.768e-10
25- 50  9.750e-09   2.000e-09
50-150  5.321e-08   9.890e-09
15-150  6.460e-08   1.058e-08
Thermal bremsstrahlung (OTTB)

Spectral model: thermal bremsstrahlung
------------------------------------------------------------
Parameters  : value         Lower 90%    Upper 90%
kT [keV]    : 200.000       (-20.1174      -200)
Norm        : 11.1273       (-1.42998     1.42998)
------------------------------------------------------------
#Fit statistic : Chi-Squared =         106.52 using 59 PHA bins.
# Reduced chi-squared =         1.8688 for     57 degrees of freedom
# Null hypothesis probability =   7.703757e-05

Energy  Fluence     90% Error
[keV]   [erg/cm2]   [erg/cm2]
15- 25  5.760e-09   3.241e-09
25- 50  1.108e-08   6.207e-09
50-150  2.430e-08   1.351e-08
15-150  4.114e-08   2.308e-08
Double BB

R1^2/D10^2  : 0.182482        (-0.106087      0.191833)
kT2 [keV]   : 200.000        (-200      -200)
R2^2/D10^2  : 6.47977E-04    (-0.000323122   0.00411854)
------------------------------------------------------------
#Fit statistic : Chi-Squared =          55.28 using 59 PHA bins.
#Fit statistic : Chi-Squared =          55.03 using 59 PHA bins.
#Fit statistic : Chi-Squared =          55.01 using 59 PHA bins.
# Reduced chi-squared =          1.005 for     55 degrees of freedom
# Reduced chi-squared =          1.000 for     55 degrees of freedom
# Reduced chi-squared =          1.000 for     55 degrees of freedom
# Null hypothesis probability =   4.640508e-01
# Null hypothesis probability =   4.736061e-01
# Null hypothesis probability =   4.742847e-01

Energy  Fluence     90% Error
[keV]   [erg/cm2]   [erg/cm2]
15- 25  2.424e-09   1.442e-09
25- 50  1.103e-08   6.141e-09
50-150  5.585e-08   2.818e-08
15-150  6.931e-08   3.669e-08
Peak spectrum fit
Power-law model

Time interval is from   -0.378 sec. to    0.622 sec.

Spectral model in power-law:
------------------------------------------------------------
Parameters  : value       lower 90%   higher 90%
Photon index: 0.663887     ( -0.314115   0.284562 )
Norm@50keV  : 6.37336E-03    ( -0.00113327   0.00109659 )
------------------------------------------------------------
#Fit statistic : Chi-Squared =          41.77 using 59 PHA bins.
# Reduced chi-squared =         0.7328 for     57 degrees of freedom
# Null hypothesis probability =   9.349917e-01

Photon flux (15-150 keV)    in 1 sec: 0.739010 ( -0.120713  0.121483 ) ph/cm2/s
Energy fluence (15-150 keV)             : 7.90872e-08 ( -1.31324e-08  1.32101e-08 ) ergs/cm2
Cutoff power-law model

Time interval is from   -0.378 sec. to    0.622 sec.
Spectral model in the cutoff power-law:
------------------------------------------------------------
Parameters  : value       lower 90%   higher 90%
Photon index: 0.657502     ( -0.318266   0.285653 )
Epeak [keV] : 9999.36      ( -9999.36 -9999.36 )
Norm@50keV  : 6.42692E-03    ( -0.0010619   0.0172052 )
------------------------------------------------------------
#Fit statistic : Chi-Squared =          41.77 using 59 PHA bins.
# Reduced chi-squared =         0.7459 for     56 degrees of freedom
# Null hypothesis probability =   9.214111e-01

Photon flux (15-150 keV)    in 1 sec: 0.738987 ( -0.122407  0.120908 ) ph/cm2/s
Energy fluence (15-150 keV)             : 7.91018e-08 ( -1.39343e-08  1.3195e-08 ) ergs/cm2
Band function

Time interval is from   -0.378 sec. to    0.622 sec.

Spectral model in the Band function:
------------------------------------------------------------
Parameters  : value       lower 90%   higher 90%
alpha       : -0.811580   ( 0.81158   0.81158 )
beta        : -0.663888    ( -0.284065   0.314118 )
Epeak [keV] : 16.3624      ( -16.3624 -16.3624 )
Norm@50keV   : 9.10563E-03    ( -0.00382085   0 )
------------------------------------------------------------
#Fit statistic : Chi-Squared =          41.77 using 59 PHA bins.
# Reduced chi-squared =         0.7594 for     55 degrees of freedom
# Null hypothesis probability =   9.057167e-01

Photon flux (15-150 keV)    in 1 sec:  (    ) ph/cm2/s
Energy fluence (15-150 keV)             : 0 ( 0  0 ) ergs/cm2
Single BB

Spectral model blackbody:
------------------------------------------------------------
Parameters  : value    Lower 90%  Upper 90%
kT [keV]    : 26.6749  (-5.70002  9.14051)
R^2/D10^2   : 1.57960E-02  (-0.00890551   0.0165702)
(R is the radius in km and D10 is the distance to the source in units of 10 kpc)
------------------------------------------------------------
#Fit statistic : Chi-Squared =          46.81 using 59 PHA bins.
# Reduced chi-squared =         0.8212 for     57 degrees of freedom
# Null hypothesis probability =   8.301711e-01

Energy  Fluence     90% Error
[keV]   [erg/cm2]   [erg/cm2]
15- 25  1.884e-09   7.794e-10
25- 50  1.104e-08   3.271e-09
50-150  5.754e-08   1.850e-08
15-150  7.046e-08   1.946e-08
Thermal bremsstrahlung (OTTB)

Spectral model: thermal bremsstrahlung
------------------------------------------------------------
Parameters  : value         Lower 90%    Upper 90%
kT [keV]    : 200.000       (-33.7314      -200)
Norm        : 2.83058       (-0.502745     0.502745)
------------------------------------------------------------
#Fit statistic : Chi-Squared =          67.06 using 59 PHA bins.
# Reduced chi-squared =          1.177 for     57 degrees of freedom
# Null hypothesis probability =   1.700695e-01

Energy  Fluence     90% Error
[keV]   [erg/cm2]   [erg/cm2]
15- 25  7.047e-09   4.148e-09
25- 50  1.356e-08   7.765e-09
50-150  2.973e-08   1.705e-08
15-150  5.034e-08   2.894e-08
Double BB

R1^2/D10^2  : 6.08966E-02        (-0.0386039      0.0984043)
kT2 [keV]   : 199.363        (-199.363      -199.363)
R2^2/D10^2  : 1.68188E-04    (-7.9875e-05   0.00265148)
------------------------------------------------------------
#Fit statistic : Chi-Squared =          39.57 using 59 PHA bins.
#Fit statistic : Chi-Squared =          39.08 using 59 PHA bins.
#Fit statistic : Chi-Squared =          38.91 using 59 PHA bins.
# Reduced chi-squared =         0.7195 for     55 degrees of freedom
# Reduced chi-squared =         0.7105 for     55 degrees of freedom
# Reduced chi-squared =         0.7074 for     55 degrees of freedom
# Null hypothesis probability =   9.419411e-01
# Null hypothesis probability =   9.485038e-01
# Null hypothesis probability =   9.506244e-01

Energy  Fluence     90% Error
[keV]   [erg/cm2]   [erg/cm2]
15- 25  3.151e-09   1.795e-09
25- 50  1.305e-08   7.240e-09
50-150  6.232e-08   4.350e-08
15-150  7.852e-08   4.443e-08
Pre-slew spectrum (Pre-slew PHA with pre-slew DRM)
Power-law model

Spectral model in power-law:
------------------------------------------------------------
Parameters  : value       lower 90%   higher 90%
Photon index: 0.636140     ( -0.209712   0.200031 )
Norm@50keV  : 2.71103E-02    ( -0.00326803   0.0032222 )
------------------------------------------------------------
#Fit statistic : Chi-Squared =          55.81 using 59 PHA bins.
# Reduced chi-squared =         0.9791 for     57 degrees of freedom
# Null hypothesis probability =   5.199094e-01

Photon flux (15-150 keV)    in 0.208 sec: 3.15228 ( -0.35909  0.359386 ) ph/cm2/s
Energy fluence (15-150 keV)             : 7.08843e-08 ( -8.82827e-09  8.88019e-09 ) ergs/cm2
Cutoff power-law model

Spectral model in the cutoff power-law:
------------------------------------------------------------
Parameters  : value       lower 90%   higher 90%
Photon index: 0.395620     ( -0.980939   0.416716 )
Epeak [keV] : 403.817      ( -403.745 -403.745 )
Norm@50keV  : 3.42926E-02    ( -0.00994209   0.0508784 )
------------------------------------------------------------
#Fit statistic : Chi-Squared =          55.57 using 59 PHA bins.
# Reduced chi-squared =         0.9923 for     56 degrees of freedom
# Null hypothesis probability =   4.911649e-01

Photon flux (15-150 keV)    in 0.208 sec: 3.13136 ( -0.36767  0.36641 ) ph/cm2/s
Energy fluence (15-150 keV)             : 7.02899e-08 ( -9.37373e-09  9.17446e-09 ) ergs/cm2
Band function
Spectral model in the Band function:
------------------------------------------------------------
Parameters  : value       lower 90%   higher 90%
alpha       : -0.922133   ( 0.922133   0.922133 )
beta        : -0.636141    ( -0.200033   0.210089 )
Epeak [keV] : 15.6010      ( -15.601 -15.601 )
Norm@50keV   : 3.80646E-02    ( -0.0140918   471477 )
------------------------------------------------------------
#Fit statistic : Chi-Squared =          55.81 using 59 PHA bins.
# Reduced chi-squared =          1.015 for     55 degrees of freedom
# Null hypothesis probability =   4.442864e-01

Photon flux (15-150 keV)    in 0.208 sec:  (    ) ph/cm2/s
Energy fluence (15-150 keV)             : 0 ( 0  0 ) ergs/cm2
S(25-50 keV) vs. S(50-100 keV) plot

S(25-50 keV)  = 1.01e-08
S(50-100 keV) = 2.61e-08
T90 vs. Hardness ratio plot

T90                                   = 0.151999950408936 sec.
Hardness ratio (energy fluence ratio) = 2.58416
Color vs. Color plot

Count Ratio  (25-50 keV) / (15-25 keV) = 2.25665
Count Ratio (50-100 keV) / (15-25 keV) = 3.21835
Mask shadow pattern

IMX = 6.064522092054508E-02, IMY = -8.014500274109104E-02
TIME vs. PHA plot around the trigger time
Blue+Cyan dotted lines: Time interval of the scaled map
From 0.000000 to 0.032000
TIME vs. DetID plot around the trigger time

Blue+Cyan dotted lines: Time interval of the scaled map
From 0.000000 to 0.032000
100 us light curve (15-350 keV)

Blue+Cyan dotted lines: Time interval of the scaled map
From 0.000000 to 0.032000
Spacecraft aspect plot
Bright source in the pre-burst/pre-slew/post-slew images
Pre-burst image of 15-350 keV band
Time interval of the image:
-239.568000 0.016000

# RAcent  DECcent POSerr Theta    Phi  PeakCts   SNR AngSep     Name
#  [deg]    [deg]    ['] [deg]  [deg]                   [']
239.6722  41.8725    2.5  52.8   26.5   4.3046   4.6 ------	UNKNOWN
194.6551  65.4771    2.8  52.9  -17.0   1.9724   4.1 ------	UNKNOWN
153.4394 -34.2174    2.5  57.7 -165.5   4.5840   4.6 ------	UNKNOWN
148.0582 -31.2082    3.4  58.8 -159.2   5.1862   3.4 ------	UNKNOWN
Pre-slew background subtracted image of 15-350 keV band
Time interval of the image:
0.016000 0.224000

# RAcent  DECcent POSerr Theta    Phi  PeakCts   SNR AngSep     Name
#  [deg]    [deg]    ['] [deg]  [deg]                   [']
194.4852  14.3097    0.7   5.7   52.9   0.1024  17.2 ------	UNKNOWN
Post-slew image of 15-350 keV band
Time interval of the image:
32.732600 962.497800

# RAcent  DECcent POSerr Theta    Phi  PeakCts   SNR AngSep     Name
#  [deg]    [deg]    ['] [deg]  [deg]                   [']
236.2058  47.7733    3.0  48.0   16.4   4.4236   3.8 ------	UNKNOWN
233.8533  53.5158    3.8  49.9    8.9   3.7224   3.0 ------	UNKNOWN
206.9800  21.1493    3.8  13.7   37.7   1.4276   3.0 ------	UNKNOWN
183.6665 -19.1805    2.6  35.2  177.3   2.7801   4.4 ------	UNKNOWN
182.9973 -18.9017    2.7  35.1  178.5   2.5342   4.2 ------	UNKNOWN
Plot creation:
Sat Aug  8 00:37:44 EDT 2015