Special notes of this burst
Image
Pre-slew 15.0-350.0 keV image (Event data)

#   RAcent    DECcent   POSerr    Theta     Phi              Peak Cts       SNR   Name
  278.4863   -12.9755   0.0063    13.0783    56.2112         1.4986007     30.282 TRIG_00649157

Foreground time interval of the image:
 -4.192  13.381 (delta_t =  17.573 [sec])
Background time interval of the image:
-239.920  -4.192 (delta_t = 235.728 [sec])
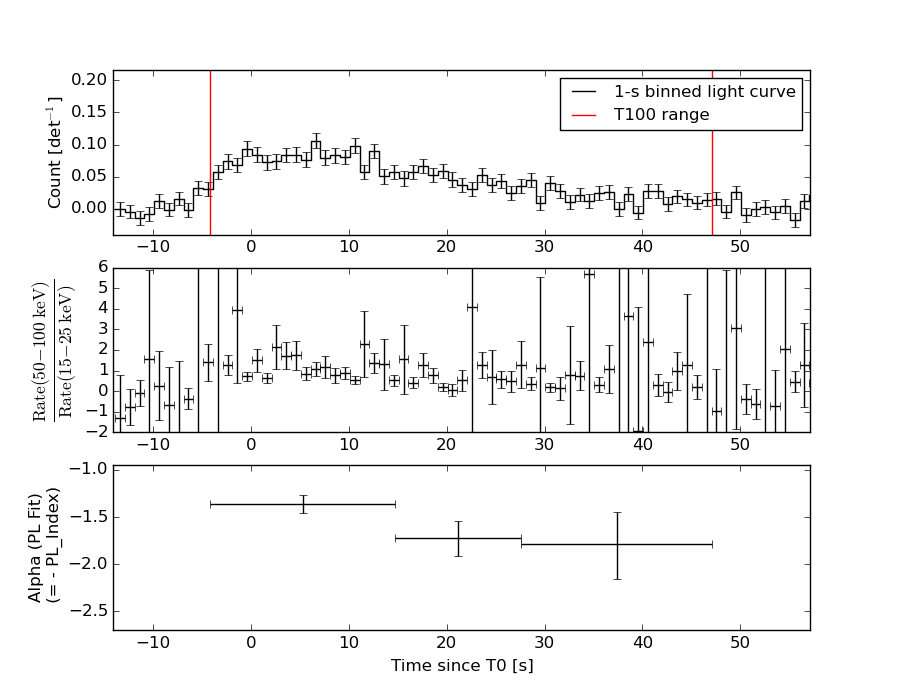
Lightcurves
Notes:
- 1) The mask-weighted light curves are using the flight position.
- 2) Multiple plots of different time binning/intervals are shown to cover all scenarios of short/long GRBs, rate/image triggers, and real/false positives.
- 3) For all the mask-weighted lightcurves, the y-axis units are counts/sec/det where a det is 0.4 x 0.4 = 0.16 sq cm.
- 4) The verticle lines correspond to following: green dotted lines are T50 interval, black dotted lines are T90 interval, blue solid line(s) is a spacecraft slew start time, and orange solid line(s) is a spacecraft slew end time.
- 5) Time of each bin is in the middle of the bin.
1 s binning
From T0-310 s to T0+310 s

From T100_start - 20 s to T100_end + 30 s

Full time interval

64 ms binning
Full time interval

From T100_start to T100_end

From T0-5 sec to T0+5 sec

16 ms binning
From T100_start-5 s to T100_start+5 s

Blue+Cyan dotted lines: Time interval of the scaled map
From 0.000000 to 1.024000
8 ms binning
From T100_start-3 s to T100_start+3 s

Blue+Cyan dotted lines: Time interval of the scaled map
From 0.000000 to 1.024000
2 ms binning
From T100_start-1 s to T100_start+1 s

Blue+Cyan dotted lines: Time interval of the scaled map
From 0.000000 to 1.024000
SN=5 or 10 sec. binning (whichever binning is satisfied first)

SN=5 or 10 sec. binning (T < 200 sec)

Quad-rate summed light curves (from T0-300s to T0+1000s)

Spectral Evolution
Spectra
Notes:
- 1) The fitting includes the systematic errors.
- 2) When the burst includes telescope slew time periods, the fitting uses an average response file made from multiple 5-s response files through out the slew time plus single time preiod for the non-slew times, and weighted by the total counts in the corresponding time period using addrmf. An average response file is needed becuase a spectral fit using the pre-slew DRM will introduce some errors in both a spectral shape and a normalization if the PHA file contains a lot of the slew/post-slew time interval.
- 3) For fits to more complicated models (e.g. a power-law over a cutoff power-law), the BAT team has decided to require a chi-square improvement of more than 6 for each extra dof.
Time averaged spectrum fit using the average DRM
Power-law model

Time interval is from   -4.192 sec. to   47.144 sec.

Spectral model in power-law:
------------------------------------------------------------
Parameters  : value       lower 90%   higher 90%
Photon index: 1.53412     ( -0.0946912   0.0950769 )
Norm@50keV  : 3.04669E-03    ( -0.000161248   0.000160896 )
------------------------------------------------------------
#Fit statistic : Chi-Squared =          64.78 using 59 PHA bins.
# Reduced chi-squared =          1.136 for     57 degrees of freedom
# Null hypothesis probability =   2.236970e-01

Photon flux (15-150 keV)    in 51.34 sec: 0.383944 ( -0.0206928  0.0207365 ) ph/cm2/s
Energy fluence (15-150 keV)             : 1.47595e-06 ( -8.46935e-08  8.51813e-08 ) ergs/cm2
Cutoff power-law model

Time interval is from   -4.192 sec. to   47.144 sec.
Spectral model in the cutoff power-law:
------------------------------------------------------------
Parameters  : value       lower 90%   higher 90%
Photon index: 1.00573     ( -0.42915   0.389639 )
Epeak [keV] : 94.4785      ( -22.2256 114.333 )
Norm@50keV  : 5.57723E-03    ( -0.00196649   0.00342964 )
------------------------------------------------------------
#Fit statistic : Chi-Squared =          59.26 using 59 PHA bins.
# Reduced chi-squared =          1.058 for     56 degrees of freedom
# Null hypothesis probability =   3.576634e-01

Photon flux (15-150 keV)    in 51.34 sec: 0.371870 ( -0.022416  0.022429 ) ph/cm2/s
Energy fluence (15-150 keV)             : 1.41125e-06 ( -9.72739e-08  9.74639e-08 ) ergs/cm2
Band function

Time interval is from   -4.192 sec. to   47.144 sec.

Spectral model in the Band function:
------------------------------------------------------------
Parameters  : value       lower 90%   higher 90%
alpha       : -0.960227   ( -0.432334   2.27034 )
beta        : -2.06007    ( 2.05539   0.485414 )
Epeak [keV] : 89.0595      ( -53.4487 113.476 )
Norm@50keV   : 5.92544E-03    ( -0.00227115   0.113619 )
------------------------------------------------------------
#Fit statistic : Chi-Squared =          59.21 using 59 PHA bins.
# Reduced chi-squared =          1.077 for     55 degrees of freedom
# Null hypothesis probability =   3.244682e-01

Photon flux (15-150 keV)    in 51.34 sec: 0.371456 ( 6.62854  -0.022423 ) ph/cm2/s
Energy fluence (15-150 keV)             : 1.41045e-06 ( 0  0 ) ergs/cm2
Single BB

Spectral model blackbody:
------------------------------------------------------------
Parameters  : value    Lower 90%  Upper 90%
kT [keV]    : 14.9124  (  )
R^2/D10^2   : 4.33258E-02  (   )
(R is the radius in km and D10 is the distance to the source in units of 10 kpc)
------------------------------------------------------------
#Fit statistic : Chi-Squared =         117.46 using 59 PHA bins.
# Reduced chi-squared =         2.0607 for     57 degrees of freedom
# Null hypothesis probability =   4.390270e-06

Energy  Fluence     90% Error
[keV]   [erg/cm2]   [erg/cm2]
15- 25  1.037e-07   1.076e-08
25- 50  4.096e-07   2.767e-08
50-150  6.183e-07   6.443e-08
15-150  1.132e-06   7.521e-08
Thermal bremsstrahlung (OTTB)
Spectral model: thermal bremsstrahlung
------------------------------------------------------------
Parameters  : value         Lower 90%    Upper 90%
kT [keV]    : 199.363       (-44.0459      -199.363)
Norm        : 1.56348       (-0.0805502     0.0806814)
------------------------------------------------------------
#Fit statistic : Chi-Squared =          60.43 using 59 PHA bins.
# Reduced chi-squared =          1.060 for     57 degrees of freedom
# Null hypothesis probability =   3.530478e-01

Energy  Fluence     90% Error
[keV]   [erg/cm2]   [erg/cm2]
15- 25  1.999e-07   1.201e-08
25- 50  3.845e-07   2.321e-08
50-150  8.433e-07   5.057e-08
15-150  1.428e-06   1.681e-07
Double BB

Spectral model: bbodyrad<1> + bbodyrad<2>
------------------------------------------------------------
Parameters  : value         Lower 90%    Upper 90%
kT1 [keV]   : 7.04787        (-1.50215      1.73589)
R1^2/D10^2  : 0.350469        (-0.171478      0.442956)
kT2 [keV]   : 23.5788        (-3.74461      6.74647)
R2^2/D10^2  : 6.77613E-03    (-0.00417059   0.00661272)
------------------------------------------------------------
#Fit statistic : Chi-Squared =          60.58 using 59 PHA bins.
# Reduced chi-squared =          1.101 for     55 degrees of freedom
# Null hypothesis probability =   2.815861e-01

Energy  Fluence     90% Error
[keV]   [erg/cm2]   [erg/cm2]
15- 25  1.792e-07   4.749e-08
25- 50  3.911e-07   7.057e-08
50-150  8.241e-07   2.286e-07
15-150  1.394e-06   3.658e-07
Peak spectrum fit
Power-law model

Time interval is from    9.692 sec. to   10.692 sec.

Spectral model in power-law:
------------------------------------------------------------
Parameters  : value       lower 90%   higher 90%
Photon index: 1.79646     ( -0.307401   0.328315 )
Norm@50keV  : 5.98850E-03    ( -0.00122654   0.00118734 )
------------------------------------------------------------
#Fit statistic : Chi-Squared =          47.78 using 59 PHA bins.
# Reduced chi-squared =         0.8382 for     57 degrees of freedom
# Null hypothesis probability =   8.028877e-01

Photon flux (15-150 keV)    in 1 sec: 0.824079 ( -0.143096  0.143169 ) ph/cm2/s
Energy fluence (15-150 keV)             : 5.51375e-08 ( -1.12319e-08  1.15683e-08 ) ergs/cm2
Cutoff power-law model

Time interval is from    9.692 sec. to   10.692 sec.
Spectral model in the cutoff power-law:
------------------------------------------------------------
Parameters  : value       lower 90%   higher 90%
Photon index: 1.33334     ( -1.62038   0.880124 )
Epeak [keV] : 63.5046      (   )
Norm@50keV  : 1.08578E-02    (     )
------------------------------------------------------------
#Fit statistic : Chi-Squared =          47.35 using 59 PHA bins.
# Reduced chi-squared =         0.8456 for     56 degrees of freedom
# Null hypothesis probability =   7.880564e-01

Photon flux (15-150 keV)    in 1 sec: 0.809275 ( -0.148874  0.148018 ) ph/cm2/s
Energy fluence (15-150 keV)             : 5.26878e-08 ( -1.27617e-08  1.30125e-08 ) ergs/cm2
Band function

Time interval is from    9.692 sec. to   10.692 sec.

Spectral model in the Band function:
------------------------------------------------------------
Parameters  : value       lower 90%   higher 90%
alpha       : -1.33431   ( 1.50641   0.458727 )
beta        : -10.00000    ( 10   20 )
Epeak [keV] : 63.5474      ( -33.8457 -63.5474 )
Norm@50keV   : 1.08423E-02    ( -0.00595646   0.0169935 )
------------------------------------------------------------
#Fit statistic : Chi-Squared =          47.35 using 59 PHA bins.
# Reduced chi-squared =         0.8609 for     55 degrees of freedom
# Null hypothesis probability =   7.585910e-01

Photon flux (15-150 keV)    in 1 sec:  (    ) ph/cm2/s
Energy fluence (15-150 keV)             : 5.28924e-08 ( 0  0 ) ergs/cm2
Single BB

Spectral model blackbody:
------------------------------------------------------------
Parameters  : value    Lower 90%  Upper 90%
kT [keV]    : 11.0911  (-2.1641  2.80791)
R^2/D10^2   : 0.264064  (-0.149573   0.328698)
(R is the radius in km and D10 is the distance to the source in units of 10 kpc)
------------------------------------------------------------
#Fit statistic : Chi-Squared =          53.58 using 59 PHA bins.
# Reduced chi-squared =         0.9401 for     57 degrees of freedom
# Null hypothesis probability =   6.039838e-01

Energy  Fluence     90% Error
[keV]   [erg/cm2]   [erg/cm2]
15- 25  6.798e-09   2.222e-09
25- 50  1.943e-08   5.405e-09
50-150  1.358e-08   6.407e-09
15-150  3.981e-08   1.206e-08
Thermal bremsstrahlung (OTTB)

Spectral model: thermal bremsstrahlung
------------------------------------------------------------
Parameters  : value         Lower 90%    Upper 90%
kT [keV]    : 98.1234       (-45.0535      -98.1234)
Norm        : 3.66399       (-0.738534     1.12152)
------------------------------------------------------------
#Fit statistic : Chi-Squared =          47.34 using 59 PHA bins.
# Reduced chi-squared =         0.8306 for     57 degrees of freedom
# Null hypothesis probability =   8.153593e-01

Energy  Fluence     90% Error
[keV]   [erg/cm2]   [erg/cm2]
15- 25  9.576e-09   2.517e-09
25- 50  1.649e-08   6.247e-09
50-150  2.644e-08   1.739e-08
15-150  5.251e-08   2.194e-08
Double BB

Spectral model: bbodyrad<1> + bbodyrad<2>
------------------------------------------------------------
Parameters  : value         Lower 90%    Upper 90%
kT1 [keV]   : 7.13207        (-4.56496      3.76163)
R1^2/D10^2  : 0.981594        (-0.707716      55.2315)
kT2 [keV]   : 24.9310        (-20.9554      -25.2683)
R2^2/D10^2  : 8.79528E-03    (-0.00830362   0.177776)
------------------------------------------------------------
#Fit statistic : Chi-Squared =          47.67 using 59 PHA bins.
# Reduced chi-squared =         0.8667 for     55 degrees of freedom
# Null hypothesis probability =   7.480599e-01

Energy  Fluence     90% Error
[keV]   [erg/cm2]   [erg/cm2]
15- 25  9.126e-09   5.285e-09
25- 50  1.699e-08   9.215e-09
50-150  2.690e-08   1.670e-08
15-150  5.302e-08   2.743e-08
Pre-slew spectrum (Pre-slew PHA with pre-slew DRM)
Power-law model

Spectral model in power-law:
------------------------------------------------------------
Parameters  : value       lower 90%   higher 90%
Photon index: 1.33860     ( -0.0980018   0.0976588 )
Norm@50keV  : 5.20002E-03    ( -0.000282359   0.000282328 )
------------------------------------------------------------
#Fit statistic : Chi-Squared =          55.07 using 59 PHA bins.
# Reduced chi-squared =         0.9662 for     57 degrees of freedom
# Null hypothesis probability =   5.477907e-01

Photon flux (15-150 keV)    in 17.57 sec: 0.625003 ( -0.0355516  0.0356351 ) ph/cm2/s
Energy fluence (15-150 keV)             : 8.9465e-07 ( -5.31832e-08  5.3407e-08 ) ergs/cm2
Cutoff power-law model

Spectral model in the cutoff power-law:
------------------------------------------------------------
Parameters  : value       lower 90%   higher 90%
Photon index: 0.798568     ( -0.454418   0.409533 )
Epeak [keV] : 118.795      ( -31.7021 185.711 )
Norm@50keV  : 9.35028E-03    ( -0.0032908   0.00573459 )
------------------------------------------------------------
#Fit statistic : Chi-Squared =          49.87 using 59 PHA bins.
# Reduced chi-squared =         0.8905 for     56 degrees of freedom
# Null hypothesis probability =   7.048134e-01

Photon flux (15-150 keV)    in 17.57 sec: 0.605899 ( -0.038308  0.038297 ) ph/cm2/s
Energy fluence (15-150 keV)             : 8.61237e-07 ( -5.96484e-08  5.94534e-08 ) ergs/cm2
Band function

Spectral model in the Band function:
------------------------------------------------------------
Parameters  : value       lower 90%   higher 90%
alpha       : -0.709818   ( -0.479327   0.972436 )
beta        : -1.77954    ( 1.78085   0.378342 )
Epeak [keV] : 105.486      ( -55.5284 167.105 )
Norm@50keV   : 1.04686E-02    ( -0.00421442   0.03748 )
------------------------------------------------------------
#Fit statistic : Chi-Squared =          49.64 using 59 PHA bins.
# Reduced chi-squared =         0.9025 for     55 degrees of freedom
# Null hypothesis probability =   6.789306e-01

Photon flux (15-150 keV)    in 17.57 sec:  (    ) ph/cm2/s
Energy fluence (15-150 keV)             : 0 ( 0  0 ) ergs/cm2
S(25-50 keV) vs. S(50-100 keV) plot

S(25-50 keV)  = 3.71e-07
S(50-100 keV) = 5.13e-07
T90 vs. Hardness ratio plot

T90                                   = 42.567999958992 sec.
Hardness ratio (energy fluence ratio) = 1.38275
Color vs. Color plot

Count Ratio  (25-50 keV) / (15-25 keV) = 1.41353
Count Ratio (50-100 keV) / (15-25 keV) = 0.982822
Mask shadow pattern

IMX = 1.291940800163469E-01, IMY = -1.930691838926180E-01
TIME vs. PHA plot around the trigger time

Blue+Cyan dotted lines: Time interval of the scaled map
From 0.000000 to 1.024000
TIME vs. DetID plot around the trigger time

Blue+Cyan dotted lines: Time interval of the scaled map
From 0.000000 to 1.024000
100 us light curve (15-350 keV)

Blue+Cyan dotted lines: Time interval of the scaled map
From 0.000000 to 1.024000
Spacecraft aspect plot

Bright source in the pre-burst/pre-slew/post-slew images
Pre-burst image of 15-350 keV band
Time interval of the image:
-239.920000 -4.192000

# RAcent  DECcent POSerr Theta    Phi  PeakCts   SNR AngSep     Name
#  [deg]    [deg]    ['] [deg]  [deg]                   [']
244.9841 -15.6354    0.3  21.6  -82.5   8.6520  34.6    0.4	Sco X-1
254.3821  35.3859    6.7  57.0  -13.8   1.6128   1.7    4.5	Her X-1
255.9810 -37.8422    0.4  20.0 -154.8   6.8037  28.6    0.3	4U 1700-377
256.3578 -36.4268    3.6  18.7 -153.2   0.7486   3.2    3.8	GX 349+2
263.1814 -24.6041    0.0   5.7 -141.3   0.5060   2.3   12.7	GX 1+4
264.5624 -44.2929   31.2  24.1 -176.8   0.0843   0.4   12.2	4U 1735-44
268.4664  -1.4921   14.5  18.9    2.6   0.1715   0.8    6.4	SW J1753.5-0127
270.2910 -25.0643    3.6   5.5  148.0   0.7215   3.2    1.0	GX 5-1
270.2023 -25.7026    3.4   6.1  151.9   0.7749   3.5    5.9	GRS 1758-258
273.9442 -13.9630    5.7   9.1   45.1   0.4090   2.0    5.7	GX 17+2
275.9209 -30.3698    2.7  12.8  142.2   0.9756   4.3    0.3	H1820-303
284.9958 -25.0694   17.5  17.1  108.1   0.1648   0.7    9.2	HT1900.1-2455
288.9506  10.7921   33.9  37.8   35.1   0.1437   0.3   12.9	GRS 1915+105
262.9617 -33.8144    3.2  14.0 -166.7   0.7804   3.6    1.8	GX 354-0
283.8324 -22.8876    2.5  15.7  101.1   1.0830   4.6 ------	UNKNOWN
263.4842  30.8994    2.9  51.3   -5.4   2.0947   3.9 ------	UNKNOWN
Pre-slew background subtracted image of 15-350 keV band
Time interval of the image:
-4.192000 13.380590

# RAcent  DECcent POSerr Theta    Phi  PeakCts   SNR AngSep     Name
#  [deg]    [deg]    ['] [deg]  [deg]                   [']
245.1310 -15.5190    7.0  21.5  -82.1   0.0943   1.6   11.4	Sco X-1
254.5674  35.3492    5.3  56.9  -13.6  -0.4344  -2.2    5.4	Her X-1
256.1477 -38.0125    0.0  20.1 -155.4   0.1501   3.1   12.7	4U 1700-377
256.4875 -36.2789    5.2  18.5 -153.2   0.1025   2.2    9.0	GX 349+2
262.8470 -24.6944    3.6   5.9 -139.7   0.1539   3.2    9.3	GX 1+4
264.7683 -44.3007    4.8  24.1 -177.1   0.1220   2.4    9.0	4U 1735-44
268.5094  -1.4866   10.0  18.9    2.7  -0.0567  -1.2    8.7	SW J1753.5-0127
270.2835 -25.0926   13.5   5.6  148.3   0.0429   0.9    0.8	GX 5-1
270.2719 -25.6618   38.2   6.1  151.2  -0.0168  -0.3    5.2	GRS 1758-258
273.9481 -13.8876    8.1   9.1   44.8  -0.0696  -1.4    9.5	GX 17+2
276.1012 -30.5075    0.0  13.0  142.1  -0.0809  -1.7   12.4	H1820-303
284.8645 -24.8532    7.5  16.9  107.4  -0.0831  -1.5   10.2	HT1900.1-2455
288.9430  10.8531   10.6  37.8   35.1   0.0973   1.1   10.2	GRS 1915+105
262.8187 -33.7495    6.0  14.0 -166.2  -0.0893  -1.9    9.9	GX 354-0
311.9585 -37.5077    2.0  42.3  122.5   1.2204   5.9 ------	UNKNOWN
283.7079  -5.0724    2.3  22.1   47.3   0.2867   5.0 ------	UNKNOWN
278.4864 -12.9754    0.4  13.1   56.2   1.4987  30.3 ------	UNKNOWN
275.5814   6.0622    2.3  27.6   16.9   0.2945   5.1 ------	UNKNOWN
245.1807   4.2751    2.1  32.7  -45.1   0.3301   5.4 ------	UNKNOWN
220.2578 -30.0702    2.7  43.3 -114.1   0.8243   4.3 ------	UNKNOWN
214.2304 -44.4375    2.5  49.7 -133.0   0.9591   4.6 ------	UNKNOWN
Post-slew image of 15-350 keV band
Time interval of the image:
65.580590 422.380000
840.080000 962.117900

# RAcent  DECcent POSerr Theta    Phi  PeakCts   SNR AngSep     Name
#  [deg]    [deg]    ['] [deg]  [deg]                   [']
245.0015 -15.6480    2.3  32.5 -128.4  17.9414   5.0    1.4	Sco X-1
255.9676 -37.8578    2.6  31.9 -174.8  12.5289   4.4    1.2	4U 1700-377
256.5050 -36.5613   12.2  30.7 -173.6   2.6693   0.9    8.9	GX 349+2
263.0820 -24.6096    6.9  18.6 -160.4   4.3114   1.7    9.1	GX 1+4
264.9384 -44.3651    6.4  33.4  168.1  -5.8385  -1.8    9.8	4U 1735-44
268.2595  -1.4975   18.6  15.3  -71.8   1.5401   0.6    7.0	SW J1753.5-0127
270.3286 -25.1432    6.0  14.4 -178.5   4.8696   1.9    4.5	GX 5-1
270.3495 -25.8987    4.2  15.0  179.9  -6.9360  -2.8    9.7	GRS 1758-258
274.2020 -13.9754   10.6   4.3 -133.2   2.7082   1.1   12.0	GX 17+2
276.1606 -30.3112    0.0  17.4  157.1  -2.8326  -1.2   12.7	H1820-303
284.9924 -25.0654    9.6  13.5  124.3   3.1874   1.2    9.0	HT1900.1-2455
288.6944  11.0384    7.5  26.1   -6.3  -3.7183  -1.5    8.3	GRS 1915+105
299.6253  35.1772    7.6  52.2   -7.7   8.2867   1.5    2.3	Cyg X-1
262.8272 -33.7891    4.7  25.2 -177.8   5.8906   2.4    8.5	GX 354-0
291.0356 -39.8806    2.9  29.1  130.3  13.5278   4.0 ------	UNKNOWN
316.6962  28.8202    3.0  55.8   11.3  45.6120   3.8 ------	UNKNOWN
272.4901 -46.2264    2.7  33.6  157.9  14.7517   4.2 ------	UNKNOWN
294.8157  -3.7740    2.9  18.6   32.0   8.5404   3.9 ------	UNKNOWN
244.3114 -46.5046    3.1  44.1 -175.9  16.6439   3.8 ------	UNKNOWN
Plot creation:
Sat Aug  8 00:34:01 EDT 2015