Special notes of this burst
Image
Pre-slew 15.0-50.0 keV image (Event data)
#RAcent DECcent POSerr Theta  Phi  Peak_Cts  SNR Name
119.602 -28.278 0.021 16.937 -168.627 0.615 9.081 TRIG_00649706

Image time interval: -30.000 to 60.000 [sec]
Lightcurves
Notes:
- 1) The mask-weighted light curves are using the flight position.
- 2) Multiple plots of different time binning/intervals are shown to cover all scenarios of short/long GRBs, rate/image triggers, and real/false positives.
- 3) For all the mask-weighted lightcurves, the y-axis units are counts/sec/det where a det is 0.4 x 0.4 = 0.16 sq cm.
- 4) The verticle lines correspond to following: green dotted lines are T50 interval, black dotted lines are T90 interval, blue solid line(s) is a spacecraft slew start time, and orange solid line(s) is a spacecraft slew end time.
- 5) Time of each bin is in the middle of the bin.
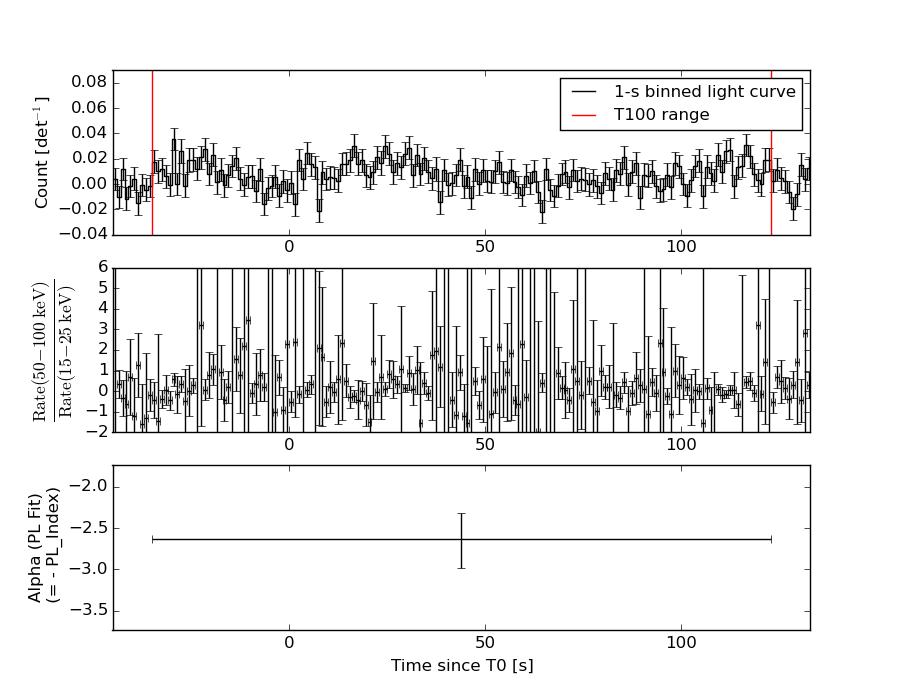
1 s binning
From T0-310 s to T0+310 s

From T100_start - 20 s to T100_end + 30 s

Full time interval

64 ms binning
Full time interval

From T100_start to T100_end

From T0-5 sec to T0+5 sec

16 ms binning
From T100_start-5 s to T100_start+5 s
Blue+Cyan dotted lines: Time interval of the scaled map
From 0.000000 to 64.000000
8 ms binning
From T100_start-3 s to T100_start+3 s
Blue+Cyan dotted lines: Time interval of the scaled map
From 0.000000 to 64.000000
2 ms binning
From T100_start-1 s to T100_start+1 s

Blue+Cyan dotted lines: Time interval of the scaled map
From 0.000000 to 64.000000
SN=5 or 10 sec. binning (whichever binning is satisfied first)
SN=5 or 10 sec. binning (T < 200 sec)

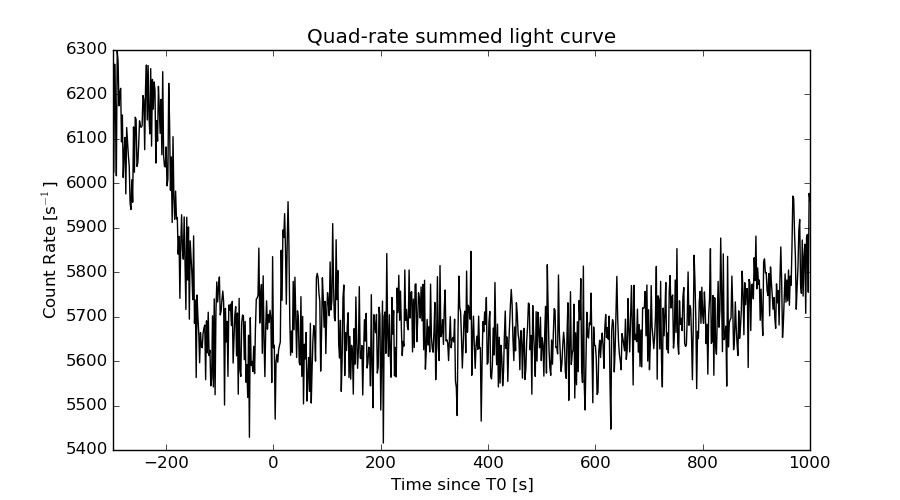
Quad-rate summed light curves (from T0-300s to T0+1000s)
Spectral Evolution
Spectra
Notes:
- 1) The fitting includes the systematic errors.
- 2) When the burst includes telescope slew time periods, the fitting uses an average response file made from multiple 5-s response files through out the slew time plus single time preiod for the non-slew times, and weighted by the total counts in the corresponding time period using addrmf. An average response file is needed becuase a spectral fit using the pre-slew DRM will introduce some errors in both a spectral shape and a normalization if the PHA file contains a lot of the slew/post-slew time interval.
- 3) For fits to more complicated models (e.g. a power-law over a cutoff power-law), the BAT team has decided to require a chi-square improvement of more than 6 for each extra dof.
Time averaged spectrum fit using the average DRM
Power-law model

Time interval is from  -35.068 sec. to  122.880 sec.

Spectral model in power-law:
------------------------------------------------------------
Parameters  : value       lower 90%   higher 90%
Photon index: 2.63218     ( -0.310805   0.353573 )
Norm@50keV  : 3.12985E-04    ( -8.33138e-05   8.51871e-05 )
------------------------------------------------------------
#Fit statistic : Chi-Squared =          63.71 using 59 PHA bins.
# Reduced chi-squared =          1.118 for     57 degrees of freedom
# Null hypothesis probability =   2.522793e-01

Photon flux (15-150 keV)    in 157.9 sec: 6.68200E-02 ( -0.00945113  0.00946157 ) ph/cm2/s
Energy fluence (15-150 keV)             : 5.13887e-07 ( -9.36503e-08  9.96838e-08 ) ergs/cm2
Cutoff power-law model
Time interval is from  -35.068 sec. to  122.880 sec.
Spectral model in the cutoff power-law:
------------------------------------------------------------
Parameters  : value       lower 90%   higher 90%
Photon index: 0.309933     ( -4.64718   1.63836 )
Epeak [keV] : 21.6061      ( -19.4138 6.52817 )
Norm@50keV  : 1.28454E-02    (     )
------------------------------------------------------------
#Fit statistic : Chi-Squared =          60.51 using 59 PHA bins.
# Reduced chi-squared =          1.081 for     56 degrees of freedom
# Null hypothesis probability =   3.164241e-01

Photon flux (15-150 keV)    in 157.9 sec: 6.33181E-02 ( -0.0093569  0.0095798 ) ph/cm2/s
Energy fluence (15-150 keV)             : 4.17887e-07 ( -7.4322e-08  1.15196e-07 ) ergs/cm2
Band function
Time interval is from  -35.068 sec. to  122.880 sec.

Spectral model in the Band function:
------------------------------------------------------------
Parameters  : value       lower 90%   higher 90%
alpha       : 0.718602   ( -1.736   0.61272 )
beta        : -3.82046    ( 3.40639   0.770065 )
Epeak [keV] : 23.2045      ( -5.26348 4.37531 )
Norm@50keV   : 7.34271E-02    ( -0.0728353   51.7365 )
------------------------------------------------------------
#Fit statistic : Chi-Squared =          59.44 using 59 PHA bins.
# Reduced chi-squared =          1.081 for     55 degrees of freedom
# Null hypothesis probability =   3.170004e-01

Photon flux (15-150 keV)    in 157.9 sec:  (    ) ph/cm2/s
Energy fluence (15-150 keV)             : 0 ( 0  0 ) ergs/cm2
Single BB

Spectral model blackbody:
------------------------------------------------------------
Parameters  : value    Lower 90%  Upper 90%
kT [keV]    : 6.28066  (-0.819484  0.934347)
R^2/D10^2   : 0.203176  (-0.0912017   0.169427)
(R is the radius in km and D10 is the distance to the source in units of 10 kpc)
------------------------------------------------------------
#Fit statistic : Chi-Squared =          60.89 using 59 PHA bins.
# Reduced chi-squared =          1.068 for     57 degrees of freedom
# Null hypothesis probability =   3.378840e-01

Energy  Fluence     90% Error
[keV]   [erg/cm2]   [erg/cm2]
15- 25  1.790e-07   4.668e-08
25- 50  1.969e-07   4.780e-08
50-150  2.167e-08   1.305e-08
15-150  3.976e-07   9.300e-08
Thermal bremsstrahlung (OTTB)

Spectral model: thermal bremsstrahlung
------------------------------------------------------------
Parameters  : value         Lower 90%    Upper 90%
kT [keV]    : 24.4984       (-6.7316      10.4097)
Norm        : 0.649278       (-0.185877     0.282959)
------------------------------------------------------------
#Fit statistic : Chi-Squared =          61.11 using 59 PHA bins.
# Reduced chi-squared =          1.072 for     57 degrees of freedom
# Null hypothesis probability =   3.305542e-01

Energy  Fluence     90% Error
[keV]   [erg/cm2]   [erg/cm2]
15- 25  1.853e-07   3.293e-08
25- 50  1.874e-07   4.549e-08
50-150  7.735e-08   4.360e-08
15-150  4.500e-07   9.482e-08
Double BB

Spectral model: bbodyrad<1> + bbodyrad<2>
------------------------------------------------------------
Parameters  : value         Lower 90%    Upper 90%
kT1 [keV]   : 5.93692        (-5.93692      1.01104)
R1^2/D10^2  : 0.247450        (-0.119151      0.351275)
kT2 [keV]   : 34.7977        (-34.801      -34.801)
R2^2/D10^2  : 8.05908E-05    (-8.05729e-05   0.00402938)
------------------------------------------------------------
#Fit statistic : Chi-Squared =          58.72 using 59 PHA bins.
# Reduced chi-squared =          1.068 for     55 degrees of freedom
# Null hypothesis probability =   3.408057e-01

Energy  Fluence     90% Error
[keV]   [erg/cm2]   [erg/cm2]
15- 25  1.824e-07   5.609e-08
25- 50  1.899e-07   7.319e-08
50-150  1.291e-07   7.679e-08
15-150  5.013e-07   1.736e-07
Peak spectrum fit
Power-law model
Time interval is from  116.656 sec. to  117.656 sec.

Spectral model in power-law:
------------------------------------------------------------
Parameters  : value       lower 90%   higher 90%
Photon index: 2.26631     ( -0.724596   1.04133 )
Norm@50keV  : 1.61851E-03    ( -0.00102026   0.000985605 )
------------------------------------------------------------
#Fit statistic : Chi-Squared =          54.68 using 59 PHA bins.
# Reduced chi-squared =         0.9594 for     57 degrees of freedom
# Null hypothesis probability =   5.624452e-01

Photon flux (15-150 keV)    in 1 sec: 0.277644 ( -0.112108  0.112291 ) ph/cm2/s
Energy fluence (15-150 keV)             : 1.53747e-08 ( -7.64179e-09  8.57677e-09 ) ergs/cm2
Cutoff power-law model
Time interval is from  116.656 sec. to  117.656 sec.
Spectral model in the cutoff power-law:
------------------------------------------------------------
Parameters  : value       lower 90%   higher 90%
Photon index: 1.70856     (     )
Epeak [keV] : 20.1213      (   )
Norm@50keV  : 3.58089E-03    (     )
------------------------------------------------------------
#Fit statistic : Chi-Squared =          54.54 using 59 PHA bins.
# Reduced chi-squared =         0.9739 for     56 degrees of freedom
# Null hypothesis probability =   5.303907e-01

Photon flux (15-150 keV)    in 1 sec: 0.276194 ( -0.11089  0.111585 ) ph/cm2/s
Energy fluence (15-150 keV)             : 1.47236e-08 ( -7.42963e-09  8.9665e-09 ) ergs/cm2
Band function

Time interval is from  116.656 sec. to  117.656 sec.

Spectral model in the Band function:
------------------------------------------------------------
Parameters  : value       lower 90%   higher 90%
alpha       : -1.99787   ( -0.00212279   0.216727 )
beta        : -9.37165    ( 9.37167   19.3717 )
Epeak [keV] : 0.280098      ( -0.280098 -0.280098 )
Norm@50keV   : 2.42477E-03    ( -0.000967369   0.000967369 )
------------------------------------------------------------
#Fit statistic : Chi-Squared =          54.57 using 59 PHA bins.
# Reduced chi-squared =         0.9922 for     55 degrees of freedom
# Null hypothesis probability =   4.909993e-01

Photon flux (15-150 keV)    in 1 sec:  (    ) ph/cm2/s
Energy fluence (15-150 keV)             : 1.46441e-08 ( -1.46371e-08  -7.33118e-09 ) ergs/cm2
Single BB
Spectral model blackbody:
------------------------------------------------------------
Parameters  : value    Lower 90%  Upper 90%
kT [keV]    : 8.02775  (  )
R^2/D10^2   : 0.298872  (-0.299125   9.26098)
(R is the radius in km and D10 is the distance to the source in units of 10 kpc)
------------------------------------------------------------
#Fit statistic : Chi-Squared =          56.83 using 59 PHA bins.
# Reduced chi-squared =         0.9971 for     57 degrees of freedom
# Null hypothesis probability =   4.813320e-01

Energy  Fluence     90% Error
[keV]   [erg/cm2]   [erg/cm2]
15- 25  3.837e-09   2.571e-09
25- 50  5.704e-09   3.587e-09
50-150  1.102e-09   9.645e-10
15-150  1.064e-08   7.205e-09
Thermal bremsstrahlung (OTTB)

Spectral model: thermal bremsstrahlung
------------------------------------------------------------
Parameters  : value         Lower 90%    Upper 90%
kT [keV]    : 43.9721       (-43.9721      -43.9721)
Norm        : 1.72324       (-0.900026     2.88679)
------------------------------------------------------------
#Fit statistic : Chi-Squared =          54.60 using 59 PHA bins.
# Reduced chi-squared =         0.9578 for     57 degrees of freedom
# Null hypothesis probability =   5.658042e-01

Energy  Fluence     90% Error
[keV]   [erg/cm2]   [erg/cm2]
15- 25  4.076e-09   2.656e-09
25- 50  5.577e-09   3.647e-09
50-150  4.771e-09   4.201e-09
15-150  1.442e-08   1.005e-08
Double BB

Spectral model: bbodyrad<1> + bbodyrad<2>
------------------------------------------------------------
Parameters  : value         Lower 90%    Upper 90%
kT1 [keV]   : 4.00883        (-1.85882      4.2928)
R1^2/D10^2  : 3.93761        (-3.75177      689.559)
kT2 [keV]   : 15.3169        (-7.54846      51.0974)
R2^2/D10^2  : 1.77463E-02    (-0.0176319   0.290891)
------------------------------------------------------------
#Fit statistic : Chi-Squared =          53.64 using 59 PHA bins.
# Reduced chi-squared =         0.9754 for     55 degrees of freedom
# Null hypothesis probability =   5.265418e-01

Energy  Fluence     90% Error
[keV]   [erg/cm2]   [erg/cm2]
15- 25  4.488e-09   2.507e-09
25- 50  4.832e-09   2.634e-09
50-150  5.684e-09   4.353e-09
15-150  1.500e-08   7.845e-09
Pre-slew spectrum (Pre-slew PHA with pre-slew DRM)
Power-law model

Spectral model in power-law:
------------------------------------------------------------
Parameters  : value       lower 90%   higher 90%
Photon index: 2.39888     ( -0.335963   0.383686 )
Norm@50keV  : 3.55679E-04    ( -0.000100892   0.000101392 )
------------------------------------------------------------
#Fit statistic : Chi-Squared =          49.24 using 59 PHA bins.
# Reduced chi-squared =         0.8638 for     57 degrees of freedom
# Null hypothesis probability =   7.580047e-01

Photon flux (15-150 keV)    in 107.8 sec: 6.57663E-02 ( -0.011228  0.0112422 ) ph/cm2/s
Energy fluence (15-150 keV)             : 3.73927e-07 ( -8.17337e-08  8.73417e-08 ) ergs/cm2
Cutoff power-law model
Spectral model in the cutoff power-law:
------------------------------------------------------------
Parameters  : value       lower 90%   higher 90%
Photon index: -2.27095     ( -6.91319   3.04493 )
Epeak [keV] : 26.3514      ( -17.9694 4.91067 )
Norm@50keV  : 0.700393    (     )
------------------------------------------------------------
#Fit statistic : Chi-Squared =          44.87 using 59 PHA bins.
# Reduced chi-squared =         0.8013 for     56 degrees of freedom
# Null hypothesis probability =   8.569063e-01

Photon flux (15-150 keV)    in 107.8 sec: 6.08036E-02 ( -0.010809  0.0110476 ) ph/cm2/s
Energy fluence (15-150 keV)             : 2.75355e-07 ( -5.48756e-08  8.79422e-08 ) ergs/cm2
Band function

Spectral model in the Band function:
------------------------------------------------------------
Parameters  : value       lower 90%   higher 90%
alpha       : 2.91113   ( -2.72143   -4.25205 )
beta        : -3.82391    ( 3.69799   1.18296 )
Epeak [keV] : 26.1006      ( -5.52014 3.87812 )
Norm@50keV   : 2.11949    ( -2.11579   30.28 )
------------------------------------------------------------
#Fit statistic : Chi-Squared =          43.46 using 59 PHA bins.
# Reduced chi-squared =         0.7901 for     55 degrees of freedom
# Null hypothesis probability =   8.694357e-01

Photon flux (15-150 keV)    in 107.8 sec:  (    ) ph/cm2/s
Energy fluence (15-150 keV)             : 0 ( 0  0 ) ergs/cm2
S(25-50 keV) vs. S(50-100 keV) plot
S(25-50 keV)  = 1.72e-07
S(50-100 keV) = 1.11e-07
T90 vs. Hardness ratio plot
T90                                   = 147.463999986649 sec.
Hardness ratio (energy fluence ratio) = 0.645349
Color vs. Color plot

Count Ratio  (25-50 keV) / (15-25 keV) = 0.728689
Count Ratio (50-100 keV) / (15-25 keV) = 0.208187
Mask shadow pattern

IMX = -0.298555488698, IMY = 0.0600518052595
TIME vs. PHA plot around the trigger time

Blue+Cyan dotted lines: Time interval of the scaled map
From 0.000000 to 64.000000
TIME vs. DetID plot around the trigger time

Blue+Cyan dotted lines: Time interval of the scaled map
From 0.000000 to 64.000000
100 us light curve (15-350 keV)

Blue+Cyan dotted lines: Time interval of the scaled map
From 0.000000 to 64.000000
Spacecraft aspect plot

Bright source in the pre-burst/pre-slew/post-slew images
Pre-burst image of 15-350 keV band
Time interval of the image:
-82.099400 -35.068000

# RAcent  DECcent POSerr Theta    Phi  PeakCts   SNR AngSep     Name
#  [deg]    [deg]    ['] [deg]  [deg]                   [']
135.4350 -40.7113    5.0  17.8  128.3   0.1589   2.3   10.3	Vela X-1
111.2492 -51.2407    2.1  34.7  152.3   0.5558   5.6 ------	UNKNOWN
 76.8073 -32.9503    2.1  53.8 -171.7   1.1225   5.5 ------	UNKNOWN
116.0381  -0.9085    2.3  30.4 -103.1   0.4951   5.1 ------	UNKNOWN
 92.3055  -3.1463    2.5  48.0 -129.2   1.3407   4.6 ------	UNKNOWN
Pre-slew background subtracted image of 15-350 keV band
Time interval of the image:
-35.068000 72.700610

# RAcent  DECcent POSerr Theta    Phi  PeakCts   SNR AngSep     Name
#  [deg]    [deg]    ['] [deg]  [deg]                   [']
135.6002 -40.6236    5.6  17.7  127.9  -0.3696  -2.1    5.3	Vela X-1
Post-slew image of 15-350 keV band
Time interval of the image:
122.900600 963.107000

# RAcent  DECcent POSerr Theta    Phi  PeakCts   SNR AngSep     Name
#  [deg]    [deg]    ['] [deg]  [deg]                   [']
135.5595 -40.5243  141.2  17.9   47.3  -0.0361  -0.1    2.3	Vela X-1
 61.1719 -39.1432    4.0  48.9  151.4   5.1655   2.9 ------	UNKNOWN
 69.4408 -43.8812    3.0  42.7  144.9   4.2534   3.8 ------	UNKNOWN
 88.4029 -50.4963    3.3  32.3  128.2   2.3581   3.6 ------	UNKNOWN
156.5861 -20.3809    2.4  34.5   -4.8   2.7738   4.8 ------	UNKNOWN
 64.6077  -3.9674    3.0  57.5 -165.4   9.4409   3.8 ------	UNKNOWN
116.1371   2.2322    2.8  30.7  -96.6   2.9881   4.1 ------	UNKNOWN
117.1341  12.4810    3.6  40.9  -93.5   8.0299   3.2 ------	UNKNOWN
Plot creation:
Wed Jul 22 00:24:05 EDT 2015