Click here for the BAT GCN circular template
Image
Pre-slew 15.0-350.0 keV image (Event data)

#   RAcent    DECcent   POSerr    Theta     Phi              Peak Cts       SNR   Name
   97.5500   -19.1500   0.0143    37.4735  -139.7054         1.2131293     13.447 TRIG_00650141

Foreground time interval of the image:
 -1.072  29.421 (delta_t =  30.493 [sec])
Background time interval of the image:
-156.479  -1.072 (delta_t = 155.407 [sec])
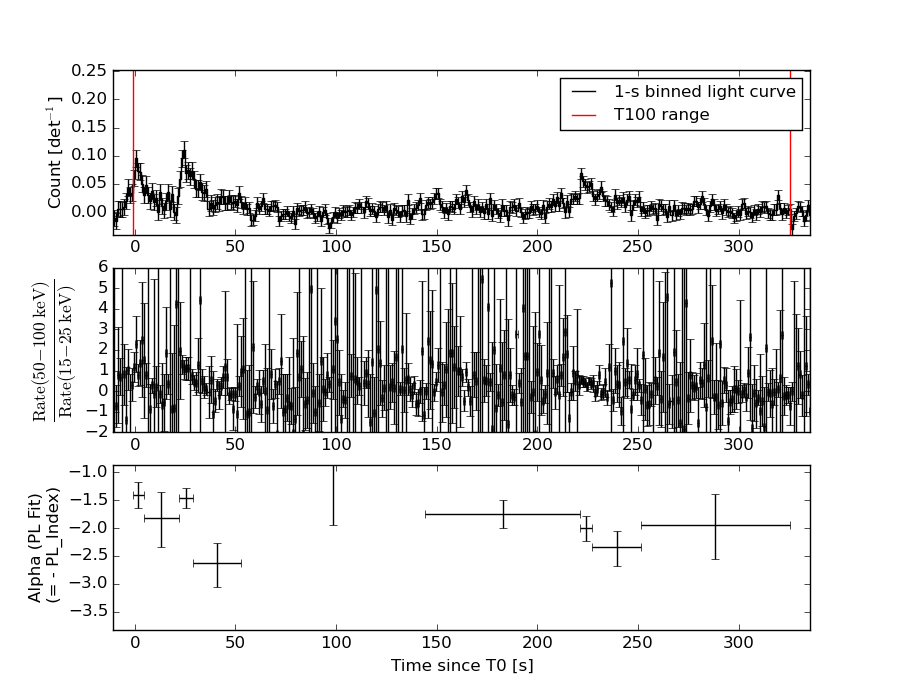
Lightcurves
Notes:
- 1) The mask-weighted light curves are using the flight position.
- 2) Multiple plots of different time binning/intervals are shown to cover all scenarios of short/long GRBs, rate/image triggers, and real/false positives.
- 3) For all the mask-weighted lightcurves, the y-axis units are counts/sec/det where a det is 0.4 x 0.4 = 0.16 sq cm.
- 4) The verticle lines correspond to following: green dotted lines are T50 interval, black dotted lines are T90 interval, blue solid line(s) is a spacecraft slew start time, and orange solid line(s) is a spacecraft slew end time.
- 5) Time of each bin is in the middle of the bin.
1 s binning
From T0-310 s to T0+310 s
From T100_start - 20 s to T100_end + 30 s
Full time interval
64 ms binning
Full time interval
From T100_start to T100_end

From T0-5 sec to T0+5 sec
16 ms binning
From T100_start-5 s to T100_start+5 s
Blue+Cyan dotted lines: Time interval of the scaled map
From 0.000000 to 2.048000
8 ms binning
From T100_start-3 s to T100_start+3 s

Blue+Cyan dotted lines: Time interval of the scaled map
From 0.000000 to 2.048000
2 ms binning
From T100_start-1 s to T100_start+1 s

Blue+Cyan dotted lines: Time interval of the scaled map
From 0.000000 to 2.048000
SN=5 or 10 sec. binning (whichever binning is satisfied first)
SN=5 or 10 sec. binning (T < 200 sec)
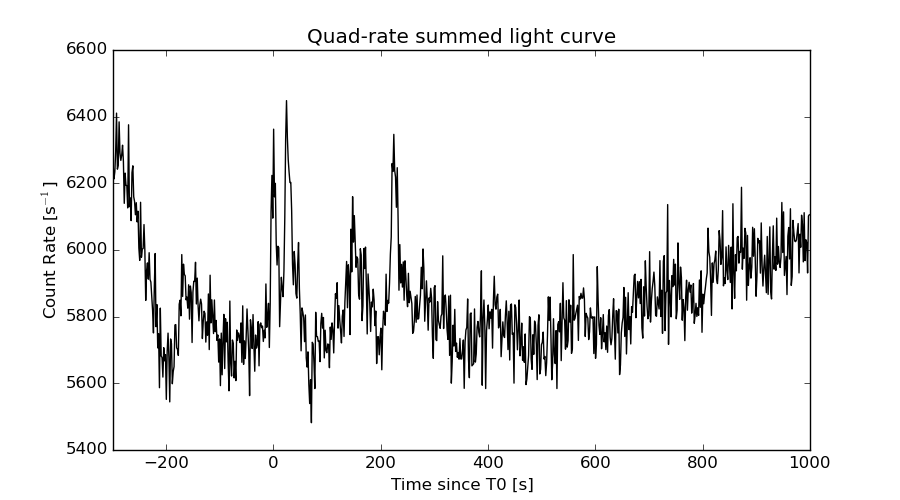
Quad-rate summed light curves (from T0-300s to T0+1000s)
Spectral Evolution
Spectra
Notes:
- 1) The fitting includes the systematic errors.
- 2) When the burst includes telescope slew time periods, the fitting uses an average response file made from multiple 5-s response files through out the slew time plus single time preiod for the non-slew times, and weighted by the total counts in the corresponding time period using addrmf. An average response file is needed becuase a spectral fit using the pre-slew DRM will introduce some errors in both a spectral shape and a normalization if the PHA file contains a lot of the slew/post-slew time interval.
- 3) For fits to more complicated models (e.g. a power-law over a cutoff power-law), the BAT team has decided to require a chi-square improvement of more than 6 for each extra dof.
Time averaged spectrum fit using the average DRM
Power-law model

Time interval is from   -1.072 sec. to  325.420 sec.

Spectral model in power-law:
------------------------------------------------------------
Parameters  : value       lower 90%   higher 90%
Photon index: 1.99132     ( -0.142559   0.14771 )
Norm@50keV  : 7.06841E-04    ( -6.71842e-05   6.60973e-05 )
------------------------------------------------------------
#Fit statistic : Chi-Squared =          69.28 using 59 PHA bins.
# Reduced chi-squared =          1.215 for     57 degrees of freedom
# Null hypothesis probability =   1.275057e-01

Photon flux (15-150 keV)    in 326.5 sec: 0.105605 ( -0.0081702  0.00817498 ) ph/cm2/s
Energy fluence (15-150 keV)             : 2.12733e-06 ( -1.90749e-07  1.93326e-07 ) ergs/cm2
Cutoff power-law model
Time interval is from   -1.072 sec. to  325.420 sec.
Spectral model in the cutoff power-law:
------------------------------------------------------------
Parameters  : value       lower 90%   higher 90%
Photon index: 1.43177     ( -0.784139   0.646561 )
Epeak [keV] : 42.1232      ( -39.6545 -42.1232 )
Norm@50keV  : 1.48892E-03    ( -0.000846625   0.00276549 )
------------------------------------------------------------
#Fit statistic : Chi-Squared =          67.18 using 59 PHA bins.
# Reduced chi-squared =          1.200 for     56 degrees of freedom
# Null hypothesis probability =   1.455662e-01

Photon flux (15-150 keV)    in 326.5 sec: 0.103096 ( -0.0085045  0.00867 ) ph/cm2/s
Energy fluence (15-150 keV)             : 2.00193e-06 ( -2.32125e-07  1.29271e-07 ) ergs/cm2
Band function
Time interval is from   -1.072 sec. to  325.420 sec.

Spectral model in the Band function:
------------------------------------------------------------
Parameters  : value       lower 90%   higher 90%
alpha       : -0.821563   ( -1.07608   2.73321 )
beta        : -2.32866    ( 2.35823   0.35624 )
Epeak [keV] : 36.1592      ( -11.6106 16.4231 )
Norm@50keV   : 3.75866E-03    ( -0.00430619   0.31962 )
------------------------------------------------------------
#Fit statistic : Chi-Squared =          65.13 using 59 PHA bins.
# Reduced chi-squared =          1.184 for     55 degrees of freedom
# Null hypothesis probability =   1.648287e-01

Photon flux (15-150 keV)    in 326.5 sec:  (    ) ph/cm2/s
Energy fluence (15-150 keV)             : 2.01917e-06 ( -2.01689e-06  -2.09717e-07 ) ergs/cm2
Single BB
Spectral model blackbody:
------------------------------------------------------------
Parameters  : value    Lower 90%  Upper 90%
kT [keV]    : 9.86694  (-0.827724  0.914141)
R^2/D10^2   : 5.13661E-02  (-0.0150094   0.0208808)
(R is the radius in km and D10 is the distance to the source in units of 10 kpc)
------------------------------------------------------------
#Fit statistic : Chi-Squared =          91.81 using 59 PHA bins.
# Reduced chi-squared =          1.611 for     57 degrees of freedom
# Null hypothesis probability =   2.375146e-03

Energy  Fluence     90% Error
[keV]   [erg/cm2]   [erg/cm2]
15- 25  3.310e-07   4.538e-08
25- 50  8.073e-07   7.281e-08
50-150  4.053e-07   8.164e-08
15-150  1.544e-06   1.422e-07
Thermal bremsstrahlung (OTTB)
Spectral model: thermal bremsstrahlung
------------------------------------------------------------
Parameters  : value         Lower 90%    Upper 90%
kT [keV]    : 66.3496       (-14.3994      20.7843)
Norm        : 0.528474       (-0.0659221     0.0752161)
------------------------------------------------------------
#Fit statistic : Chi-Squared =          67.18 using 59 PHA bins.
# Reduced chi-squared =          1.179 for     57 degrees of freedom
# Null hypothesis probability =   1.676160e-01

Energy  Fluence     90% Error
[keV]   [erg/cm2]   [erg/cm2]
15- 25  4.400e-07   4.636e-08
25- 50  6.897e-07   5.436e-08
50-150  8.507e-07   1.654e-07
15-150  1.980e-06   1.987e-07
Double BB

Spectral model: bbodyrad<1> + bbodyrad<2>
------------------------------------------------------------
Parameters  : value         Lower 90%    Upper 90%
kT1 [keV]   : 7.72855        (-1.96614      1.4968)
R1^2/D10^2  : 0.111027        (-0.0488475      0.110298)
kT2 [keV]   : 32.7888        (-17.1702      -33.8026)
R2^2/D10^2  : 3.26454E-04    (-0.000267824   0.00275545)
------------------------------------------------------------
#Fit statistic : Chi-Squared =          67.46 using 59 PHA bins.
# Reduced chi-squared =          1.227 for     55 degrees of freedom
# Null hypothesis probability =   1.207301e-01

Energy  Fluence     90% Error
[keV]   [erg/cm2]   [erg/cm2]
15- 25  3.981e-07   7.689e-08
25- 50  7.360e-07   1.549e-07
50-150  9.366e-07   4.656e-07
15-150  2.071e-06   6.008e-07
Peak spectrum fit
Power-law model
Time interval is from   24.084 sec. to   25.084 sec.

Spectral model in power-law:
------------------------------------------------------------
Parameters  : value       lower 90%   higher 90%
Photon index: 1.64020     ( -0.361876   0.37413 )
Norm@50keV  : 7.28116E-03    ( -0.00169936   0.00167115 )
------------------------------------------------------------
#Fit statistic : Chi-Squared =          53.60 using 59 PHA bins.
# Reduced chi-squared =         0.9403 for     57 degrees of freedom
# Null hypothesis probability =   6.034373e-01

Photon flux (15-150 keV)    in 1 sec: 0.947692 ( -0.213821  0.21433 ) ph/cm2/s
Energy fluence (15-150 keV)             : 6.77852e-08 ( -1.64321e-08  1.66723e-08 ) ergs/cm2
Cutoff power-law model
Time interval is from   24.084 sec. to   25.084 sec.
Spectral model in the cutoff power-law:
------------------------------------------------------------
Parameters  : value       lower 90%   higher 90%
Photon index: 1.01966     ( -1.90594   0.95142 )
Epeak [keV] : 75.7865      (   )
Norm@50keV  : 1.55330E-02    (     )
------------------------------------------------------------
#Fit statistic : Chi-Squared =          53.06 using 59 PHA bins.
# Reduced chi-squared =         0.9474 for     56 degrees of freedom
# Null hypothesis probability =   5.870442e-01

Photon flux (15-150 keV)    in 1 sec: 0.933329 ( -0.216876  0.216981 ) ph/cm2/s
Energy fluence (15-150 keV)             : 6.53488e-08 ( -1.73591e-08  1.76246e-08 ) ergs/cm2
Band function
Time interval is from   24.084 sec. to   25.084 sec.

Spectral model in the Band function:
------------------------------------------------------------
Parameters  : value       lower 90%   higher 90%
alpha       : -1.04226   ( -0.926268   1.52792 )
beta        : -9.37127    ( 9.37161   19.3716 )
Epeak [keV] : 77.3732      ( -34.8768 -77.2951 )
Norm@50keV   : 1.50567E-02    ( -0.00851197   0.0184979 )
------------------------------------------------------------
#Fit statistic : Chi-Squared =          53.06 using 59 PHA bins.
# Reduced chi-squared =         0.9647 for     55 degrees of freedom
# Null hypothesis probability =   5.492407e-01

Photon flux (15-150 keV)    in 1 sec: 0.933392 (    ) ph/cm2/s
Energy fluence (15-150 keV)             : 6.55177e-08 ( 0  0 ) ergs/cm2
Single BB
Spectral model blackbody:
------------------------------------------------------------
Parameters  : value    Lower 90%  Upper 90%
kT [keV]    : 13.5091  (-3.29477  4.27453)
R^2/D10^2   : 0.157377  (-0.100252   0.273601)
(R is the radius in km and D10 is the distance to the source in units of 10 kpc)
------------------------------------------------------------
#Fit statistic : Chi-Squared =          57.32 using 59 PHA bins.
# Reduced chi-squared =          1.006 for     57 degrees of freedom
# Null hypothesis probability =   4.632036e-01

Energy  Fluence     90% Error
[keV]   [erg/cm2]   [erg/cm2]
15- 25  6.083e-09   2.861e-09
25- 50  2.182e-08   8.322e-09
50-150  2.573e-08   1.310e-08
15-150  5.363e-08   2.252e-08
Thermal bremsstrahlung (OTTB)

Spectral model: thermal bremsstrahlung
------------------------------------------------------------
Parameters  : value         Lower 90%    Upper 90%
kT [keV]    : 163.137       (-94.9926      -160.664)
Norm        : 3.91077       (-0.905858     1.34196)
------------------------------------------------------------
#Fit statistic : Chi-Squared =          53.15 using 59 PHA bins.
# Reduced chi-squared =         0.9324 for     57 degrees of freedom
# Null hypothesis probability =   6.203856e-01

Energy  Fluence     90% Error
[keV]   [erg/cm2]   [erg/cm2]
15- 25  9.967e-09   5.775e-09
25- 50  1.869e-08   1.048e-08
50-150  3.816e-08   2.307e-08
15-150  6.682e-08   3.876e-08
Double BB
Spectral model: bbodyrad<1> + bbodyrad<2>
------------------------------------------------------------
Parameters  : value         Lower 90%    Upper 90%
kT1 [keV]   : 7.19343        (-3.9546      -7.20206)
R1^2/D10^2  : 0.991978        (-0.824177      16.0926)
kT2 [keV]   : 24.6430        (-21.462      -24.7083)
R2^2/D10^2  : 1.25843E-02    (-0.012409   0.117214)
------------------------------------------------------------
#Fit statistic : Chi-Squared =          52.69 using 59 PHA bins.
# Reduced chi-squared =         0.9581 for     55 degrees of freedom
# Null hypothesis probability =   5.632350e-01

Energy  Fluence     90% Error
[keV]   [erg/cm2]   [erg/cm2]
15- 25  9.813e-09   5.905e-09
25- 50  1.976e-08   1.081e-08
50-150  3.622e-08   2.136e-08
15-150  6.580e-08   3.380e-08
Pre-slew spectrum (Pre-slew PHA with pre-slew DRM)
Power-law model

Spectral model in power-law:
------------------------------------------------------------
Parameters  : value       lower 90%   higher 90%
Photon index: 1.54344     ( -0.164581   0.165045 )
Norm@50keV  : 2.94307E-03    ( -0.000297019   0.000296086 )
------------------------------------------------------------
#Fit statistic : Chi-Squared =          62.91 using 59 PHA bins.
# Reduced chi-squared =          1.104 for     57 degrees of freedom
# Null hypothesis probability =   2.750930e-01

Photon flux (15-150 keV)    in 30.49 sec: 0.371873 ( -0.0380924  0.0381853 ) ph/cm2/s
Energy fluence (15-150 keV)             : 8.45564e-07 ( -9.09175e-08  9.15584e-08 ) ergs/cm2
Cutoff power-law model

Spectral model in the cutoff power-law:
------------------------------------------------------------
Parameters  : value       lower 90%   higher 90%
Photon index: 0.706698     ( -0.843023   0.707084 )
Epeak [keV] : 75.0167      ( -17.7866 128.855 )
Norm@50keV  : 7.98163E-03    ( -0.0044797   0.0135138 )
------------------------------------------------------------
#Fit statistic : Chi-Squared =          58.74 using 59 PHA bins.
# Reduced chi-squared =          1.049 for     56 degrees of freedom
# Null hypothesis probability =   3.754555e-01

Photon flux (15-150 keV)    in 30.49 sec: 0.360088 ( -0.039421  0.039477 ) ph/cm2/s
Energy fluence (15-150 keV)             : 7.95353e-07 ( -1.00599e-07  1.01504e-07 ) ergs/cm2
Band function
Spectral model in the Band function:
------------------------------------------------------------
Parameters  : value       lower 90%   higher 90%
alpha       : 4.75825   ( -5.28605   -4.75825 )
beta        : -1.83568    ( -0.257543   0.231623 )
Epeak [keV] : 31.4877      ( -5.64013 4.66054 )
Norm@50keV   : 57.5436    ( -5.61102   216.3 )
------------------------------------------------------------
#Fit statistic : Chi-Squared =          55.38 using 59 PHA bins.
# Reduced chi-squared =          1.007 for     55 degrees of freedom
# Null hypothesis probability =   4.601982e-01

Photon flux (15-150 keV)    in 30.49 sec:  (    ) ph/cm2/s
Energy fluence (15-150 keV)             : 8.12113e-07 ( 0  0 ) ergs/cm2
S(25-50 keV) vs. S(50-100 keV) plot
S(25-50 keV)  = 6.39e-07
S(50-100 keV) = 6.43e-07
T90 vs. Hardness ratio plot
T90                                   = 280.007999956608 sec.
Hardness ratio (energy fluence ratio) = 1.00626
Color vs. Color plot
Count Ratio  (25-50 keV) / (15-25 keV) = 1.14687
Count Ratio (50-100 keV) / (15-25 keV) = 0.481595
Mask shadow pattern

IMX = -5.847028009758013E-01, IMY = 4.957694187770598E-01
TIME vs. PHA plot around the trigger time
Blue+Cyan dotted lines: Time interval of the scaled map
From 0.000000 to 2.048000
TIME vs. DetID plot around the trigger time
Blue+Cyan dotted lines: Time interval of the scaled map
From 0.000000 to 2.048000
100 us light curve (15-350 keV)
Blue+Cyan dotted lines: Time interval of the scaled map
From 0.000000 to 2.048000
Spacecraft aspect plot
Bright source in the pre-burst/pre-slew/post-slew images
Pre-burst image of 15-350 keV band
Time interval of the image:
-156.479410 -1.072000

# RAcent  DECcent POSerr Theta    Phi  PeakCts   SNR AngSep     Name
#  [deg]    [deg]    ['] [deg]  [deg]                   [']
135.4984 -40.5544    0.9   5.9  -40.4   1.6006  12.7    1.4	Vela X-1
170.3035 -60.5685    3.5  28.1   55.2   0.6217   3.3    3.3	Cen X-3
186.8845 -62.7841   21.1  36.2   57.0  -0.1675  -0.6    6.3	GX 301-2
 75.1641 -28.9110    2.3  45.9 -171.6   1.2076   5.0 ------	UNKNOWN
Pre-slew background subtracted image of 15-350 keV band
Time interval of the image:
-1.072000 29.420610

# RAcent  DECcent POSerr Theta    Phi  PeakCts   SNR AngSep     Name
#  [deg]    [deg]    ['] [deg]  [deg]                   [']
135.3724 -40.7293    0.0   5.7  -40.1   0.1608   2.9   12.7	Vela X-1
170.6793 -60.6529    4.7  28.3   55.2   0.1866   2.4   10.8	Cen X-3
186.9888 -62.7297    4.8  36.2   56.9   0.2957   2.4    9.4	GX 301-2
 66.6817 -40.7863    3.0  45.5  169.1   0.4874   3.8 ------	UNKNOWN
162.5606 -39.4190    2.2  24.4    5.4   0.3345   5.4 ------	UNKNOWN
 97.5496 -19.1503    0.9  37.5 -139.7   1.2126  13.4 ------	UNKNOWN
137.3155  -3.2399    1.8  42.3  -72.2   1.5340   6.3 ------	UNKNOWN
Post-slew image of 15-350 keV band
Time interval of the image:
91.620610 782.210300
840.120000 902.221600

# RAcent  DECcent POSerr Theta    Phi  PeakCts   SNR AngSep     Name
#  [deg]    [deg]    ['] [deg]  [deg]                   [']
 83.6372  22.0173    0.3  43.4 -143.0  30.5063  34.8    0.3	Crab
135.5264 -40.5603    0.8  38.8    7.7   8.6502  14.0    0.4	Vela X-1
 46.3413 -13.7108    2.8  49.3  144.1   9.5939   4.1 ------	UNKNOWN
127.5343 -42.9988    3.2  34.7   16.0   2.1770   3.6 ------	UNKNOWN
102.5352 -32.0939    2.7  13.7   37.8   1.7210   4.3 ------	UNKNOWN
 86.2235 -10.4236    3.2  14.0 -177.0   1.4456   3.6 ------	UNKNOWN
 54.6037  19.5828    2.9  57.2 -173.8   9.3291   4.0 ------	UNKNOWN
 56.5157  21.8993    3.2  57.4 -170.4   7.3067   3.6 ------	UNKNOWN
Plot creation:
Sat Aug  8 00:28:01 EDT 2015