Special notes of this burst
Image
Pre-slew 15.0-350.0 keV image (Event data)
#   RAcent    DECcent   POSerr    Theta     Phi              Peak Cts       SNR   Name
  249.6341   -12.0520   0.0041    21.6837  -102.9729         3.8790332     46.937 TRIG_00652334

Foreground time interval of the image:
-16.764  10.117 (delta_t =  26.881 [sec])
Background time interval of the image:
-154.283 -16.764 (delta_t = 137.519 [sec])
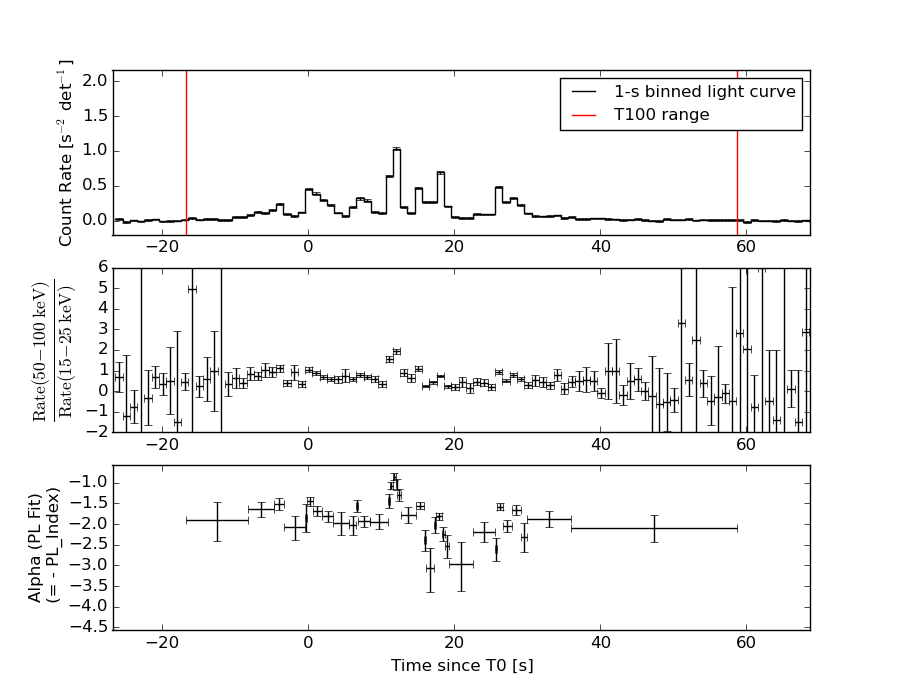
Lightcurves
Notes:
- 1) The mask-weighted light curves are using the flight position.
- 2) Multiple plots of different time binning/intervals are shown to cover all scenarios of short/long GRBs, rate/image triggers, and real/false positives.
- 3) For all the mask-weighted lightcurves, the y-axis units are counts/sec/det where a det is 0.4 x 0.4 = 0.16 sq cm.
- 4) The verticle lines correspond to following: green dotted lines are T50 interval, black dotted lines are T90 interval, blue solid line(s) is a spacecraft slew start time, and orange solid line(s) is a spacecraft slew end time.
- 5) Time of each bin is in the middle of the bin.
1 s binning
From T0-310 s to T0+310 s
From T100_start - 20 s to T100_end + 30 s
Full time interval

64 ms binning
Full time interval

From T100_start to T100_end
From T0-5 sec to T0+5 sec
16 ms binning
From T100_start-5 s to T100_start+5 s
8 ms binning
From T100_start-3 s to T100_start+3 s
2 ms binning
From T100_start-1 s to T100_start+1 s
SN=5 or 10 sec. binning (whichever binning is satisfied first)

SN=5 or 10 sec. binning (T < 200 sec)

Quad-rate summed light curves (from T0-300s to T0+1000s)

Spectral Evolution
Spectra
Notes:
- 1) The fitting includes the systematic errors.
- 2) When the burst includes telescope slew time periods, the fitting uses an average response file made from multiple 5-s response files through out the slew time plus single time preiod for the non-slew times, and weighted by the total counts in the corresponding time period using addrmf. An average response file is needed becuase a spectral fit using the pre-slew DRM will introduce some errors in both a spectral shape and a normalization if the PHA file contains a lot of the slew/post-slew time interval.
- 3) For fits to more complicated models (e.g. a power-law over a cutoff power-law), the BAT team has decided to require a chi-square improvement of more than 6 for each extra dof.
Time averaged spectrum fit using the average DRM
Power-law model

Time interval is from  -16.764 sec. to   58.732 sec.

Spectral model in power-law:
------------------------------------------------------------
Parameters  : value       lower 90%   higher 90%
Photon index: 1.77457     ( -0.0442923   0.0443759 )
Norm@50keV  : 8.54140E-03    ( -0.000192276   0.000192213 )
------------------------------------------------------------
#Fit statistic : Chi-Squared =          47.67 using 59 PHA bins.
# Reduced chi-squared =         0.8363 for     57 degrees of freedom
# Null hypothesis probability =   8.059732e-01

Photon flux (15-150 keV)    in 75.5 sec: 1.16558 ( -0.0306459  0.030792 ) ph/cm2/s
Energy fluence (15-150 keV)             : 5.94294e-06 ( -1.35764e-07  1.35851e-07 ) ergs/cm2
Cutoff power-law model

Time interval is from  -16.764 sec. to   58.732 sec.
Spectral model in the cutoff power-law:
------------------------------------------------------------
Parameters  : value       lower 90%   higher 90%
Photon index: 1.60532     ( -0.180304   0.172488 )
Epeak [keV] : 123.185      ( -37.7862 7881.65 )
Norm@50keV  : 1.02600E-02    ( -0.00161331   0.00215252 )
------------------------------------------------------------
#Fit statistic : Chi-Squared =          44.90 using 59 PHA bins.
# Reduced chi-squared =         0.8018 for     56 degrees of freedom
# Null hypothesis probability =   8.561870e-01

Photon flux (15-150 keV)    in 75.5 sec: 1.14770 ( -0.03512  0.03535 ) ph/cm2/s
Energy fluence (15-150 keV)             : 5.86528e-06 ( -1.58678e-07  1.57818e-07 ) ergs/cm2
Band function

Time interval is from  -16.764 sec. to   58.732 sec.

Spectral model in the Band function:
------------------------------------------------------------
Parameters  : value       lower 90%   higher 90%
alpha       : -0.945401   ( -0.676917   4.57381 )
beta        : -1.85382    ( -0.0844292   0.070623 )
Epeak [keV] : 46.7790      ( -17.2973 30.9108 )
Norm@50keV   : 2.62564E-02    ( -0.0366678   50.7832 )
------------------------------------------------------------
#Fit statistic : Chi-Squared =          39.27 using 59 PHA bins.
# Reduced chi-squared =         0.7141 for     55 degrees of freedom
# Null hypothesis probability =   9.459796e-01

Photon flux (15-150 keV)    in 75.5 sec:  (    ) ph/cm2/s
Energy fluence (15-150 keV)             : 5.8061e-06 ( -5.80557e-06  -1.54277e-07 ) ergs/cm2
Single BB
Spectral model blackbody:
------------------------------------------------------------
Parameters  : value    Lower 90%  Upper 90%
kT [keV]    : 14.2739  (  )
R^2/D10^2   : 0.138270  (   )
(R is the radius in km and D10 is the distance to the source in units of 10 kpc)
------------------------------------------------------------
#Fit statistic : Chi-Squared =         480.39 using 59 PHA bins.
# Reduced chi-squared =         8.4280 for     57 degrees of freedom
# Null hypothesis probability =   2.775160e-68

Energy  Fluence     90% Error
[keV]   [erg/cm2]   [erg/cm2]
15- 25  4.484e-07   2.261e-08
25- 50  1.700e-06   4.945e-08
50-150  2.303e-06   9.815e-08
15-150  4.451e-06   1.114e-07
Thermal bremsstrahlung (OTTB)
Spectral model: thermal bremsstrahlung
------------------------------------------------------------
Parameters  : value         Lower 90%    Upper 90%
kT [keV]    : 123.714       (-10.6047      16.5214)
Norm        : 4.81658       (-0.182986     0.157508)
------------------------------------------------------------
#Fit statistic : Chi-Squared =          52.75 using 59 PHA bins.
# Reduced chi-squared =         0.9255 for     57 degrees of freedom
# Null hypothesis probability =   6.350560e-01

Energy  Fluence     90% Error
[keV]   [erg/cm2]   [erg/cm2]
15- 25  9.018e-07   4.832e-08
25- 50  1.643e-06   7.097e-08
50-150  3.091e-06   6.670e-07
15-150  5.636e-06   7.146e-07
Double BB
Spectral model: bbodyrad<1> + bbodyrad<2>
------------------------------------------------------------
Parameters  : value         Lower 90%    Upper 90%
kT1 [keV]   : 7.67387        (-0.555081      0.573768)
R1^2/D10^2  : 0.985445        (-0.216956      0.299935)
kT2 [keV]   : 28.1059        (-2.62464      3.37919)
R2^2/D10^2  : 8.66803E-03    (-0.00290509   0.00384887)
------------------------------------------------------------
#Fit statistic : Chi-Squared =          47.35 using 59 PHA bins.
# Reduced chi-squared =         0.8609 for     55 degrees of freedom
# Null hypothesis probability =   7.587025e-01

Energy  Fluence     90% Error
[keV]   [erg/cm2]   [erg/cm2]
15- 25  8.509e-07   6.568e-08
25- 50  1.751e-06   7.550e-08
50-150  3.165e-06   2.295e-07
15-150  5.767e-06   2.805e-07
Peak spectrum fit
Power-law model
Time interval is from   11.216 sec. to   12.216 sec.

Spectral model in power-law:
------------------------------------------------------------
Parameters  : value       lower 90%   higher 90%
Photon index: 0.940054     ( -0.0617734   0.0613719 )
Norm@50keV  : 8.36366E-02    ( -0.00287942   0.00287159 )
------------------------------------------------------------
#Fit statistic : Chi-Squared =          43.29 using 59 PHA bins.
# Reduced chi-squared =         0.7595 for     57 degrees of freedom
# Null hypothesis probability =   9.099384e-01

Photon flux (15-150 keV)    in 1 sec: 9.60625 ( -0.333529  0.333864 ) ph/cm2/s
Energy fluence (15-150 keV)             : 9.24393e-07 ( -3.42279e-08  3.42813e-08 ) ergs/cm2
Cutoff power-law model

Time interval is from   11.216 sec. to   12.216 sec.
Spectral model in the cutoff power-law:
------------------------------------------------------------
Parameters  : value       lower 90%   higher 90%
Photon index: 0.848700     ( -0.24112   0.116755 )
Epeak [keV] : 758.909      ( -758.909 -758.909 )
Norm@50keV  : 9.14667E-02    ( -0.013109   0.0235463 )
------------------------------------------------------------
#Fit statistic : Chi-Squared =          42.84 using 59 PHA bins.
# Reduced chi-squared =         0.7650 for     56 degrees of freedom
# Null hypothesis probability =   9.019059e-01

Photon flux (15-150 keV)    in 1 sec: 9.56827 ( -0.3459  0.34132 ) ph/cm2/s
Energy fluence (15-150 keV)             : 9.2187e-07 ( -3.5311e-08  3.4614e-08 ) ergs/cm2
Band function

Time interval is from   11.216 sec. to   12.216 sec.

Spectral model in the Band function:
------------------------------------------------------------
Parameters  : value       lower 90%   higher 90%
alpha       : -0.814341   ( 0.814341   0.814341 )
beta        : -0.940056    ( -0.0613672   0.0617819 )
Epeak [keV] : 40.5491      (   )
Norm@50keV   : 0.129107    (     )
------------------------------------------------------------
#Fit statistic : Chi-Squared =          43.29 using 59 PHA bins.
# Reduced chi-squared =         0.7871 for     55 degrees of freedom
# Null hypothesis probability =   8.733360e-01

Photon flux (15-150 keV)    in 1 sec:  (    ) ph/cm2/s
Energy fluence (15-150 keV)             : 0 ( 0  0 ) ergs/cm2
Single BB

Spectral model blackbody:
------------------------------------------------------------
Parameters  : value    Lower 90%  Upper 90%
kT [keV]    : 23.9022  (  )
R^2/D10^2   : 0.269627  (   )
(R is the radius in km and D10 is the distance to the source in units of 10 kpc)
------------------------------------------------------------
#Fit statistic : Chi-Squared =         188.07 using 59 PHA bins.
# Reduced chi-squared =         3.2995 for     57 degrees of freedom
# Null hypothesis probability =   6.534956e-16

Energy  Fluence     90% Error
[keV]   [erg/cm2]   [erg/cm2]
15- 25  2.739e-08   1.670e-09
25- 50  1.518e-07   8.300e-09
50-150  6.463e-07   3.675e-08
15-150  8.254e-07   3.345e-08
Thermal bremsstrahlung (OTTB)

Spectral model: thermal bremsstrahlung
------------------------------------------------------------
Parameters  : value         Lower 90%    Upper 90%
kT [keV]    : 199.363       (      )
Norm        : 38.7549       (     )
------------------------------------------------------------
#Fit statistic : Chi-Squared =         309.59 using 59 PHA bins.
# Reduced chi-squared =         5.4314 for     57 degrees of freedom
# Null hypothesis probability =   2.077955e-36

Energy  Fluence     90% Error
[keV]   [erg/cm2]   [erg/cm2]
15- 25  9.650e-08   3.395e-09
25- 50  1.856e-07   6.900e-09
50-150  4.071e-07   1.650e-08
15-150  6.893e-07   2.475e-08
Double BB
Spectral model: bbodyrad<1> + bbodyrad<2>
------------------------------------------------------------
Parameters  : value         Lower 90%    Upper 90%
kT1 [keV]   : 8.68489        (-1.30638      1.50152)
R1^2/D10^2  : 3.26704        (-1.20863      2.17152)
kT2 [keV]   : 38.3989        (-4.70013      7.25625)
R2^2/D10^2  : 5.61712E-02    (-0.0224639   0.0279441)
------------------------------------------------------------
#Fit statistic : Chi-Squared =          42.93 using 59 PHA bins.
# Reduced chi-squared =         0.7806 for     55 degrees of freedom
# Null hypothesis probability =   8.815644e-01

Energy  Fluence     90% Error
[keV]   [erg/cm2]   [erg/cm2]
15- 25  5.805e-08   9.645e-09
25- 50  1.686e-07   1.680e-08
50-150  7.054e-07   7.215e-08
15-150  9.321e-07   9.190e-08
Pre-slew spectrum (Pre-slew PHA with pre-slew DRM)
Power-law model

Spectral model in power-law:
------------------------------------------------------------
Parameters  : value       lower 90%   higher 90%
Photon index: 1.80336     ( -0.0655011   0.0659459 )
Norm@50keV  : 8.71965E-03    ( -0.0003089   0.000308037 )
------------------------------------------------------------
#Fit statistic : Chi-Squared =          39.74 using 59 PHA bins.
# Reduced chi-squared =         0.6972 for     57 degrees of freedom
# Null hypothesis probability =   9.601279e-01

Photon flux (15-150 keV)    in 26.88 sec: 1.20312 ( -0.0445343  0.0446894 ) ph/cm2/s
Energy fluence (15-150 keV)             : 2.1575e-06 ( -7.77579e-08  7.79571e-08 ) ergs/cm2
Cutoff power-law model
Spectral model in the cutoff power-law:
------------------------------------------------------------
Parameters  : value       lower 90%   higher 90%
Photon index: 1.55951     ( -0.263107   0.248138 )
Epeak [keV] : 89.8040      ( -23.7598 1914.66 )
Norm@50keV  : 1.15395E-02    ( -0.00278134   0.00396021 )
------------------------------------------------------------
#Fit statistic : Chi-Squared =          36.92 using 59 PHA bins.
# Reduced chi-squared =         0.6593 for     56 degrees of freedom
# Null hypothesis probability =   9.770495e-01

Photon flux (15-150 keV)    in 26.88 sec: 1.18150 ( -0.04917  0.04934 ) ph/cm2/s
Energy fluence (15-150 keV)             : 2.11367e-06 ( -8.99889e-08  8.97684e-08 ) ergs/cm2
Band function
Spectral model in the Band function:
------------------------------------------------------------
Parameters  : value       lower 90%   higher 90%
alpha       : 0.746304   ( -3.97119   -1.48257 )
beta        : -1.87727    ( -0.0948742   0.0858153 )
Epeak [keV] : 29.7599      ( -5.37888 34.637 )
Norm@50keV   : 0.535427    ( -0.532113   466.474 )
------------------------------------------------------------
#Fit statistic : Chi-Squared =          34.02 using 59 PHA bins.
# Reduced chi-squared =         0.6186 for     55 degrees of freedom
# Null hypothesis probability =   9.882883e-01

Photon flux (15-150 keV)    in 26.88 sec:  (    ) ph/cm2/s
Energy fluence (15-150 keV)             : 2.10996e-06 ( -2.10977e-06  -8.43306e-08 ) ergs/cm2
S(25-50 keV) vs. S(50-100 keV) plot
S(25-50 keV)  = 1.66e-06
S(50-100 keV) = 1.94e-06
T90 vs. Hardness ratio plot

T90                                   = 37.9959999322891 sec.
Hardness ratio (energy fluence ratio) = 1.16867
Color vs. Color plot
Count Ratio  (25-50 keV) / (15-25 keV) = 1.21295
Count Ratio (50-100 keV) / (15-25 keV) = 0.748051
Mask shadow pattern

IMX = -8.926171229124183E-02, IMY = 3.874711303892153E-01
TIME vs. PHA plot around the trigger time
TIME vs. DetID plot around the trigger time
100 us light curve (15-350 keV)
Spacecraft aspect plot

Bright source in the pre-burst/pre-slew/post-slew images
Pre-burst image of 15-350 keV band
Time interval of the image:
-154.283420 -16.764000

# RAcent  DECcent POSerr Theta    Phi  PeakCts   SNR AngSep     Name
#  [deg]    [deg]    ['] [deg]  [deg]                   [']
244.9887 -15.6387    0.5  26.9 -109.2   4.7844  23.7    0.5	Sco X-1
254.3189  35.2642    5.1  45.7  -18.7   0.5862   2.3    8.3	Her X-1
255.8897 -37.8533    9.7  33.3 -157.1  -0.1983  -1.2    4.6	4U 1700-377
256.5807 -36.5831   21.5  31.9 -156.8  -0.0835  -0.5   11.9	GX 349+2
262.8521 -24.6395    3.0  18.8 -155.3   0.5662   3.9   10.7	GX 1+4
264.5758 -44.2994    5.5  37.2 -171.5   0.3908   2.1   11.5	4U 1735-44
268.2200  -1.5005    7.8   6.8  -25.4  -0.2160  -1.5    9.3	SW J1753.5-0127
270.2611 -25.0525    7.6  17.5 -176.6   0.2026   1.5    2.0	GX 5-1
270.2517 -25.7882    3.1  18.2 -176.7   0.5048   3.7    3.9	GRS 1758-258
274.0745 -13.8850    3.4   6.9  156.6   0.4732   3.4    9.9	GX 17+2
275.7609 -30.2244    0.0  23.0  170.5   0.0814   0.6   12.1	H1820-303
284.8719 -24.7900    0.0  21.6  145.0   0.2255   1.4   11.9	HT1900.1-2455
288.8707  10.7989    7.9  25.5   44.6  -0.2657  -1.5    9.8	GRS 1915+105
299.6031  35.2286    1.4  50.5   30.9   5.6309   8.0    1.7	Cyg X-1
263.0544 -33.6892   18.9  27.2 -164.4   0.0886   0.6    9.3	GX 354-0
311.6649 -13.4391    2.8  40.2  102.5   2.3845   4.1 ------	UNKNOWN
287.2203 -16.9859    2.7  18.3  123.1   0.6455   4.2 ------	UNKNOWN
257.5214 -32.2393    2.2  27.7 -153.9   0.7814   5.2 ------	UNKNOWN
245.3017 -16.8055    2.4  26.9 -111.8   0.9605   4.7 ------	UNKNOWN
239.7676 -52.7708    2.9  51.9 -155.7   1.4590   3.9 ------	UNKNOWN
240.5364  44.4981    2.8  58.9  -24.5   4.0225   4.1 ------	UNKNOWN
	UNKNOWN
	UNKNOWN
Pre-slew background subtracted image of 15-350 keV band
Time interval of the image:
-16.764000 10.116600

# RAcent  DECcent POSerr Theta    Phi  PeakCts   SNR AngSep     Name
#  [deg]    [deg]    ['] [deg]  [deg]                   [']
244.8433 -15.6910   10.6  27.0 -109.2  -0.1019  -1.1    8.4	Sco X-1
254.5868  35.2131    0.0  45.6  -18.4  -0.1130  -0.9   10.0	Her X-1
255.8649 -37.7353   16.7  33.2 -156.9   0.0563   0.7    8.7	4U 1700-377
256.3883 -36.5658    5.3  32.0 -156.6   0.1826   2.2    8.9	GX 349+2
263.0883 -24.8876   13.5  19.0 -156.2   0.0604   0.9    9.6	GX 1+4
264.5749 -44.4289    6.3  37.3 -171.6  -0.1667  -1.8    7.3	4U 1735-44
268.5166  -1.3396    6.6   6.8  -22.5   0.1207   1.7   11.2	SW J1753.5-0127
270.2808 -25.0817  184.5  17.5 -176.7  -0.0041  -0.1    0.2	GX 5-1
270.3001 -25.7394   42.3  18.2 -176.8   0.0187   0.3    0.3	GRS 1758-258
274.0027 -14.0219   80.6   7.0  157.6   0.0100   0.1    0.9	GX 17+2
276.0892 -30.5094    0.0  23.4  169.9  -0.2227  -3.1   12.0	H1820-303
284.8719 -24.7900    0.0  21.6  145.0  -0.0727  -0.9   11.9	HT1900.1-2455
288.7793  10.9767    6.7  25.5   44.2   0.1525   1.7    2.2	GRS 1915+105
299.5993  35.2071    5.5  50.5   30.9  -0.7393  -2.1    0.5	Cyg X-1
263.1336 -33.7153    6.3  27.2 -164.6   0.1364   1.8   10.2	GX 354-0
302.3987  32.3958    2.2  49.8   35.6   1.7899   5.3 ------	UNKNOWN
287.7003 -59.4056    2.5  53.3  170.2   1.2315   4.6 ------	UNKNOWN
275.3813  -6.7540    2.0   4.3   79.7   0.3927   5.9 ------	UNKNOWN
249.6341 -12.0520    0.2  21.7 -103.0   3.8789  46.9 ------	UNKNOWN
249.5139  25.3986    2.5  39.1  -31.2   0.4886   4.5 ------	UNKNOWN
Post-slew image of 15-350 keV band
Time interval of the image:
54.116600 482.746000

# RAcent  DECcent POSerr Theta    Phi  PeakCts   SNR AngSep     Name
#  [deg]    [deg]    ['] [deg]  [deg]                   [']
244.9874 -15.6459    0.3   5.8 -139.5   5.6588  35.6    0.6	Sco X-1
254.5441  35.3787   10.9  47.7   -5.3   0.3596   1.1    4.8	Her X-1
255.9092 -37.9137    4.3  26.5  158.2   0.5405   2.7    5.6	4U 1700-377
256.3401 -36.5539   14.1  25.2  156.7   0.1672   0.8    9.1	GX 349+2
262.8578 -24.6616    8.3  17.7  126.5   0.2459   1.4    9.7	GX 1+4
264.7488 -44.4639    3.8  34.9  150.4   0.8849   3.0    0.9	4U 1735-44
268.5006  -1.3309    4.7  21.5   50.9  -0.5033  -2.5   10.8	SW J1753.5-0127
270.3769 -24.9420   25.4  23.4  115.6   0.0971   0.5    9.7	GX 5-1
270.3795 -25.6051    2.9  23.8  117.0   0.8688   4.0    9.3	GRS 1758-258
273.9525 -13.9500    3.0  23.7   86.6   0.8665   3.8    6.0	GX 17+2
275.9513 -30.4779   20.2  30.5  120.6   0.1605   0.6    6.8	H1820-303
285.2002 -24.8991    6.0  35.9  105.4   0.8648   1.9    9.0	HT1900.1-2455
288.7106  10.8432    6.2  45.0   50.3   1.4793   1.9    8.0	GRS 1915+105
262.8682 -33.9744    5.5  25.0  142.7   0.4129   2.1   10.3	GX 354-0
258.9794  -6.9535    3.0  10.5   51.1   0.6551   3.9 ------	UNKNOWN
265.4887  42.3615    2.1  56.3    3.3   5.2752   5.5 ------	UNKNOWN
255.2782   4.7070    2.6  17.7    8.0   0.7373   4.5 ------	UNKNOWN
203.4539 -23.6562    2.5  45.3 -122.1   3.7889   4.6 ------	UNKNOWN
201.2586 -29.0658    3.9  48.0 -129.1   2.5263   3.0 ------	UNKNOWN
203.2723 -23.1508    3.7  45.4 -121.4   2.5314   3.1 ------	UNKNOWN
Plot creation:
Thu Oct  1 11:39:44 EDT 2015