Special notes of this burst
Image
Pre-slew 15.0-350.0 keV image (Event data)
#   RAcent    DECcent   POSerr    Theta     Phi              Peak Cts       SNR   Name
  230.3409    68.3430   0.0087    43.9202  -149.4753         3.9481260     22.248 TRIG_00652603

Foreground time interval of the image:
-25.256  13.365 (delta_t =  38.621 [sec])
Background time interval of the image:
-65.635 -25.256 (delta_t =  40.379 [sec])
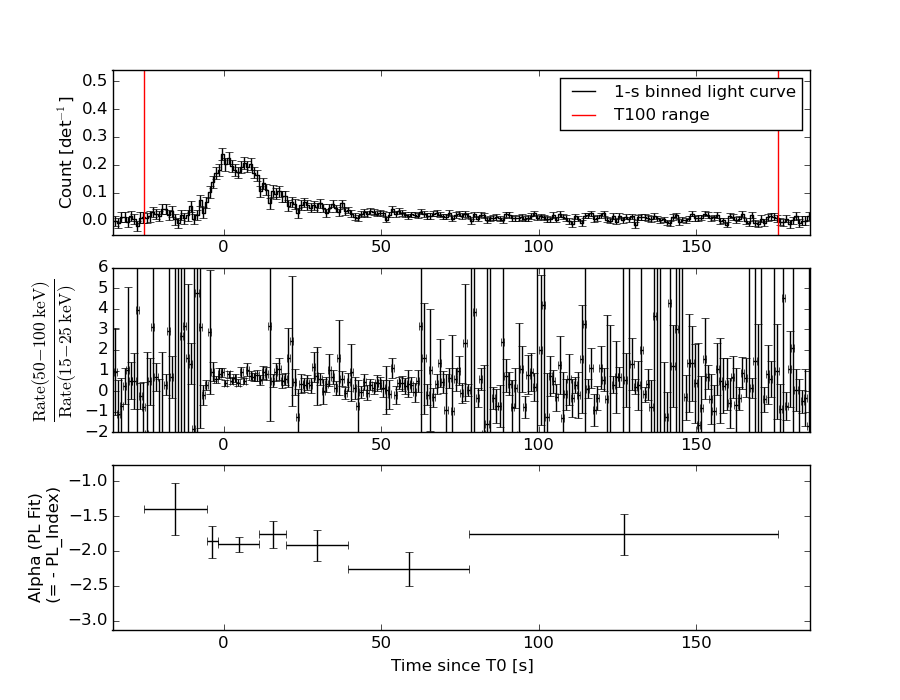
Lightcurves
Notes:
- 1) The mask-weighted light curves are using the flight position.
- 2) Multiple plots of different time binning/intervals are shown to cover all scenarios of short/long GRBs, rate/image triggers, and real/false positives.
- 3) For all the mask-weighted lightcurves, the y-axis units are counts/sec/det where a det is 0.4 x 0.4 = 0.16 sq cm.
- 4) The verticle lines correspond to following: green dotted lines are T50 interval, black dotted lines are T90 interval, blue solid line(s) is a spacecraft slew start time, and orange solid line(s) is a spacecraft slew end time.
- 5) Time of each bin is in the middle of the bin.
1 s binning
From T0-310 s to T0+310 s
From T100_start - 20 s to T100_end + 30 s
Full time interval

64 ms binning
Full time interval

From T100_start to T100_end
From T0-5 sec to T0+5 sec
16 ms binning
From T100_start-5 s to T100_start+5 s
Blue+Cyan dotted lines: Time interval of the scaled map
From 0.000000 to 1.024000
8 ms binning
From T100_start-3 s to T100_start+3 s
Blue+Cyan dotted lines: Time interval of the scaled map
From 0.000000 to 1.024000
2 ms binning
From T100_start-1 s to T100_start+1 s
Blue+Cyan dotted lines: Time interval of the scaled map
From 0.000000 to 1.024000
SN=5 or 10 sec. binning (whichever binning is satisfied first)
SN=5 or 10 sec. binning (T < 200 sec)

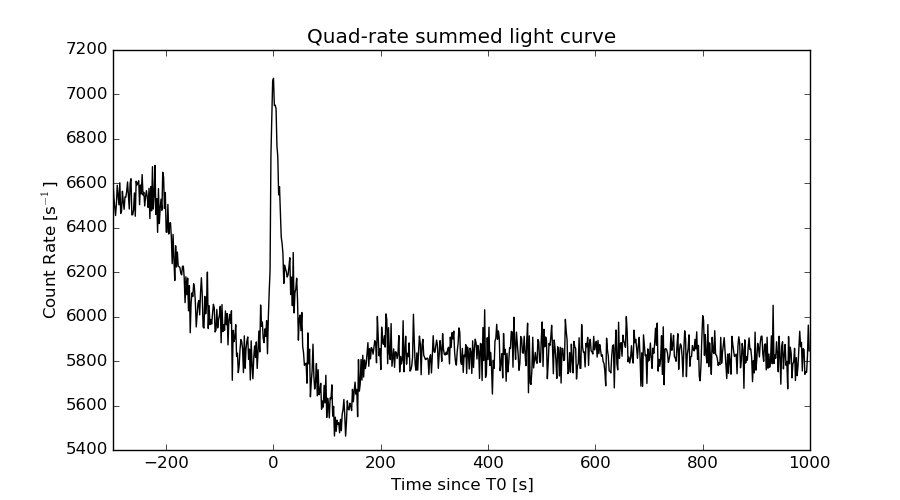
Quad-rate summed light curves (from T0-300s to T0+1000s)
Spectral Evolution
Spectra
Notes:
- 1) The fitting includes the systematic errors.
- 2) When the burst includes telescope slew time periods, the fitting uses an average response file made from multiple 5-s response files through out the slew time plus single time preiod for the non-slew times, and weighted by the total counts in the corresponding time period using addrmf. An average response file is needed becuase a spectral fit using the pre-slew DRM will introduce some errors in both a spectral shape and a normalization if the PHA file contains a lot of the slew/post-slew time interval.
- 3) For fits to more complicated models (e.g. a power-law over a cutoff power-law), the BAT team has decided to require a chi-square improvement of more than 6 for each extra dof.
Time averaged spectrum fit using the average DRM
Power-law model

Time interval is from  -25.256 sec. to  176.020 sec.

Spectral model in power-law:
------------------------------------------------------------
Parameters  : value       lower 90%   higher 90%
Photon index: 1.87493     ( -0.090832   0.092134 )
Norm@50keV  : 2.30203E-03    ( -0.000116681   0.000115771 )
------------------------------------------------------------
#Fit statistic : Chi-Squared =          55.52 using 59 PHA bins.
# Reduced chi-squared =         0.9741 for     57 degrees of freedom
# Null hypothesis probability =   5.306093e-01

Photon flux (15-150 keV)    in 201.3 sec: 0.326905 ( -0.0159337  0.0160008 ) ph/cm2/s
Energy fluence (15-150 keV)             : 4.26001e-06 ( -2.14868e-07  2.15969e-07 ) ergs/cm2
Cutoff power-law model

Time interval is from  -25.256 sec. to  176.020 sec.
Spectral model in the cutoff power-law:
------------------------------------------------------------
Parameters  : value       lower 90%   higher 90%
Photon index: 1.87355     ( -0.0910775   0.402178 )
Epeak [keV] : 9999.23      ( -9999.34 -9999.35 )
Norm@50keV  : 2.30496E-03    ( -0.000117192   0.000801217 )
------------------------------------------------------------
#Fit statistic : Chi-Squared =          55.53 using 59 PHA bins.
# Reduced chi-squared =         0.9916 for     56 degrees of freedom
# Null hypothesis probability =   4.926999e-01

Photon flux (15-150 keV)    in 201.3 sec: 0.326750 (    ) ph/cm2/s
Energy fluence (15-150 keV)             : 4.25866e-06 ( -2.22296e-07  2.13922e-07 ) ergs/cm2
Band function
Time interval is from  -25.256 sec. to  176.020 sec.

Spectral model in the Band function:
------------------------------------------------------------
Parameters  : value       lower 90%   higher 90%
alpha       : 4.94920   ( -4.9492   -4.9492 )
beta        : -1.89945    ( -0.106919   0.095567 )
Epeak [keV] : 20.0147      ( -20.0147 3.47238 )
Norm@50keV   : 1269.61    ( -58.1639   2.38528e+06 )
------------------------------------------------------------
#Fit statistic : Chi-Squared =          54.68 using 59 PHA bins.
# Reduced chi-squared =         0.9941 for     55 degrees of freedom
# Null hypothesis probability =   4.869755e-01

Photon flux (15-150 keV)    in 201.3 sec:  (    ) ph/cm2/s
Energy fluence (15-150 keV)             : 0 ( 0  0 ) ergs/cm2
Single BB
Spectral model blackbody:
------------------------------------------------------------
Parameters  : value    Lower 90%  Upper 90%
kT [keV]    : 12.0254  (  )
R^2/D10^2   : 7.16393E-02  (   )
(R is the radius in km and D10 is the distance to the source in units of 10 kpc)
------------------------------------------------------------
#Fit statistic : Chi-Squared =         204.13 using 59 PHA bins.
# Reduced chi-squared =         3.5813 for     57 degrees of freedom
# Null hypothesis probability =   1.962897e-18

Energy  Fluence     90% Error
[keV]   [erg/cm2]   [erg/cm2]
15- 25  4.411e-07   3.905e-08
25- 50  1.392e-06   8.314e-08
50-150  1.212e-06   1.369e-07
15-150  3.045e-06   1.671e-07
Thermal bremsstrahlung (OTTB)
Spectral model: thermal bremsstrahlung
------------------------------------------------------------
Parameters  : value         Lower 90%    Upper 90%
kT [keV]    : 97.4304       (-16.347      22.1698)
Norm        : 1.41456       (-0.102027     0.11411)
------------------------------------------------------------
#Fit statistic : Chi-Squared =          65.41 using 59 PHA bins.
# Reduced chi-squared =          1.148 for     57 degrees of freedom
# Null hypothesis probability =   2.078288e-01

Energy  Fluence     90% Error
[keV]   [erg/cm2]   [erg/cm2]
15- 25  7.441e-07   6.693e-08
25- 50  1.280e-06   7.408e-08
50-150  2.044e-06   5.495e-07
15-150  4.068e-06   5.797e-07
Double BB
Spectral model: bbodyrad<1> + bbodyrad<2>
------------------------------------------------------------
Parameters  : value         Lower 90%    Upper 90%
kT1 [keV]   : 5.93506        (-0.705126      0.774542)
R1^2/D10^2  : 0.793101        (-0.300266      0.531993)
kT2 [keV]   : 24.1545        (-3.23564      4.4519)
R2^2/D10^2  : 4.26949E-03    (-0.00194712   0.00304886)
------------------------------------------------------------
#Fit statistic : Chi-Squared =          54.83 using 59 PHA bins.
# Reduced chi-squared =         0.9970 for     55 degrees of freedom
# Null hypothesis probability =   4.809777e-01

Energy  Fluence     90% Error
[keV]   [erg/cm2]   [erg/cm2]
15- 25  8.242e-07   1.197e-07
25- 50  1.210e-06   1.210e-07
50-150  2.210e-06   3.740e-07
15-150  4.244e-06   5.737e-07
Peak spectrum fit
Power-law model
Time interval is from    1.568 sec. to    2.568 sec.

Spectral model in power-law:
------------------------------------------------------------
Parameters  : value       lower 90%   higher 90%
Photon index: 1.97822     ( -0.263029   0.282286 )
Norm@50keV  : 1.58532E-02    ( -0.00276815   0.00266936 )
------------------------------------------------------------
#Fit statistic : Chi-Squared =          60.20 using 59 PHA bins.
# Reduced chi-squared =          1.056 for     57 degrees of freedom
# Null hypothesis probability =   3.608438e-01

Photon flux (15-150 keV)    in 1 sec: 2.35447 ( -0.334413  0.334937 ) ph/cm2/s
Energy fluence (15-150 keV)             : 1.46043e-07 ( -2.37899e-08  2.42679e-08 ) ergs/cm2
Cutoff power-law model
Time interval is from    1.568 sec. to    2.568 sec.
Spectral model in the cutoff power-law:
------------------------------------------------------------
Parameters  : value       lower 90%   higher 90%
Photon index: 1.92188     ( -1.04558   0.298119 )
Epeak [keV] : 62.3145      (   )
Norm@50keV  : 1.70320E-02    (     )
------------------------------------------------------------
#Fit statistic : Chi-Squared =          60.19 using 59 PHA bins.
# Reduced chi-squared =          1.075 for     56 degrees of freedom
# Null hypothesis probability =   3.268249e-01

Photon flux (15-150 keV)    in 1 sec: 2.35294 ( -0.34824  0.3332 ) ph/cm2/s
Energy fluence (15-150 keV)             : 1.45407e-07 ( -2.6256e-08  2.4661e-08 ) ergs/cm2
Band function

Time interval is from    1.568 sec. to    2.568 sec.

Spectral model in the Band function:
------------------------------------------------------------
Parameters  : value       lower 90%   higher 90%
alpha       : -1.91571   ( -1.10169   0.985647 )
beta        : -9.35079    ( 9.37142   19.3714 )
Epeak [keV] : 71.9801      ( -71.0863 -71.0863 )
Norm@50keV   : 1.70029E-02    ( -0.00238406   5.22986e+06 )
------------------------------------------------------------
#Fit statistic : Chi-Squared =          60.19 using 59 PHA bins.
# Reduced chi-squared =          1.094 for     55 degrees of freedom
# Null hypothesis probability =   2.935206e-01

Photon flux (15-150 keV)    in 1 sec:  (    ) ph/cm2/s
Energy fluence (15-150 keV)             : 0 ( 0  0 ) ergs/cm2
Single BB
Spectral model blackbody:
------------------------------------------------------------
Parameters  : value    Lower 90%  Upper 90%
kT [keV]    : 10.4919  (-1.77952  2.22239)
R^2/D10^2   : 0.883823  (-0.460227   0.928673)
(R is the radius in km and D10 is the distance to the source in units of 10 kpc)
------------------------------------------------------------
#Fit statistic : Chi-Squared =          76.13 using 59 PHA bins.
# Reduced chi-squared =          1.336 for     57 degrees of freedom
# Null hypothesis probability =   4.610086e-02

Energy  Fluence     90% Error
[keV]   [erg/cm2]   [erg/cm2]
15- 25  2.011e-08   5.235e-09
25- 50  5.342e-08   1.174e-08
50-150  3.198e-08   1.146e-08
15-150  1.055e-07   2.088e-08
Thermal bremsstrahlung (OTTB)
Spectral model: thermal bremsstrahlung
------------------------------------------------------------
Parameters  : value         Lower 90%    Upper 90%
kT [keV]    : 75.6452       (-27.9974      60.4163)
Norm        : 11.1295       (-2.25907     3.05223)
------------------------------------------------------------
#Fit statistic : Chi-Squared =          61.25 using 59 PHA bins.
# Reduced chi-squared =          1.075 for     57 degrees of freedom
# Null hypothesis probability =   3.260882e-01

Energy  Fluence     90% Error
[keV]   [erg/cm2]   [erg/cm2]
15- 25  2.876e-08   5.810e-09
25- 50  4.670e-08   7.920e-09
50-150  6.343e-08   3.362e-08
15-150  1.389e-07   3.335e-08
Double BB
Spectral model: bbodyrad<1> + bbodyrad<2>
------------------------------------------------------------
Parameters  : value         Lower 90%    Upper 90%
kT1 [keV]   : 4.69459        (-1.75117      2.75624)
R1^2/D10^2  : 14.6946        (-11.977      117.564)
kT2 [keV]   : 19.1274        (-6.02151      14.0362)
R2^2/D10^2  : 7.23045E-02    (-0.0625017   0.198068)
------------------------------------------------------------
#Fit statistic : Chi-Squared =          60.80 using 59 PHA bins.
# Reduced chi-squared =          1.105 for     55 degrees of freedom
# Null hypothesis probability =   2.749841e-01

Energy  Fluence     90% Error
[keV]   [erg/cm2]   [erg/cm2]
15- 25  3.277e-08   1.809e-08
25- 50  4.043e-08   1.765e-08
50-150  6.794e-08   3.916e-08
15-150  1.411e-07   6.579e-08
Pre-slew spectrum (Pre-slew PHA with pre-slew DRM)
Power-law model

Spectral model in power-law:
------------------------------------------------------------
Parameters  : value       lower 90%   higher 90%
Photon index: 1.81323     ( -0.101383   0.103118 )
Norm@50keV  : 6.75039E-03    ( -0.000392885   0.000390253 )
------------------------------------------------------------
#Fit statistic : Chi-Squared =          44.91 using 59 PHA bins.
# Reduced chi-squared =         0.7880 for     57 degrees of freedom
# Null hypothesis probability =   8.769509e-01

Photon flux (15-150 keV)    in 38.62 sec: 0.935002 ( -0.0535199  0.0536774 ) ph/cm2/s
Energy fluence (15-150 keV)             : 2.39899e-06 ( -1.41556e-07  1.42224e-07 ) ergs/cm2
Cutoff power-law model

Spectral model in the cutoff power-law:
------------------------------------------------------------
Parameters  : value       lower 90%   higher 90%
Photon index: 1.54506     ( -0.411349   0.317885 )
Epeak [keV] : 84.4096      ( -28.6177 -84.4096 )
Norm@50keV  : 9.21160E-03    ( -0.00272337   0.00544867 )
------------------------------------------------------------
#Fit statistic : Chi-Squared =          43.47 using 59 PHA bins.
# Reduced chi-squared =         0.7763 for     56 degrees of freedom
# Null hypothesis probability =   8.890758e-01

Photon flux (15-150 keV)    in 38.62 sec: 0.919265 ( -0.057562  0.057791 ) ph/cm2/s
Energy fluence (15-150 keV)             : 2.35309e-06 ( -1.56701e-07  1.56538e-07 ) ergs/cm2
Band function
Spectral model in the Band function:
------------------------------------------------------------
Parameters  : value       lower 90%   higher 90%
alpha       : -1.54525   ( -0.331849   0.378133 )
beta        : -10.00000    ( 10   20 )
Epeak [keV] : 84.4289      ( -24.7166 -84.4289 )
Norm@50keV   : 9.20758E-03    ( -0.000497334   0.00545154 )
------------------------------------------------------------
#Fit statistic : Chi-Squared =          43.47 using 59 PHA bins.
# Reduced chi-squared =         0.7904 for     55 degrees of freedom
# Null hypothesis probability =   8.691425e-01

Photon flux (15-150 keV)    in 38.62 sec: 0.924133 (    ) ph/cm2/s
Energy fluence (15-150 keV)             : 0 ( 0  0 ) ergs/cm2
S(25-50 keV) vs. S(50-100 keV) plot
S(25-50 keV)  = 1.23e-06
S(50-100 keV) = 1.34e-06
T90 vs. Hardness ratio plot
T90                                   = 143.055999934673 sec.
Hardness ratio (energy fluence ratio) = 1.08943
Color vs. Color plot
Count Ratio  (25-50 keV) / (15-25 keV) = 1.09854
Count Ratio (50-100 keV) / (15-25 keV) = 0.678464
Mask shadow pattern

IMX = -8.295371942011757E-01, IMY = 4.891173970783941E-01
TIME vs. PHA plot around the trigger time
Blue+Cyan dotted lines: Time interval of the scaled map
From 0.000000 to 1.024000
TIME vs. DetID plot around the trigger time

Blue+Cyan dotted lines: Time interval of the scaled map
From 0.000000 to 1.024000
100 us light curve (15-350 keV)
Blue+Cyan dotted lines: Time interval of the scaled map
From 0.000000 to 1.024000
Spacecraft aspect plot
Bright source in the pre-burst/pre-slew/post-slew images
Pre-burst image of 15-350 keV band
Time interval of the image:
-65.635410 -25.256000

# RAcent  DECcent POSerr Theta    Phi  PeakCts   SNR AngSep     Name
#  [deg]    [deg]    ['] [deg]  [deg]                   [']
299.6464  35.1880    4.1  48.7  139.2   1.0206   2.8    2.9	Cyg X-1
308.1259  41.0065   11.4  40.2  135.9   0.1841   1.0    3.3	Cyg X-3
326.3317  38.1535    0.0  35.0  113.9   0.0909   0.6   12.6	Cyg X-2
 18.2349  14.8234    2.5  50.0   37.1   1.5215   4.6 ------	UNKNOWN
 25.0579  40.8967    2.3  25.6   18.1   0.3499   5.1 ------	UNKNOWN
 53.7720  53.1684    0.8  26.2  -35.8   1.1574  15.3 ------	UNKNOWN
185.6082  83.7154    2.8  32.2 -127.6   0.3891   4.1 ------	UNKNOWN
Pre-slew background subtracted image of 15-350 keV band
Time interval of the image:
-25.256000 13.364600

# RAcent  DECcent POSerr Theta    Phi  PeakCts   SNR AngSep     Name
#  [deg]    [deg]    ['] [deg]  [deg]                   [']
299.6950  35.3150   11.7  48.6  139.3   0.4879   1.0    8.5	Cyg X-1
308.2968  40.9532    6.6  40.2  135.7   0.4259   1.7    8.5	Cyg X-3
326.1754  38.3176   23.2  35.0  114.2  -0.1051  -0.5    0.3	Cyg X-2
 25.9093  14.3877    2.7  51.5   27.7   1.8573   4.3 ------	UNKNOWN
263.8408  75.0804    3.1  32.3 -155.8   0.4280   3.7 ------	UNKNOWN
230.3409  68.3430    0.5  43.9 -149.5   3.9475  22.2 ------	UNKNOWN
Post-slew image of 15-350 keV band
Time interval of the image:
73.764600 122.564600

# RAcent  DECcent POSerr Theta    Phi  PeakCts   SNR AngSep     Name
#  [deg]    [deg]    ['] [deg]  [deg]                   [']
254.3739  35.4386    3.9  35.5  147.2   0.3548   2.9    7.1	Her X-1
230.3302  68.3036    1.4   0.1 -124.2   0.5959   8.2 ------	UNKNOWN
221.5359  18.0965    2.4  50.6 -167.2   0.8546   4.8 ------	UNKNOWN
 86.2547  49.7908    2.9  58.9  -24.4   1.8798   4.0 ------	UNKNOWN
Plot creation:
Wed Sep 30 11:11:22 EDT 2015