Special notes of this burst
Image
Pre-slew 15.0-350.0 keV image (Event data with DETECTION mask)
#   RAcent    DECcent   POSerr    Theta     Phi              Peak Cts       SNR   Name
  341.9162   -57.8724   0.0172    53.9158   147.9355        28.9170864     11.127 TRIG_00652847

Foreground time interval of the image:
 21.096 161.301 (delta_t = 140.205 [sec])
Background time interval of the image:
-239.000  21.096 (delta_t = 260.096 [sec])
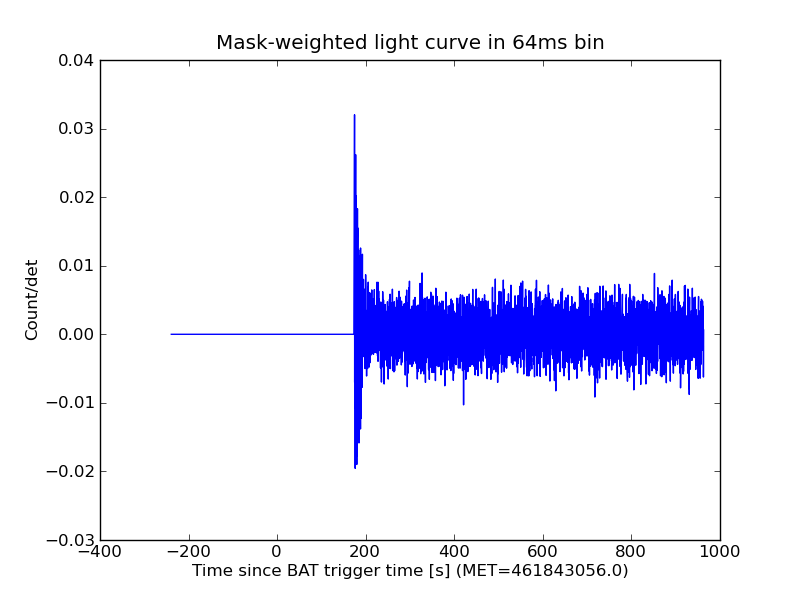
Lightcurves
Notes:
- 1) The mask-weighted lightcurves have units of either count/det or counts/sec/det, where a det is 0.4 x 0.4 = 0.16 sq cm.
- 2) The verticle lines correspond to following: green dotted lines are T50 interval, black dotted lines are T90 interval, blue solid line(s) is a spacecraft slew start time, and orange solid line(s) is a spacecraft slew end time (for the best duration plot, slew times are marked by green arrows).
- 3) For lightcurves in unit of count rate, time of each bin is in the middle of the bin.
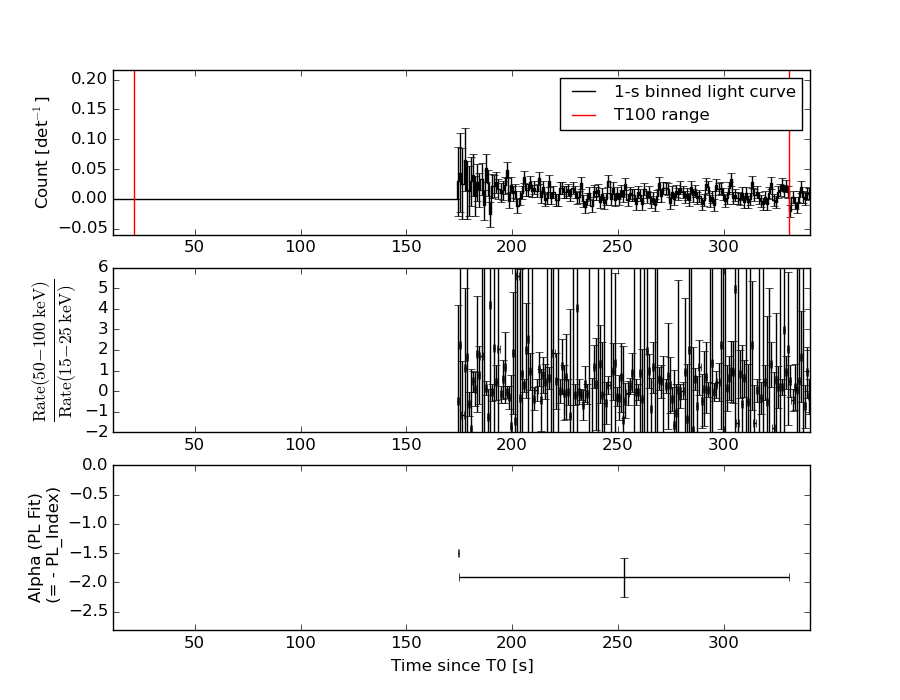
1 s binning
From T0-310 s to T0+310 s
From T100_start - 20 s to T100_end + 30 s

Full time interval
64 ms binning
Full time interval
From T100_start to T100_end

From T0-5 sec to T0+5 sec
16 ms binning
From T100_start-5 s to T100_start+5 s

8 ms binning
From T100_start-3 s to T100_start+3 s
2 ms binning
From T100_start-1 s to T100_start+1 s
SN=5 or 10 sec. binning (whichever binning is satisfied first)

SN=5 or 10 sec. binning (T < 200 sec)

Quad-rate summed light curves (from T0-300s to T0+1000s)

Spectral Evolution
Spectra
Notes:
- 1) The fitting includes the systematic errors.
- 2) For long bursts, a spectral fit of the pre-slew DRM will introduce some errors in both a spectral shape and a normalization if the PHA file contains a lot of the slew/post-slew time interval.
- 3) For fits to more complicated models (e.g. a power-law over a cutoff power-law), the BAT team has decided to require a chi-square improvement of more than 6 for each extra dof.
- 4) For short bursts (T90<1sec), the specrtum is also fit with Blackbody, OTTB, and Double Blackbody.
Time averaged spectrum fit using an average DRM
Power-law model

Time interval is from  174.240 sec. to  330.744 sec.

Spectral model in power-law:
------------------------------------------------------------
Parameters  : value       lower 90%   higher 90%
Photon index: 1.93097     ( -0.331814   0.35792 )
Norm@50keV  : 5.86132E-04    ( -0.000144105   0.000141046 )
------------------------------------------------------------
#Fit statistic : Chi-Squared =          62.89 using 59 PHA bins.
# Reduced chi-squared =          1.103 for     57 degrees of freedom
# Null hypothesis probability =   2.758257e-01

Photon flux (15-150 keV)    in 156.5 sec: 8.52515E-02 ( -0.0175126  0.0175255 ) ph/cm2/s
Energy fluence (15-150 keV)             : 8.43751e-07 ( -1.97763e-07  2.04594e-07 ) ergs/cm2
Cutoff power-law model
Time interval is from  174.240 sec. to  330.744 sec.
Spectral model in the cutoff power-law:
------------------------------------------------------------
Parameters  : value       lower 90%   higher 90%
Photon index: -0.607063     ( -2.9492   1.89231 )
Epeak [keV] : 42.1053      ( -8.95597 14.1571 )
Norm@50keV  : 1.68954E-02    ( -0.0179153   0.780932 )
------------------------------------------------------------
#Fit statistic : Chi-Squared =          56.83 using 59 PHA bins.
# Reduced chi-squared =          1.015 for     56 degrees of freedom
# Null hypothesis probability =   4.437534e-01

Photon flux (15-150 keV)    in 156.5 sec: 7.95172E-02 ( -0.0177062  0.0177957 ) ph/cm2/s
Energy fluence (15-150 keV)             : 7.13025e-07 ( -1.67375e-07  1.98638e-07 ) ergs/cm2
Band function
Time interval is from  174.240 sec. to  330.744 sec.

Spectral model in the Band function:
------------------------------------------------------------
Parameters  : value       lower 90%   higher 90%
alpha       : 0.546121   ( -1.80217   2.96291 )
beta        : -9.37167    ( 9.37167   19.3713 )
Epeak [keV] : 42.5289      ( -9.38362 13.8096 )
Norm@50keV   : 1.54815E-02    ( -0.0154839   0.202489 )
------------------------------------------------------------
#Fit statistic : Chi-Squared =          56.83 using 59 PHA bins.
# Reduced chi-squared =          1.033 for     55 degrees of freedom
# Null hypothesis probability =   4.065749e-01

Photon flux (15-150 keV)    in 156.5 sec: 7.99337E-02 (    ) ph/cm2/s
Energy fluence (15-150 keV)             : 0 ( 0  0 ) ergs/cm2
Single BB

Spectral model blackbody:
------------------------------------------------------------
Parameters  : value    Lower 90%  Upper 90%
kT [keV]    : 10.7443  (-1.84756  2.25608)
R^2/D10^2   : 3.28642E-02  (-0.0172199   0.0346241)
(R is the radius in km and D10 is the distance to the source in units of 10 kpc)
------------------------------------------------------------
#Fit statistic : Chi-Squared =          57.11 using 59 PHA bins.
# Reduced chi-squared =          1.002 for     57 degrees of freedom
# Null hypothesis probability =   4.708227e-01

Energy  Fluence     90% Error
[keV]   [erg/cm2]   [erg/cm2]
15- 25  1.234e-07   4.564e-08
25- 50  3.385e-07   1.083e-07
50-150  2.167e-07   1.092e-07
15-150  6.786e-07   2.049e-07
Thermal bremsstrahlung (OTTB)
Spectral model: thermal bremsstrahlung
------------------------------------------------------------
Parameters  : value         Lower 90%    Upper 90%
kT [keV]    : 66.9686       (-27.1418      68.1895)
Norm        : 0.437450       (-0.117817     0.157136)
------------------------------------------------------------
#Fit statistic : Chi-Squared =          59.73 using 59 PHA bins.
# Reduced chi-squared =          1.048 for     57 degrees of freedom
# Null hypothesis probability =   3.768288e-01

Energy  Fluence     90% Error
[keV]   [erg/cm2]   [erg/cm2]
15- 25  1.748e-07   5.209e-08
25- 50  2.747e-07   8.598e-08
50-150  3.412e-07   2.373e-07
15-150  7.907e-07   3.160e-07
Double BB

Spectral model: bbodyrad<1> + bbodyrad<2>
------------------------------------------------------------
Parameters  : value         Lower 90%    Upper 90%
kT1 [keV]   : 4.02930        (-4.11957      -4.11957)
R1^2/D10^2  : 0.320979        (-0.316765      2.52774)
kT2 [keV]   : 11.7397        (-2.625      -11.757)
R2^2/D10^2  : 2.15322E-02    (-0.0214204   0.039711)
------------------------------------------------------------
#Fit statistic : Chi-Squared =          56.43 using 59 PHA bins.
# Reduced chi-squared =          1.026 for     55 degrees of freedom
# Null hypothesis probability =   4.212617e-01

Energy  Fluence     90% Error
[keV]   [erg/cm2]   [erg/cm2]
15- 25  1.453e-07   6.974e-08
25- 50  3.180e-07   1.849e-07
50-150  2.456e-07   1.534e-07
15-150  7.089e-07   4.099e-07
S(25-50 keV) vs. S(50-100 keV) plot

S(25-50 keV)  = 2.49e-07
S(50-100 keV) = 2.61e-07
T90 vs. Hardness ratio plot
T90                                   = 168.944000005722 sec.
Hardness ratio (energy fluence ratio) = 1.04819
Color vs. Color plot
Count Ratio  (25-50 keV) / (15-25 keV) = 1.23145
Count Ratio (50-100 keV) / (15-25 keV) = 0.482332
Mask shadow pattern (with DETECTION mask)

IMX = 0, IMY = 0
TIME vs. PHA plot around the beginning of event data (event_start to event_start+0.64s) with DETECTION mask
TIME vs. DetID plot around the beginning of event data (event_start to event_start+0.64s) with DETECTION mask

100 us light curve (15-350 keV; (event_start to event_start+0.64s)

Spacecraft aspect plot
Bright source in the event data image
Event data image of 15-350 keV band
Time interval of the image:
21.096000 161.300590

# RAcent  DECcent POSerr Theta    Phi  PeakCts   SNR AngSep     Name
#  [deg]    [deg]    ['] [deg]  [deg]                   [']
170.4440 -60.7362   25.5  49.2 -131.2  -0.3134  -0.5    7.8	Cen X-3
186.7031 -62.7299    1.9  41.2 -131.6  -1.8543  -6.2    2.7	GX 301-2
244.8753 -15.6334    6.8  28.9   -5.9   0.3267   1.7    6.0	Sco X-1
256.0084 -37.8082    6.2   6.6   35.3   0.3091   1.9    2.4	4U 1700-377
256.6458 -36.5018    5.9   8.0   34.8   0.3334   2.0   11.2	GX 349+2
262.9936 -24.7777  281.2  20.9   37.2   0.0077   0.0    2.1	GX 1+4
264.8795 -44.2624    0.0   9.0  106.3   0.1671   0.9   12.7	4U 1735-44
268.3628  -1.5936    8.7  44.6   32.3   0.5358   1.3    8.5	SW J1753.5-0127
270.4447 -25.0513   63.7  23.9   53.2   0.0400   0.2    8.9	GX 5-1
270.3172 -25.7591    5.9  23.2   54.0  -0.4208  -2.0    1.2	GRS 1758-258
274.0826 -14.1529  132.4  35.0   47.9   0.0287   0.1    8.3	GX 17+2
275.9784 -30.4986    6.2  22.9   71.6  -0.4155  -1.9    8.4	H1820-303
284.9511 -25.0459   15.2  32.5   74.6   0.2762   0.8    8.8	HT1900.1-2455
262.9638 -33.6875    6.1  13.1   51.9  -0.3359  -1.9    8.9	GX 354-0
341.9163 -57.8724    1.0  53.9  147.9  28.9060  11.1 ------	UNKNOWN
275.7159 -68.9716    1.9  27.9  171.4   1.2468   6.0 ------	UNKNOWN
 61.2211 -75.1454    2.7  60.8 -174.2   9.3411   4.3 ------	UNKNOWN
236.7988   7.3264    2.5  53.0  -10.3   1.9269   4.7 ------	UNKNOWN
203.6642 -23.6111    2.5  44.4  -70.2   4.0111   4.6 ------	UNKNOWN
Webpage updated on:
Mon Jan 11 18:19:16 EST 2016