Click here for the BAT GCN circular template
Image
Pre-slew 15.0-350.0 keV image (Event data)

#   RAcent    DECcent   POSerr    Theta     Phi              Peak Cts       SNR   Name
  271.0302   -27.2427   0.0166    57.1060    -4.9451         2.0819189     11.536 TRIG_00653978

Foreground time interval of the image:
 -0.584   6.840 (delta_t =   7.424 [sec])
Background time interval of the image:
-47.835  -0.584 (delta_t =  47.251 [sec])
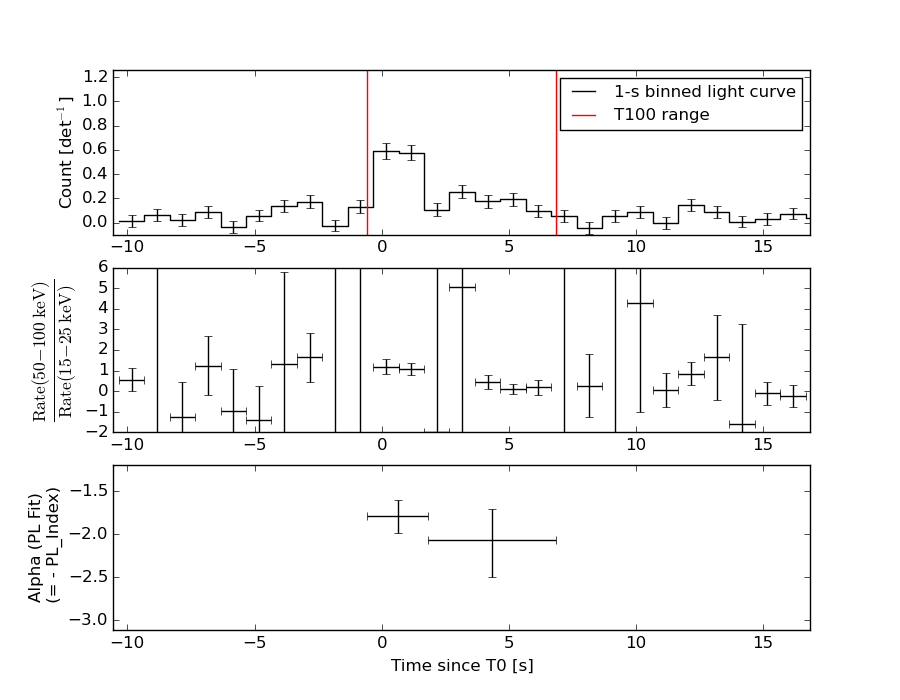
Lightcurves
Notes:
- 1) The mask-weighted light curves are using the flight position.
- 2) Multiple plots of different time binning/intervals are shown to cover all scenarios of short/long GRBs, rate/image triggers, and real/false positives.
- 3) For all the mask-weighted lightcurves, the y-axis units are counts/sec/det where a det is 0.4 x 0.4 = 0.16 sq cm.
- 4) The verticle lines correspond to following: green dotted lines are T50 interval, black dotted lines are T90 interval, blue solid line(s) is a spacecraft slew start time, and orange solid line(s) is a spacecraft slew end time.
- 5) Time of each bin is in the middle of the bin.
1 s binning
From T0-310 s to T0+310 s

From T100_start - 20 s to T100_end + 30 s
Full time interval

64 ms binning
Full time interval
From T100_start to T100_end
From T0-5 sec to T0+5 sec
16 ms binning
From T100_start-5 s to T100_start+5 s

Blue+Cyan dotted lines: Time interval of the scaled map
From 0.000000 to 1.024000
8 ms binning
From T100_start-3 s to T100_start+3 s

Blue+Cyan dotted lines: Time interval of the scaled map
From 0.000000 to 1.024000
2 ms binning
From T100_start-1 s to T100_start+1 s

Blue+Cyan dotted lines: Time interval of the scaled map
From 0.000000 to 1.024000
SN=5 or 10 sec. binning (whichever binning is satisfied first)
SN=5 or 10 sec. binning (T < 200 sec)

Quad-rate summed light curves (from T0-300s to T0+1000s)

Spectral Evolution
Spectra
Notes:
- 1) The fitting includes the systematic errors.
- 2) When the burst includes telescope slew time periods, the fitting uses an average response file made from multiple 5-s response files through out the slew time plus single time preiod for the non-slew times, and weighted by the total counts in the corresponding time period using addrmf. An average response file is needed becuase a spectral fit using the pre-slew DRM will introduce some errors in both a spectral shape and a normalization if the PHA file contains a lot of the slew/post-slew time interval.
- 3) For fits to more complicated models (e.g. a power-law over a cutoff power-law), the BAT team has decided to require a chi-square improvement of more than 6 for each extra dof.
Time averaged spectrum fit using the average DRM
Power-law model
Time interval is from   -0.584 sec. to    6.840 sec.

Spectral model in power-law:
------------------------------------------------------------
Parameters  : value       lower 90%   higher 90%
Photon index: 1.89764     ( -0.191063   0.19992 )
Norm@50keV  : 2.02625E-02    ( -0.00259979   0.00256623 )
------------------------------------------------------------
#Fit statistic : Chi-Squared =          65.92 using 59 PHA bins.
# Reduced chi-squared =          1.156 for     57 degrees of freedom
# Null hypothesis probability =   1.956754e-01

Photon flux (15-150 keV)    in 7.424 sec: 2.90494 ( -0.354131  0.355262 ) ph/cm2/s
Energy fluence (15-150 keV)             : 1.38299e-06 ( -1.74726e-07  1.75858e-07 ) ergs/cm2
Cutoff power-law model

Time interval is from   -0.584 sec. to    6.840 sec.
Spectral model in the cutoff power-law:
------------------------------------------------------------
Parameters  : value       lower 90%   higher 90%
Photon index: 0.521821     ( -1.34273   0.98181 )
Epeak [keV] : 50.7398      ( -9.18518 18.0786 )
Norm@50keV  : 0.107622    ( -0.107631   0.454165 )
------------------------------------------------------------
#Fit statistic : Chi-Squared =          59.69 using 59 PHA bins.
# Reduced chi-squared =          1.066 for     56 degrees of freedom
# Null hypothesis probability =   3.429694e-01

Photon flux (15-150 keV)    in 7.424 sec: 2.76342 ( -0.36929  0.36941 ) ph/cm2/s
Energy fluence (15-150 keV)             : 1.29094e-06 ( -1.89223e-07  1.90685e-07 ) ergs/cm2
Band function

Time interval is from   -0.584 sec. to    6.840 sec.

Spectral model in the Band function:
------------------------------------------------------------
Parameters  : value       lower 90%   higher 90%
alpha       : 0.594162   ( -1.85593   2.99559 )
beta        : -2.66671    ( 2.66718   0.586155 )
Epeak [keV] : 43.4683      ( -9.40372 17.7203 )
Norm@50keV   : 0.504054    ( -0.422264   34.8986 )
------------------------------------------------------------
#Fit statistic : Chi-Squared =          58.51 using 59 PHA bins.
# Reduced chi-squared =          1.064 for     55 degrees of freedom
# Null hypothesis probability =   3.477970e-01

Photon flux (15-150 keV)    in 7.424 sec:  (    ) ph/cm2/s
Energy fluence (15-150 keV)             : 1.30166e-06 ( -1.30161e-06  -1.83841e-07 ) ergs/cm2
Single BB

Spectral model blackbody:
------------------------------------------------------------
Parameters  : value    Lower 90%  Upper 90%
kT [keV]    : 11.9218  (-1.37154  1.55406)
R^2/D10^2   : 0.740753  (-0.277985   0.436)
(R is the radius in km and D10 is the distance to the source in units of 10 kpc)
------------------------------------------------------------
#Fit statistic : Chi-Squared =          65.26 using 59 PHA bins.
# Reduced chi-squared =          1.145 for     57 degrees of freedom
# Null hypothesis probability =   2.114972e-01

Energy  Fluence     90% Error
[keV]   [erg/cm2]   [erg/cm2]
15- 25  1.652e-07   3.463e-08
25- 50  5.160e-07   7.676e-08
50-150  4.390e-07   1.136e-07
15-150  1.120e-06   1.830e-07
Thermal bremsstrahlung (OTTB)
Spectral model: thermal bremsstrahlung
------------------------------------------------------------
Parameters  : value         Lower 90%    Upper 90%
kT [keV]    : 85.0666       (-24.2933      42.4943)
Norm        : 13.5547       (-2.13863     2.65754)
------------------------------------------------------------
#Fit statistic : Chi-Squared =          61.30 using 59 PHA bins.
# Reduced chi-squared =          1.075 for     57 degrees of freedom
# Null hypothesis probability =   3.246097e-01

Energy  Fluence     90% Error
[keV]   [erg/cm2]   [erg/cm2]
15- 25  2.620e-07   4.636e-08
25- 50  4.376e-07   5.657e-08
50-150  6.431e-07   2.749e-07
15-150  1.343e-06   2.780e-07
Double BB

R1^2/D10^2  : 1.50632E-02        (-0.008675      0.196116)
kT2 [keV]   : 9.25346        (-3.11134      2.15252)
R2^2/D10^2  : 1.49276    (-0.64779   2.323)
------------------------------------------------------------
#Fit statistic : Chi-Squared =          61.99 using 59 PHA bins.
#Fit statistic : Chi-Squared =          60.93 using 59 PHA bins.
#Fit statistic : Chi-Squared =          58.72 using 59 PHA bins.
# Reduced chi-squared =          1.127 for     55 degrees of freedom
# Reduced chi-squared =          1.108 for     55 degrees of freedom
# Reduced chi-squared =          1.068 for     55 degrees of freedom
# Null hypothesis probability =   2.410599e-01
# Null hypothesis probability =   2.712805e-01
# Null hypothesis probability =   3.408548e-01

Energy  Fluence     90% Error
[keV]   [erg/cm2]   [erg/cm2]
15- 25  2.253e-07   9.006e-08
25- 50  4.725e-07   1.460e-07
50-150  4.973e-07   1.598e-07
15-150  1.195e-06   3.037e-07
Peak spectrum fit
Power-law model
Time interval is from   -0.148 sec. to    0.852 sec.

Spectral model in power-law:
------------------------------------------------------------
Parameters  : value       lower 90%   higher 90%
Photon index: 1.89867     ( -0.257462   0.280907 )
Norm@50keV  : 4.13085E-02    ( -0.00782553   0.00770174 )
------------------------------------------------------------
#Fit statistic : Chi-Squared =          78.44 using 59 PHA bins.
# Reduced chi-squared =          1.376 for     57 degrees of freedom
# Null hypothesis probability =   3.136775e-02

Photon flux (15-150 keV)    in 1 sec: 5.92470 ( -1.0836  1.0875 ) ph/cm2/s
Energy fluence (15-150 keV)             : 3.79791e-07 ( -7.0802e-08  7.10663e-08 ) ergs/cm2
Cutoff power-law model

Time interval is from   -0.148 sec. to    0.852 sec.
Spectral model in the cutoff power-law:
------------------------------------------------------------
Parameters  : value       lower 90%   higher 90%
Photon index: 0.558737     ( -1.35343   1.08085 )
Epeak [keV] : 58.6413      ( -8.93305 30.7122 )
Norm@50keV  : 0.183177    ( -0.182105   0.580055 )
------------------------------------------------------------
#Fit statistic : Chi-Squared =          73.86 using 59 PHA bins.
# Reduced chi-squared =          1.319 for     56 degrees of freedom
# Null hypothesis probability =   5.515926e-02

Photon flux (15-150 keV)    in 1 sec: 5.73710 ( -1.09194  1.09891 ) ph/cm2/s
Energy fluence (15-150 keV)             : 3.83878e-07 ( -7.1532e-08  7.1927e-08 ) ergs/cm2
Band function

Time interval is from   -0.148 sec. to    0.852 sec.

Spectral model in the Band function:
------------------------------------------------------------
Parameters  : value       lower 90%   higher 90%
alpha       : -0.560041   ( -0.763453   1.99868 )
beta        : -10.0000    ( 10   3.01981e-14 )
Epeak [keV] : 58.6720      ( -15.8871 30.8057 )
Norm@50keV   : 0.182876    ( -0.182865   0.578775 )
------------------------------------------------------------
#Fit statistic : Chi-Squared =          73.86 using 59 PHA bins.
# Reduced chi-squared =          1.343 for     55 degrees of freedom
# Null hypothesis probability =   4.574108e-02

Photon flux (15-150 keV)    in 1 sec:  (    ) ph/cm2/s
Energy fluence (15-150 keV)             : 3.85177e-07 ( -3.8517e-07  -7.0048e-08 ) ergs/cm2
Single BB
Spectral model blackbody:
------------------------------------------------------------
Parameters  : value    Lower 90%  Upper 90%
kT [keV]    : 14.8159  (-2.62537  2.865)
R^2/D10^2   : 0.709707  (-0.348585   0.735305)
(R is the radius in km and D10 is the distance to the source in units of 10 kpc)
------------------------------------------------------------
#Fit statistic : Chi-Squared =          79.33 using 59 PHA bins.
# Reduced chi-squared =          1.392 for     57 degrees of freedom
# Null hypothesis probability =   2.692206e-02

Energy  Fluence     90% Error
[keV]   [erg/cm2]   [erg/cm2]
15- 25  3.268e-08   1.090e-08
25- 50  1.284e-07   3.550e-08
50-150  1.907e-07   6.520e-08
15-150  3.518e-07   8.885e-08
Thermal bremsstrahlung (OTTB)

Spectral model: thermal bremsstrahlung
------------------------------------------------------------
Parameters  : value         Lower 90%    Upper 90%
kT [keV]    : 94.5201       (-34.1213      70.9878)
Norm        : 27.2064       (-5.95144     7.25225)
------------------------------------------------------------
#Fit statistic : Chi-Squared =          75.10 using 59 PHA bins.
# Reduced chi-squared =          1.317 for     57 degrees of freedom
# Null hypothesis probability =   5.437394e-02

Energy  Fluence     90% Error
[keV]   [erg/cm2]   [erg/cm2]
15- 25  7.107e-08   1.638e-08
25- 50  1.215e-07   2.413e-08
50-150  1.905e-07   1.064e-07
15-150  3.831e-07   1.188e-07
Double BB

Spectral model: bbodyrad<1> + bbodyrad<2>
------------------------------------------------------------
Parameters  : value         Lower 90%    Upper 90%
kT1 [keV]   : 5.50671        (-2.91176      3.25196)
R1^2/D10^2  : 14.0407        (-11.8358      514.463)
kT2 [keV]   : 18.9021        (-3.97956      6.08239)
R2^2/D10^2  : 0.231709    (-0.166467   0.329245)
------------------------------------------------------------
#Fit statistic : Chi-Squared =          71.93 using 59 PHA bins.
# Reduced chi-squared =          1.308 for     55 degrees of freedom
# Null hypothesis probability =   6.236722e-02

Energy  Fluence     90% Error
[keV]   [erg/cm2]   [erg/cm2]
15- 25  6.578e-08   3.746e-08
25- 50  1.188e-07   6.240e-08
50-150  2.075e-07   1.260e-07
15-150  3.921e-07   2.008e-07
Pre-slew spectrum (Pre-slew PHA with pre-slew DRM)
Power-law model

Spectral model in power-law:
------------------------------------------------------------
Parameters  : value       lower 90%   higher 90%
Photon index: 1.89764     ( -0.191063   0.19992 )
Norm@50keV  : 2.02625E-02    ( -0.00259979   0.00256623 )
------------------------------------------------------------
#Fit statistic : Chi-Squared =          65.92 using 59 PHA bins.
# Reduced chi-squared =          1.156 for     57 degrees of freedom
# Null hypothesis probability =   1.956754e-01

Photon flux (15-150 keV)    in 7.424 sec: 2.90494 ( -0.354131  0.355262 ) ph/cm2/s
Energy fluence (15-150 keV)             : 1.38299e-06 ( -1.74726e-07  1.75858e-07 ) ergs/cm2
Cutoff power-law model
Spectral model in the cutoff power-law:
------------------------------------------------------------
Parameters  : value       lower 90%   higher 90%
Photon index: 0.521821     ( -1.34273   0.98181 )
Epeak [keV] : 50.7398      ( -9.18518 18.0786 )
Norm@50keV  : 0.107622    ( -0.107631   0.454165 )
------------------------------------------------------------
#Fit statistic : Chi-Squared =          59.69 using 59 PHA bins.
# Reduced chi-squared =          1.066 for     56 degrees of freedom
# Null hypothesis probability =   3.429694e-01

Photon flux (15-150 keV)    in 7.424 sec: 2.76342 ( -0.36929  0.36941 ) ph/cm2/s
Energy fluence (15-150 keV)             : 1.29094e-06 ( -1.89223e-07  1.90685e-07 ) ergs/cm2
Band function
Spectral model in the Band function:
------------------------------------------------------------
Parameters  : value       lower 90%   higher 90%
alpha       : 0.594162   ( -1.85593   2.99559 )
beta        : -2.66671    ( 2.66718   0.586155 )
Epeak [keV] : 43.4683      ( -9.40372 17.7203 )
Norm@50keV   : 0.504054    ( -0.422264   34.8986 )
------------------------------------------------------------
#Fit statistic : Chi-Squared =          58.51 using 59 PHA bins.
# Reduced chi-squared =          1.064 for     55 degrees of freedom
# Null hypothesis probability =   3.477970e-01

Photon flux (15-150 keV)    in 7.424 sec:  (    ) ph/cm2/s
Energy fluence (15-150 keV)             : 1.30166e-06 ( -1.30161e-06  -1.83841e-07 ) ergs/cm2
S(25-50 keV) vs. S(50-100 keV) plot
S(25-50 keV)  = 4.03e-07
S(50-100 keV) = 4.33e-07
T90 vs. Hardness ratio plot

T90                                   = 6.17600005865097 sec.
Hardness ratio (energy fluence ratio) = 1.07444
Color vs. Color plot
Count Ratio  (25-50 keV) / (15-25 keV) = 1.46562
Count Ratio (50-100 keV) / (15-25 keV) = 0.849756
Mask shadow pattern
IMX = 1.540364286128175E+00, IMY = 1.332772111267381E-01
TIME vs. PHA plot around the trigger time

Blue+Cyan dotted lines: Time interval of the scaled map
From 0.000000 to 1.024000
TIME vs. DetID plot around the trigger time
Blue+Cyan dotted lines: Time interval of the scaled map
From 0.000000 to 1.024000
100 us light curve (15-350 keV)
Blue+Cyan dotted lines: Time interval of the scaled map
From 0.000000 to 1.024000
Spacecraft aspect plot

Bright source in the pre-burst/pre-slew/post-slew images
Pre-burst image of 15-350 keV band
Time interval of the image:
-47.835400 -0.584000

# RAcent  DECcent POSerr Theta    Phi  PeakCts   SNR AngSep     Name
#  [deg]    [deg]    ['] [deg]  [deg]                   [']
256.1105 -37.7977    5.8  56.6  -24.5  -0.7120  -2.0    6.5	4U 1700-377
256.3177 -36.4997    7.6  57.5  -23.4   0.6150   1.5    7.3	GX 349+2
264.8443 -44.3082  204.9  47.4  -23.9  -0.0085  -0.1    9.6	4U 1735-44
275.8213 -30.3519    6.0  52.1   -3.2   0.3768   1.9    5.4	H1820-303
284.9670 -24.9882    6.4  51.6    9.2  -0.4432  -1.8    5.5	HT1900.1-2455
263.0044 -33.8254    6.5  56.2  -16.3   0.5669   1.8    0.9	GX 354-0
 52.4709 -30.9631    3.6  54.1  177.1   0.9000   3.2 ------	UNKNOWN
  1.6704 -85.4068    2.0  27.9  -98.5   0.5851   5.7 ------	UNKNOWN
240.2067 -60.4971    2.8  46.8  -53.8   1.4451   4.2 ------	UNKNOWN
170.0745 -81.1670    3.1  40.9  -93.3   1.2122   3.8 ------	UNKNOWN
Pre-slew background subtracted image of 15-350 keV band
Time interval of the image:
-0.584000 6.840000

# RAcent  DECcent POSerr Theta    Phi  PeakCts   SNR AngSep     Name
#  [deg]    [deg]    ['] [deg]  [deg]                   [']
255.8610 -37.9796   19.8  56.6  -24.9   0.0917   0.6   10.1	4U 1700-377
256.5524 -36.3565  515.6  57.5  -23.1  -0.0037  -0.0    6.9	GX 349+2
264.8576 -44.2962    8.4  47.4  -23.8   0.0921   1.4   10.5	4U 1735-44
275.8495 -30.4367    4.5  52.0   -3.2   0.2393   2.5    5.7	H1820-303
285.0960 -24.8491    9.5  51.6    9.4  -0.1335  -1.2    5.4	HT1900.1-2455
263.0457 -33.8261    9.1  56.1  -16.3  -0.1759  -1.3    2.9	GX 354-0
 31.2184 -21.1189    2.9  51.1  150.3   0.6959   3.9 ------	UNKNOWN
312.5184 -28.3861    2.4  35.8   37.4   0.2839   4.8 ------	UNKNOWN
310.7138 -35.3702    2.4  30.5   28.7   0.2044   4.8 ------	UNKNOWN
271.0302 -27.2428    1.0  57.1   -4.9   2.0830  11.4 ------	UNKNOWN
 83.9144 -48.2427    2.2  56.1 -146.9   0.9459   5.2 ------	UNKNOWN
 91.9547 -61.2679    2.5  49.1 -131.9   0.6483   4.5 ------	UNKNOWN
Post-slew image of 15-350 keV band
Time interval of the image:
837.164600 962.743500

# RAcent  DECcent POSerr Theta    Phi  PeakCts   SNR AngSep     Name
#  [deg]    [deg]    ['] [deg]  [deg]                   [']
 83.6316  22.0154    0.8  42.2  -48.4   4.6965  14.9    0.1	Crab
 53.7467  53.2002    0.7  19.6 -116.6   2.5715  17.3 ------	UNKNOWN
281.3210  80.0797    2.9  57.8 -156.6   2.9106   4.1 ------	UNKNOWN
 95.0270  65.0999    2.3  43.3 -114.9   2.6899   5.0 ------	UNKNOWN
Plot creation:
Wed Sep 30 11:05:04 EDT 2015