Special notes of this burst
Image
Pre-slew 15.0-350.0 keV image (Event data)

#   RAcent    DECcent   POSerr    Theta     Phi              Peak Cts       SNR   Name
   67.4276     5.7302   0.0032    29.2594   -46.4609         3.8663000     59.666 TRIG_00655262

Foreground time interval of the image:
 -1.036   9.612 (delta_t =  10.648 [sec])
Background time interval of the image:
-331.107 -313.753 (delta_t =  17.355 [sec])
-239.608  -1.036 (delta_t = 238.572 [sec])
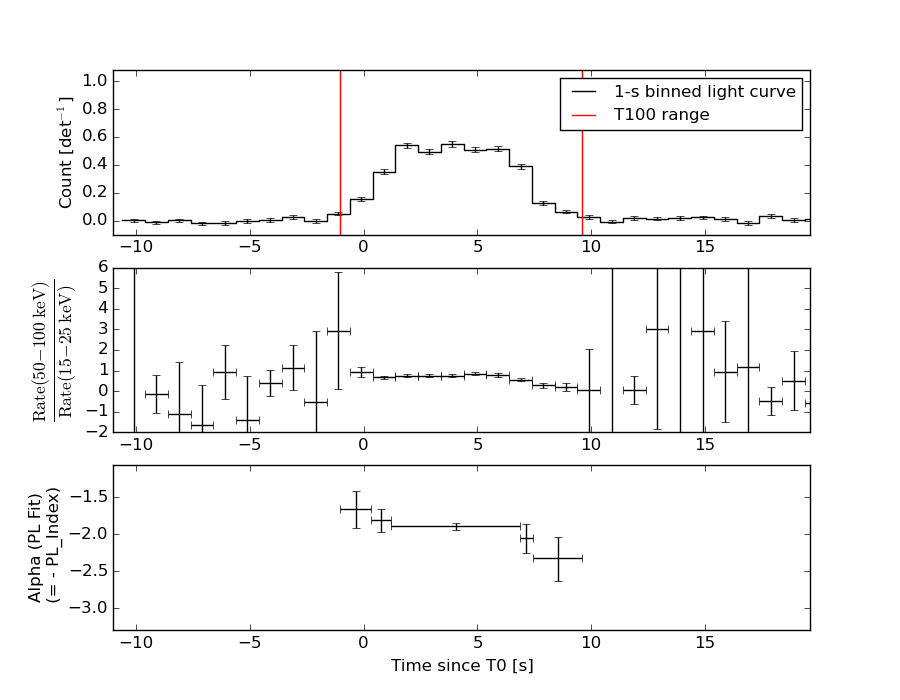
Lightcurves
Notes:
- 1) The mask-weighted light curves are using the flight position.
- 2) Multiple plots of different time binning/intervals are shown to cover all scenarios of short/long GRBs, rate/image triggers, and real/false positives.
- 3) For all the mask-weighted lightcurves, the y-axis units are counts/sec/det where a det is 0.4 x 0.4 = 0.16 sq cm.
- 4) The verticle lines correspond to following: green dotted lines are T50 interval, black dotted lines are T90 interval, blue solid line(s) is a spacecraft slew start time, and orange solid line(s) is a spacecraft slew end time.
- 5) Time of each bin is in the middle of the bin.
1 s binning
From T0-310 s to T0+310 s

From T100_start - 20 s to T100_end + 30 s

Full time interval

64 ms binning
Full time interval

From T100_start to T100_end

From T0-5 sec to T0+5 sec

16 ms binning
From T100_start-5 s to T100_start+5 s

Blue+Cyan dotted lines: Time interval of the scaled map
From 0.000000 to 0.512000
8 ms binning
From T100_start-3 s to T100_start+3 s

Blue+Cyan dotted lines: Time interval of the scaled map
From 0.000000 to 0.512000
2 ms binning
From T100_start-1 s to T100_start+1 s

Blue+Cyan dotted lines: Time interval of the scaled map
From 0.000000 to 0.512000
SN=5 or 10 sec. binning (whichever binning is satisfied first)

SN=5 or 10 sec. binning (T < 200 sec)

Quad-rate summed light curves (from T0-300s to T0+1000s)

Spectral Evolution
Spectra
Notes:
- 1) The fitting includes the systematic errors.
- 2) When the burst includes telescope slew time periods, the fitting uses an average response file made from multiple 5-s response files through out the slew time plus single time preiod for the non-slew times, and weighted by the total counts in the corresponding time period using addrmf. An average response file is needed becuase a spectral fit using the pre-slew DRM will introduce some errors in both a spectral shape and a normalization if the PHA file contains a lot of the slew/post-slew time interval.
- 3) For fits to more complicated models (e.g. a power-law over a cutoff power-law), the BAT team has decided to require a chi-square improvement of more than 6 for each extra dof.
Time averaged spectrum fit using the average DRM
Power-law model

Time interval is from   -1.036 sec. to    9.612 sec.

Spectral model in power-law:
------------------------------------------------------------
Parameters  : value       lower 90%   higher 90%
Photon index: 1.92945     ( -0.0517137   0.0520372 )
Norm@50keV  : 2.26401E-02    ( -0.000674447   0.000672961 )
------------------------------------------------------------
#Fit statistic : Chi-Squared =          97.43 using 59 PHA bins.
# Reduced chi-squared =          1.709 for     57 degrees of freedom
# Null hypothesis probability =   6.832098e-04

Photon flux (15-150 keV)    in 10.65 sec: 3.29045 ( -0.102651  0.103028 ) ph/cm2/s
Energy fluence (15-150 keV)             : 2.21775e-06 ( -6.52218e-08  6.53024e-08 ) ergs/cm2
Cutoff power-law model

Time interval is from   -1.036 sec. to    9.612 sec.
Spectral model in the cutoff power-law:
------------------------------------------------------------
Parameters  : value       lower 90%   higher 90%
Photon index: 1.01792     ( -0.263649   0.248601 )
Epeak [keV] : 51.5726      ( -3.44078 4.14332 )
Norm@50keV  : 6.63668E-02    ( -0.0165991   0.0238765 )
------------------------------------------------------------
#Fit statistic : Chi-Squared =          52.12 using 59 PHA bins.
# Reduced chi-squared =         0.9307 for     56 degrees of freedom
# Null hypothesis probability =   6.225730e-01

Photon flux (15-150 keV)    in 10.65 sec: 3.09697 ( -0.11233  0.11283 ) ph/cm2/s
Energy fluence (15-150 keV)             : 2.06652e-06 ( -7.51145e-08  7.5434e-08 ) ergs/cm2
Band function

Time interval is from   -1.036 sec. to    9.612 sec.

Spectral model in the Band function:
------------------------------------------------------------
Parameters  : value       lower 90%   higher 90%
alpha       : -0.388848   ( -0.646233   0.954989 )
beta        : -2.36362    ( -0.509809   0.174686 )
Epeak [keV] : 43.4937      ( -6.2038 8.06869 )
Norm@50keV   : 0.162106    ( -0.0995641   0.527703 )
------------------------------------------------------------
#Fit statistic : Chi-Squared =          47.24 using 59 PHA bins.
# Reduced chi-squared =         0.8590 for     55 degrees of freedom
# Null hypothesis probability =   7.621065e-01

Photon flux (15-150 keV)    in 10.65 sec:  (    ) ph/cm2/s
Energy fluence (15-150 keV)             : 2.08581e-06 ( -2.08574e-06  -7.29099e-08 ) ergs/cm2
Single BB

Spectral model blackbody:
------------------------------------------------------------
Parameters  : value    Lower 90%  Upper 90%
kT [keV]    : 12.2076  (  )
R^2/D10^2   : 0.703896  (   )
(R is the radius in km and D10 is the distance to the source in units of 10 kpc)
------------------------------------------------------------
#Fit statistic : Chi-Squared =         213.53 using 59 PHA bins.
# Reduced chi-squared =         3.7461 for     57 degrees of freedom
# Null hypothesis probability =   6.077476e-20

Energy  Fluence     90% Error
[keV]   [erg/cm2]   [erg/cm2]
15- 25  2.366e-07   1.193e-08
25- 50  7.596e-07   2.487e-08
50-150  6.884e-07   3.919e-08
15-150  1.685e-06   5.059e-08
Thermal bremsstrahlung (OTTB)

Spectral model: thermal bremsstrahlung
------------------------------------------------------------
Parameters  : value         Lower 90%    Upper 90%
kT [keV]    : 82.8585       (-7.25497      8.41692)
Norm        : 15.0708       (-0.711485     0.751951)
------------------------------------------------------------
#Fit statistic : Chi-Squared =          55.40 using 59 PHA bins.
# Reduced chi-squared =         0.9719 for     57 degrees of freedom
# Null hypothesis probability =   5.353227e-01

Energy  Fluence     90% Error
[keV]   [erg/cm2]   [erg/cm2]
15- 25  4.173e-07   1.853e-08
25- 50  6.928e-07   2.082e-08
50-150  1.001e-06   5.591e-08
15-150  2.111e-06   6.443e-08
Double BB

Spectral model: bbodyrad<1> + bbodyrad<2>
------------------------------------------------------------
Parameters  : value         Lower 90%    Upper 90%
kT1 [keV]   : 7.35670        (-0.82118      0.847429)
R1^2/D10^2  : 3.14317        (-0.891367      1.44769)
kT2 [keV]   : 21.0920        (-2.48822      3.63825)
R2^2/D10^2  : 5.73113E-02    (-0.0284053   0.0430748)
------------------------------------------------------------
#Fit statistic : Chi-Squared =          51.32 using 59 PHA bins.
# Reduced chi-squared =         0.9331 for     55 degrees of freedom
# Null hypothesis probability =   6.159190e-01

Energy  Fluence     90% Error
[keV]   [erg/cm2]   [erg/cm2]
15- 25  3.568e-07   3.296e-08
25- 50  7.238e-07   5.011e-08
50-150  9.663e-07   1.395e-07
15-150  2.047e-06   1.800e-07
Peak spectrum fit
Power-law model

Time interval is from    3.896 sec. to    4.896 sec.

Spectral model in power-law:
------------------------------------------------------------
Parameters  : value       lower 90%   higher 90%
Photon index: 1.72633     ( -0.0933311   0.0946146 )
Norm@50keV  : 3.84703E-02    ( -0.00225833   0.00224608 )
------------------------------------------------------------
#Fit statistic : Chi-Squared =          55.12 using 59 PHA bins.
# Reduced chi-squared =         0.9671 for     57 degrees of freedom
# Null hypothesis probability =   5.457963e-01

Photon flux (15-150 keV)    in 1 sec: 5.15719 ( -0.291132  0.291423 ) ph/cm2/s
Energy fluence (15-150 keV)             : 3.55504e-07 ( -2.16414e-08  2.1741e-08 ) ergs/cm2
Cutoff power-law model

Time interval is from    3.896 sec. to    4.896 sec.
Spectral model in the cutoff power-law:
------------------------------------------------------------
Parameters  : value       lower 90%   higher 90%
Photon index: 1.05840     ( -0.43621   0.395239 )
Epeak [keV] : 67.2248      ( -11.0557 30.3454 )
Norm@50keV  : 8.63756E-02    ( -0.0322756   0.0588398 )
------------------------------------------------------------
#Fit statistic : Chi-Squared =          46.28 using 59 PHA bins.
# Reduced chi-squared =         0.8264 for     56 degrees of freedom
# Null hypothesis probability =   8.195576e-01

Photon flux (15-150 keV)    in 1 sec: 5.02248 ( -0.30178  0.30173 ) ph/cm2/s
Energy fluence (15-150 keV)             : 3.3942e-07 ( -2.3702e-08  2.378e-08 ) ergs/cm2
Band function

Time interval is from    3.896 sec. to    4.896 sec.

Spectral model in the Band function:
------------------------------------------------------------
Parameters  : value       lower 90%   higher 90%
alpha       : -0.978053   ( -0.45039   3.15498 )
beta        : -2.34692    ( 2.35226   0.507711 )
Epeak [keV] : 63.2163      ( -32.0294 30.2602 )
Norm@50keV   : 9.65955E-02    ( -0.040897   19.1884 )
------------------------------------------------------------
#Fit statistic : Chi-Squared =          45.94 using 59 PHA bins.
# Reduced chi-squared =         0.8352 for     55 degrees of freedom
# Null hypothesis probability =   8.029780e-01

Photon flux (15-150 keV)    in 1 sec:  (    ) ph/cm2/s
Energy fluence (15-150 keV)             : 3.39573e-07 ( -3.39566e-07  -2.3606e-08 ) ergs/cm2
Single BB

Spectral model blackbody:
------------------------------------------------------------
Parameters  : value    Lower 90%  Upper 90%
kT [keV]    : 12.8531  (-0.821424  0.887389)
R^2/D10^2   : 0.985800  (-0.216829   0.273675)
(R is the radius in km and D10 is the distance to the source in units of 10 kpc)
------------------------------------------------------------
#Fit statistic : Chi-Squared =         104.67 using 59 PHA bins.
# Reduced chi-squared =         1.8364 for     57 degrees of freedom
# Null hypothesis probability =   1.219605e-04

Energy  Fluence     90% Error
[keV]   [erg/cm2]   [erg/cm2]
15- 25  3.454e-08   3.825e-09
25- 50  1.175e-07   8.000e-09
50-150  1.219e-07   1.500e-08
15-150  2.740e-07   1.830e-08
Thermal bremsstrahlung (OTTB)

Spectral model: thermal bremsstrahlung
------------------------------------------------------------
Parameters  : value         Lower 90%    Upper 90%
kT [keV]    : 122.452       (-24.9634      32.5508)
Norm        : 21.9168       (-1.51099     1.77583)
------------------------------------------------------------
#Fit statistic : Chi-Squared =          47.10 using 59 PHA bins.
# Reduced chi-squared =         0.8263 for     57 degrees of freedom
# Null hypothesis probability =   8.222510e-01

Energy  Fluence     90% Error
[keV]   [erg/cm2]   [erg/cm2]
15- 25  5.704e-08   5.250e-09
25- 50  1.024e-07   7.095e-09
50-150  1.845e-07   5.405e-08
15-150  3.440e-07   6.020e-08
Double BB

Spectral model: bbodyrad<1> + bbodyrad<2>
------------------------------------------------------------
Parameters  : value         Lower 90%    Upper 90%
kT1 [keV]   : 6.41363        (-1.30916      1.56572)
R1^2/D10^2  : 7.34505        (-3.64907      9.07294)
kT2 [keV]   : 20.6004        (-3.13201      5.35)
R2^2/D10^2  : 0.131206    (-0.0806185   0.129669)
------------------------------------------------------------
#Fit statistic : Chi-Squared =          47.54 using 59 PHA bins.
# Reduced chi-squared =         0.8643 for     55 degrees of freedom
# Null hypothesis probability =   7.524026e-01

Energy  Fluence     90% Error
[keV]   [erg/cm2]   [erg/cm2]
15- 25  5.452e-08   1.255e-08
25- 50  1.043e-07   2.148e-08
50-150  1.761e-07   4.350e-08
15-150  3.349e-07   6.110e-08
Pre-slew spectrum (Pre-slew PHA with pre-slew DRM)
Power-law model

Spectral model in power-law:
------------------------------------------------------------
Parameters  : value       lower 90%   higher 90%
Photon index: 1.92945     ( -0.0517137   0.0520372 )
Norm@50keV  : 2.26401E-02    ( -0.000674447   0.000672961 )
------------------------------------------------------------
#Fit statistic : Chi-Squared =          97.43 using 59 PHA bins.
# Reduced chi-squared =          1.709 for     57 degrees of freedom
# Null hypothesis probability =   6.832098e-04

Photon flux (15-150 keV)    in 10.65 sec: 3.29045 ( -0.102651  0.103028 ) ph/cm2/s
Energy fluence (15-150 keV)             : 2.21775e-06 ( -6.52218e-08  6.53024e-08 ) ergs/cm2
Cutoff power-law model
Spectral model in the cutoff power-law:
------------------------------------------------------------
Parameters  : value       lower 90%   higher 90%
Photon index: 1.01792     ( -0.263649   0.248601 )
Epeak [keV] : 51.5726      ( -3.44078 4.14332 )
Norm@50keV  : 6.63668E-02    ( -0.0165991   0.0238765 )
------------------------------------------------------------
#Fit statistic : Chi-Squared =          52.12 using 59 PHA bins.
# Reduced chi-squared =         0.9307 for     56 degrees of freedom
# Null hypothesis probability =   6.225730e-01

Photon flux (15-150 keV)    in 10.65 sec: 3.09697 ( -0.11233  0.11283 ) ph/cm2/s
Energy fluence (15-150 keV)             : 2.06652e-06 ( -7.51145e-08  7.5434e-08 ) ergs/cm2
Band function
Spectral model in the Band function:
------------------------------------------------------------
Parameters  : value       lower 90%   higher 90%
alpha       : -0.388848   ( -0.646233   0.954989 )
beta        : -2.36362    ( -0.509809   0.174686 )
Epeak [keV] : 43.4937      ( -6.2038 8.06869 )
Norm@50keV   : 0.162106    ( -0.0995641   0.527703 )
------------------------------------------------------------
#Fit statistic : Chi-Squared =          47.24 using 59 PHA bins.
# Reduced chi-squared =         0.8590 for     55 degrees of freedom
# Null hypothesis probability =   7.621065e-01

Photon flux (15-150 keV)    in 10.65 sec:  (    ) ph/cm2/s
Energy fluence (15-150 keV)             : 2.08581e-06 ( -2.08574e-06  -7.29099e-08 ) ergs/cm2
S(25-50 keV) vs. S(50-100 keV) plot

S(25-50 keV)  = 6.53e-07
S(50-100 keV) = 6.86e-07
T90 vs. Hardness ratio plot

T90                                   = 7.13599991798401 sec.
Hardness ratio (energy fluence ratio) = 1.05054
Color vs. Color plot

Count Ratio  (25-50 keV) / (15-25 keV) = 1.35482
Count Ratio (50-100 keV) / (15-25 keV) = 0.714373
Mask shadow pattern

IMX = 3.859220204291111E-01, IMY = 4.061216438628479E-01
TIME vs. PHA plot around the trigger time
Blue+Cyan dotted lines: Time interval of the scaled map
From 0.000000 to 0.512000
TIME vs. DetID plot around the trigger time

Blue+Cyan dotted lines: Time interval of the scaled map
From 0.000000 to 0.512000
100 us light curve (15-350 keV)

Blue+Cyan dotted lines: Time interval of the scaled map
From 0.000000 to 0.512000
Spacecraft aspect plot
Bright source in the pre-burst/pre-slew/post-slew images
Pre-burst image of 15-350 keV band
Time interval of the image:
-331.107400 -313.752700
-239.608000 -1.036000

# RAcent  DECcent POSerr Theta    Phi  PeakCts   SNR AngSep     Name
#  [deg]    [deg]    ['] [deg]  [deg]                   [']
  0.1199   6.9115    3.0  39.8  105.7   3.3842   3.9  414.8	UNKNOWN
 53.7371  53.1658    1.1  38.2 -141.4   3.3977  10.6 ------	UNKNOWN
 52.8183  69.0330    2.8  53.1 -149.2   3.1505   4.1 ------	UNKNOWN
 75.6458  56.1866    2.9  48.0 -129.0   3.6996   3.9 ------	UNKNOWN
 77.0078  52.9546    2.4  46.6 -124.9   4.6806   4.8 ------	UNKNOWN
Pre-slew background subtracted image of 15-350 keV band
Time interval of the image:
-1.036000 9.612000

# RAcent  DECcent POSerr Theta    Phi  PeakCts   SNR AngSep     Name
#  [deg]    [deg]    ['] [deg]  [deg]                   [']
 48.4036 -36.9370    2.4  54.2   16.3   1.2323   4.8 ------	UNKNOWN
 27.8045  30.0898    3.1  17.3  168.2   0.1918   3.7 ------	UNKNOWN
 67.4276   5.7302    0.2  29.3  -46.5   3.8662  59.7 ------	UNKNOWN
Post-slew image of 15-350 keV band
Time interval of the image:
63.892600 962.455100

# RAcent  DECcent POSerr Theta    Phi  PeakCts   SNR AngSep     Name
#  [deg]    [deg]    ['] [deg]  [deg]                   [']
 83.6362  22.0113    0.2  22.6 -131.6  36.8914  54.6    0.3	Crab
 59.3210 -46.4914    2.7  52.7   13.0  12.0267   4.2 ------	UNKNOWN
 53.7760  53.1985    2.3  48.8  175.2   7.7951   5.1 ------	UNKNOWN
106.2357  50.6385    6.1  55.3 -145.1   7.8084   1.9 ------	UNKNOWN
108.8260 -17.1360    3.6  46.9  -54.0   8.9086   3.2 ------	UNKNOWN
Plot creation:
Wed Sep 30 10:57:45 EDT 2015