Special notes of this burst
Image
Pre-slew 15.0-350.0 keV image (Event data)

#   RAcent    DECcent   POSerr    Theta     Phi              Peak Cts       SNR   Name
  233.7110    10.9796   0.0087     2.3963   178.5098         1.0837381     22.082 TRIG_00657286

Foreground time interval of the image:
 -6.288   7.776 (delta_t =  14.064 [sec])
Background time interval of the image:
-463.743 -446.933 (delta_t =  16.811 [sec])
-239.144  -6.288 (delta_t = 232.856 [sec])
Lightcurves
Notes:
- 1) The mask-weighted light curves are using the flight position.
- 2) Multiple plots of different time binning/intervals are shown to cover all scenarios of short/long GRBs, rate/image triggers, and real/false positives.
- 3) For all the mask-weighted lightcurves, the y-axis units are counts/sec/det where a det is 0.4 x 0.4 = 0.16 sq cm.
- 4) The verticle lines correspond to following: green dotted lines are T50 interval, black dotted lines are T90 interval, blue solid line(s) is a spacecraft slew start time, and orange solid line(s) is a spacecraft slew end time.
- 5) Time of each bin is in the middle of the bin.
1 s binning
From T0-310 s to T0+310 s

From T100_start - 20 s to T100_end + 30 s

Full time interval

64 ms binning
Full time interval

From T100_start to T100_end
From T0-5 sec to T0+5 sec

16 ms binning
From T100_start-5 s to T100_start+5 s

Blue+Cyan dotted lines: Time interval of the scaled map
From 0.000000 to 1.024000
8 ms binning
From T100_start-3 s to T100_start+3 s

Blue+Cyan dotted lines: Time interval of the scaled map
From 0.000000 to 1.024000
2 ms binning
From T100_start-1 s to T100_start+1 s

Blue+Cyan dotted lines: Time interval of the scaled map
From 0.000000 to 1.024000
SN=5 or 10 sec. binning (whichever binning is satisfied first)

SN=5 or 10 sec. binning (T < 200 sec)

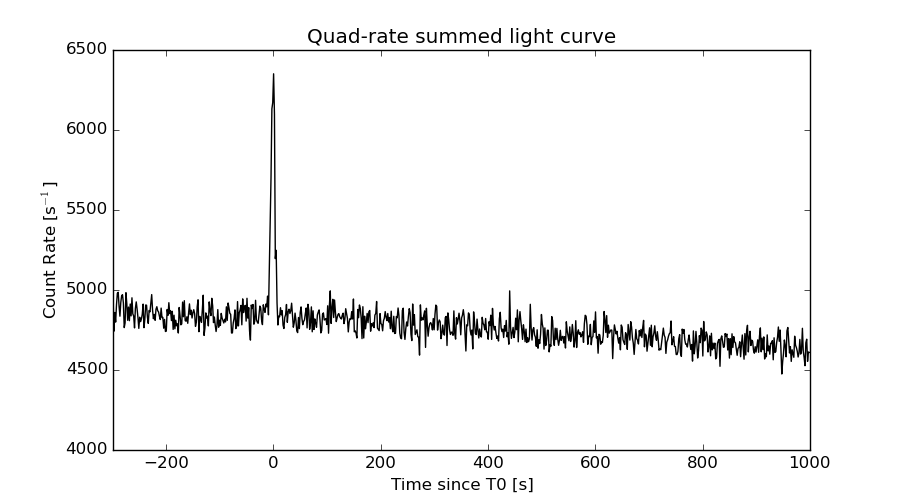
Quad-rate summed light curves (from T0-300s to T0+1000s)
Spectral Evolution

Spectra
Notes:
- 1) The fitting includes the systematic errors.
- 2) When the burst includes telescope slew time periods, the fitting uses an average response file made from multiple 5-s response files through out the slew time plus single time preiod for the non-slew times, and weighted by the total counts in the corresponding time period using addrmf. An average response file is needed becuase a spectral fit using the pre-slew DRM will introduce some errors in both a spectral shape and a normalization if the PHA file contains a lot of the slew/post-slew time interval.
- 3) For fits to more complicated models (e.g. a power-law over a cutoff power-law), the BAT team has decided to require a chi-square improvement of more than 6 for each extra dof.
Time averaged spectrum fit using the average DRM
Power-law model

Time interval is from   -6.288 sec. to    7.776 sec.

Spectral model in power-law:
------------------------------------------------------------
Parameters  : value       lower 90%   higher 90%
Photon index: 1.20191     ( -0.120308   0.119024 )
Norm@50keV  : 4.86950E-03    ( -0.000322747   0.000322725 )
------------------------------------------------------------
#Fit statistic : Chi-Squared =          44.98 using 59 PHA bins.
# Reduced chi-squared =         0.7891 for     57 degrees of freedom
# Null hypothesis probability =   8.754914e-01

Photon flux (15-150 keV)    in 14.06 sec: 0.571735 ( -0.0392871  0.0393588 ) ph/cm2/s
Energy fluence (15-150 keV)             : 6.94231e-07 ( -5.09502e-08  5.12359e-08 ) ergs/cm2
Cutoff power-law model

Time interval is from   -6.288 sec. to    7.776 sec.
Spectral model in the cutoff power-law:
------------------------------------------------------------
Parameters  : value       lower 90%   higher 90%
Photon index: 0.963717     ( -0.495008   0.295476 )
Epeak [keV] : 235.665      ( -235.665 -235.665 )
Norm@50keV  : 6.30062E-03    ( -0.00167587   0.00427238 )
------------------------------------------------------------
#Fit statistic : Chi-Squared =          44.17 using 59 PHA bins.
# Reduced chi-squared =         0.7888 for     56 degrees of freedom
# Null hypothesis probability =   8.735262e-01

Photon flux (15-150 keV)    in 14.06 sec: 0.564791 ( -0.041395  0.041368 ) ph/cm2/s
Energy fluence (15-150 keV)             : 6.83114e-07 ( -5.60797e-08  5.55961e-08 ) ergs/cm2
Band function

Time interval is from   -6.288 sec. to    7.776 sec.

Spectral model in the Band function:
------------------------------------------------------------
Parameters  : value       lower 90%   higher 90%
alpha       : -0.353390   ( 0.481418   4.63958 )
beta        : -1.31307    ( 1.30979   0.190335 )
Epeak [keV] : 74.6105      ( -72.4781 249.109 )
Norm@50keV   : 1.51561E-02    ( -0.0161554   271570 )
------------------------------------------------------------
#Fit statistic : Chi-Squared =          43.51 using 59 PHA bins.
# Reduced chi-squared =         0.7911 for     55 degrees of freedom
# Null hypothesis probability =   8.681301e-01

Photon flux (15-150 keV)    in 14.06 sec:  (    ) ph/cm2/s
Energy fluence (15-150 keV)             : 0 ( 0  0 ) ergs/cm2
Single BB

Spectral model blackbody:
------------------------------------------------------------
Parameters  : value    Lower 90%  Upper 90%
kT [keV]    : 18.8227  (-1.69355  1.92158)
R^2/D10^2   : 3.15299E-02  (-0.00864336   0.0116214)
(R is the radius in km and D10 is the distance to the source in units of 10 kpc)
------------------------------------------------------------
#Fit statistic : Chi-Squared =          85.34 using 59 PHA bins.
# Reduced chi-squared =          1.497 for     57 degrees of freedom
# Null hypothesis probability =   8.900305e-03

Energy  Fluence     90% Error
[keV]   [erg/cm2]   [erg/cm2]
15- 25  3.098e-08   4.239e-09
25- 50  1.480e-07   1.424e-08
50-150  3.846e-07   4.443e-08
15-150  5.636e-07   5.048e-08
Thermal bremsstrahlung (OTTB)

Spectral model: thermal bremsstrahlung
------------------------------------------------------------
Parameters  : value         Lower 90%    Upper 90%
kT [keV]    : 200.000       (-14.2695      -200)
Norm        : 2.37521       (-0.160416     0.160416)
------------------------------------------------------------
#Fit statistic : Chi-Squared =          67.87 using 59 PHA bins.
# Reduced chi-squared =          1.191 for     57 degrees of freedom
# Null hypothesis probability =   1.535859e-01

Energy  Fluence     90% Error
[keV]   [erg/cm2]   [erg/cm2]
15- 25  8.314e-08   7.227e-09
25- 50  1.599e-07   1.900e-08
50-150  3.508e-07   1.281e-07
15-150  5.938e-07   1.014e-07
Double BB

Spectral model: bbodyrad<1> + bbodyrad<2>
------------------------------------------------------------
Parameters  : value         Lower 90%    Upper 90%
kT1 [keV]   : 8.67239        (-1.92167      2.26841)
R1^2/D10^2  : 0.243670        (-0.118448      0.283324)
kT2 [keV]   : 33.9948        (-7.61885      18.3076)
R2^2/D10^2  : 3.77823E-03    (-0.00271687   0.0052916)
------------------------------------------------------------
#Fit statistic : Chi-Squared =          43.50 using 59 PHA bins.
# Reduced chi-squared =         0.7910 for     55 degrees of freedom
# Null hypothesis probability =   8.683843e-01

Energy  Fluence     90% Error
[keV]   [erg/cm2]   [erg/cm2]
15- 25  5.802e-08   1.696e-08
25- 50  1.559e-07   4.027e-08
50-150  4.748e-07   2.152e-07
15-150  6.887e-07   2.413e-07
Peak spectrum fit
Power-law model

Time interval is from   -0.044 sec. to    0.956 sec.

Spectral model in power-law:
------------------------------------------------------------
Parameters  : value       lower 90%   higher 90%
Photon index: 1.19743     ( -0.201016   0.198223 )
Norm@50keV  : 1.11419E-02    ( -0.00129781   0.00129781 )
------------------------------------------------------------
#Fit statistic : Chi-Squared =          54.10 using 59 PHA bins.
# Reduced chi-squared =         0.9491 for     57 degrees of freedom
# Null hypothesis probability =   5.847220e-01

Photon flux (15-150 keV)    in 1 sec: 1.30735 ( -0.156146  0.156457 ) ph/cm2/s
Energy fluence (15-150 keV)             : 1.13121e-07 ( -1.45905e-08  1.47174e-08 ) ergs/cm2
Cutoff power-law model

Time interval is from   -0.044 sec. to    0.956 sec.
Spectral model in the cutoff power-law:
------------------------------------------------------------
Parameters  : value       lower 90%   higher 90%
Photon index: 0.602522     ( -0.974903   0.704979 )
Epeak [keV] : 126.667      ( -49.1677 -126.667 )
Norm@50keV  : 2.13023E-02    ( -0.00962457   0.0380381 )
------------------------------------------------------------
#Fit statistic : Chi-Squared =          52.53 using 59 PHA bins.
# Reduced chi-squared =         0.9380 for     56 degrees of freedom
# Null hypothesis probability =   6.070013e-01

Photon flux (15-150 keV)    in 1 sec: 1.27547 ( -0.16312  0.16231 ) ph/cm2/s
Energy fluence (15-150 keV)             : 1.09157e-07 ( -1.59387e-08  1.5826e-08 ) ergs/cm2
Band function
Time interval is from   -0.044 sec. to    0.956 sec.

Spectral model in the Band function:
------------------------------------------------------------
Parameters  : value       lower 90%   higher 90%
alpha       : -0.607333   ( -0.44484   0.717462 )
beta        : -9.37167    ( 9.37167   19.3717 )
Epeak [keV] : 128.895      ( -38.3822 289.165 )
Norm@50keV   : 2.10328E-02    ( -0.00760726   0.0114584 )
------------------------------------------------------------
#Fit statistic : Chi-Squared =          52.53 using 59 PHA bins.
# Reduced chi-squared =         0.9552 for     55 degrees of freedom
# Null hypothesis probability =   5.694256e-01

Photon flux (15-150 keV)    in 1 sec: 1.28017 (    ) ph/cm2/s
Energy fluence (15-150 keV)             : 0 ( 0  0 ) ergs/cm2
Single BB

Spectral model blackbody:
------------------------------------------------------------
Parameters  : value    Lower 90%  Upper 90%
kT [keV]    : 18.4490  (-2.59716  3.17651)
R^2/D10^2   : 7.93139E-02  (-0.0324613   0.0523113)
(R is the radius in km and D10 is the distance to the source in units of 10 kpc)
------------------------------------------------------------
#Fit statistic : Chi-Squared =          61.90 using 59 PHA bins.
# Reduced chi-squared =          1.086 for     57 degrees of freedom
# Null hypothesis probability =   3.056714e-01

Energy  Fluence     90% Error
[keV]   [erg/cm2]   [erg/cm2]
15- 25  5.361e-09   1.232e-09
25- 50  2.525e-08   4.630e-09
50-150  6.276e-08   1.440e-08
15-150  9.337e-08   1.612e-08
Thermal bremsstrahlung (OTTB)

Spectral model: thermal bremsstrahlung
------------------------------------------------------------
Parameters  : value         Lower 90%    Upper 90%
kT [keV]    : 200.000       (-34.8282      -200)
Norm        : 5.39767       (-0.641146     0.641146)
------------------------------------------------------------
#Fit statistic : Chi-Squared =          61.68 using 59 PHA bins.
# Reduced chi-squared =          1.082 for     57 degrees of freedom
# Null hypothesis probability =   3.123842e-01

Energy  Fluence     90% Error
[keV]   [erg/cm2]   [erg/cm2]
15- 25  1.344e-08   7.470e-09
25- 50  2.585e-08   1.425e-08
50-150  5.669e-08   3.127e-08
15-150  9.598e-08   5.320e-08
Double BB

------------------------------------------------------------
Parameters  : value         Lower 90%    Upper 90%
kT1 [keV]   : 9.60239        (-8.12358      5.35862)
R1^2/D10^2  : 0.374931        (-0.245386      1597.41)
kT2 [keV]   : 31.3594        (-14.5807      -31.7954)
R2^2/D10^2  : 1.03461E-02    (-0.00987318   0.0749837)
------------------------------------------------------------
#Fit statistic : Chi-Squared =          55.34 using 59 PHA bins.
#Fit statistic : Chi-Squared =          52.86 using 59 PHA bins.
# Reduced chi-squared =          1.006 for     55 degrees of freedom
# Reduced chi-squared =         0.9612 for     55 degrees of freedom
# Null hypothesis probability =   4.617553e-01
# Null hypothesis probability =   5.566454e-01

Energy  Fluence     90% Error
[keV]   [erg/cm2]   [erg/cm2]
15- 25  8.858e-09   3.147e-09
25- 50  2.290e-08   5.500e-09
50-150  6.732e-08   1.641e-08
15-150  9.908e-08   1.833e-08
Pre-slew spectrum (Pre-slew PHA with pre-slew DRM)
Power-law model

Spectral model in power-law:
------------------------------------------------------------
Parameters  : value       lower 90%   higher 90%
Photon index: 1.20191     ( -0.120308   0.119024 )
Norm@50keV  : 4.86950E-03    ( -0.000322747   0.000322725 )
------------------------------------------------------------
#Fit statistic : Chi-Squared =          44.98 using 59 PHA bins.
# Reduced chi-squared =         0.7891 for     57 degrees of freedom
# Null hypothesis probability =   8.754914e-01

Photon flux (15-150 keV)    in 14.06 sec: 0.571735 ( -0.0392871  0.0393588 ) ph/cm2/s
Energy fluence (15-150 keV)             : 6.94231e-07 ( -5.09502e-08  5.12359e-08 ) ergs/cm2
Cutoff power-law model

Spectral model in the cutoff power-law:
------------------------------------------------------------
Parameters  : value       lower 90%   higher 90%
Photon index: 0.963717     ( -0.495008   0.295476 )
Epeak [keV] : 235.665      ( -235.665 -235.665 )
Norm@50keV  : 6.30062E-03    ( -0.00167587   0.00427238 )
------------------------------------------------------------
#Fit statistic : Chi-Squared =          44.17 using 59 PHA bins.
# Reduced chi-squared =         0.7888 for     56 degrees of freedom
# Null hypothesis probability =   8.735262e-01

Photon flux (15-150 keV)    in 14.06 sec: 0.564791 ( -0.041395  0.041368 ) ph/cm2/s
Energy fluence (15-150 keV)             : 6.83114e-07 ( -5.60797e-08  5.55961e-08 ) ergs/cm2
Band function

Spectral model in the Band function:
------------------------------------------------------------
Parameters  : value       lower 90%   higher 90%
alpha       : -0.353390   ( 0.481418   4.63958 )
beta        : -1.31307    ( 1.30979   0.190335 )
Epeak [keV] : 74.6105      ( -72.4781 249.11 )
Norm@50keV   : 1.51561E-02    ( -0.0161554   271570 )
------------------------------------------------------------
#Fit statistic : Chi-Squared =          43.51 using 59 PHA bins.
# Reduced chi-squared =         0.7911 for     55 degrees of freedom
# Null hypothesis probability =   8.681301e-01

Photon flux (15-150 keV)    in 14.06 sec:  (    ) ph/cm2/s
Energy fluence (15-150 keV)             : 0 ( 0  0 ) ergs/cm2
S(25-50 keV) vs. S(50-100 keV) plot

S(25-50 keV)  = 1.46e-07
S(50-100 keV) = 2.54e-07
T90 vs. Hardness ratio plot
T90                                   = 9.82799994945526 sec.
Hardness ratio (energy fluence ratio) = 1.73973
Color vs. Color plot

Count Ratio  (25-50 keV) / (15-25 keV) = 1.73115
Count Ratio (50-100 keV) / (15-25 keV) = 1.48901
Mask shadow pattern

IMX = -4.183390703165987E-02, IMY = -1.088327625007844E-03
TIME vs. PHA plot around the trigger time

Blue+Cyan dotted lines: Time interval of the scaled map
From 0.000000 to 1.024000
TIME vs. DetID plot around the trigger time

Blue+Cyan dotted lines: Time interval of the scaled map
From 0.000000 to 1.024000
100 us light curve (15-350 keV)

Blue+Cyan dotted lines: Time interval of the scaled map
From 0.000000 to 1.024000
Spacecraft aspect plot

Bright source in the pre-burst/pre-slew/post-slew images
Pre-burst image of 15-350 keV band
Time interval of the image:
-463.743400 -446.932600
-239.143600 -6.288000

# RAcent  DECcent POSerr Theta    Phi  PeakCts   SNR AngSep     Name
#  [deg]    [deg]    ['] [deg]  [deg]                   [']
244.9953 -15.6319    0.4  31.2 -174.4   8.1558  30.1    1.0	Sco X-1
254.4385  35.3627    8.0  29.9   67.2   0.6176   1.4    1.5	Her X-1
256.1258 -37.8490  695.5  55.5 -173.2  -0.0132  -0.0    6.6	4U 1700-377
256.4194 -36.4586   40.0  54.4 -174.3  -0.2268  -0.3    2.3	GX 349+2
262.9989 -24.7447  154.6  48.1  171.1   0.0428   0.1    0.6	GX 1+4
268.3772  -1.5084    7.9  38.5  139.0   0.7886   1.5    3.4	SW J1753.5-0127
270.2649 -25.1024    4.0  53.0  165.4  -3.1151  -2.9    1.7	GX 5-1
270.2267 -25.8184    6.1  53.5  166.1  -2.1343  -1.9    6.1	GRS 1758-258
273.8610 -13.9701    0.0  49.1  151.3   1.1895   1.1    9.3	GX 17+2
263.1579 -33.8883   16.8  55.3  178.4  -0.7232  -0.7    9.0	GX 354-0
254.3176 -15.3003    2.5  35.7  171.4   1.4749   4.7 ------	UNKNOWN
210.3304 -26.7687    2.2  45.2 -122.3   5.0854   5.1 ------	UNKNOWN
Pre-slew background subtracted image of 15-350 keV band
Time interval of the image:
-6.288000 7.776000

# RAcent  DECcent POSerr Theta    Phi  PeakCts   SNR AngSep     Name
#  [deg]    [deg]    ['] [deg]  [deg]                   [']
244.7912 -15.5864   31.8  31.1 -174.1   0.0196   0.4   11.3	Sco X-1
254.3468  35.4541    7.3  29.9   67.0  -0.1297  -1.6    8.6	Her X-1
256.0174 -37.8879    6.0  55.5 -173.1   0.3323   1.9    3.0	4U 1700-377
256.4820 -36.4718    3.5  54.4 -174.3   0.5157   3.3    3.7	GX 349+2
263.0229 -24.7714    4.4  48.2  171.1  -0.3271  -2.6    1.7	GX 1+4
268.2703  -1.5773  154.7  38.4  139.1  -0.0081  -0.1    9.5	SW J1753.5-0127
270.2117 -25.1595    5.5  53.0  165.5   0.4761   2.1    6.2	GX 5-1
270.3973 -25.7475    5.6  53.6  165.9   0.4887   2.1    5.1	GRS 1758-258
274.0026 -13.8801    9.5  49.2  151.1  -0.2524  -1.2    9.4	GX 17+2
262.9889 -33.8344  190.6  55.2  178.5  -0.0137  -0.1    0.0	GX 354-0
233.7110  10.9796    0.5   2.4  178.5   1.0836  22.1 ------	UNKNOWN
220.2488 -24.9079    2.5  39.8 -133.2   0.3759   4.5 ------	UNKNOWN
Post-slew image of 15-350 keV band
Time interval of the image:
44.156600 962.894200

# RAcent  DECcent POSerr Theta    Phi  PeakCts   SNR AngSep     Name
#  [deg]    [deg]    ['] [deg]  [deg]                   [']
244.9976 -15.6360    0.3  28.9  171.8  30.8604  43.3    1.1	Sco X-1
254.6226  35.3914   16.0  30.9   49.2   0.7749   0.7    8.6	Her X-1
255.9255 -37.7023    3.9  52.9  172.7   6.9260   3.0    9.0	4U 1700-377
256.3402 -36.4975   30.6  52.0  171.6   0.8549   0.4    6.4	GX 349+2
262.9943 -24.5932   11.9  45.6  156.2   2.0685   1.0    9.2	GX 1+4
268.2445  -1.6281    0.0  36.6  122.8   1.0112   0.7   12.9	SW J1753.5-0127
270.2158 -25.2733    8.1  50.8  150.7   4.8093   1.4   12.2	GX 5-1
270.3410 -25.7491    4.2  51.2  151.1   9.0052   2.7    2.1	GRS 1758-258
274.1202 -13.8402    6.0  47.1  135.5   6.0908   1.9   13.5	GX 17+2
262.9833 -33.8447  175.3  52.8  164.0  -0.1914  -0.1    0.7	GX 354-0
267.4860  42.0613    3.1  42.8   52.1   9.1160   3.8 ------	UNKNOWN
254.5026  29.5213    3.0  26.8   57.9   3.7756   3.8 ------	UNKNOWN
237.6819  19.6585    2.8   9.5   37.9   2.7824   4.2 ------	UNKNOWN
216.9867  19.4325    2.2  18.2  -45.7   3.2382   5.3 ------	UNKNOWN
199.1754  41.3649    3.3  42.9  -24.0   3.9738   3.5 ------	UNKNOWN
233.7498 -46.5729    3.5  57.6 -165.3   9.6853   3.3 ------	UNKNOWN
178.8831  48.6962    3.5  58.9  -24.4  19.9616   3.2 ------	UNKNOWN
217.1422 -45.3705    2.9  58.3 -151.7  14.7891   4.0 ------	UNKNOWN
200.5763 -11.9061    3.5  40.1 -109.1   7.4326   3.3 ------	UNKNOWN
211.7776 -40.4966    4.8  55.3 -145.1  10.5874   2.4 ------	UNKNOWN
Plot creation:
Sun Nov  1 14:39:13 EST 2015