Special notes of this burst
Image
Pre-slew 15.0-350.0 keV image (Event data)
#   RAcent    DECcent   POSerr    Theta     Phi              Peak Cts       SNR   Name
  147.4259    70.5081   0.0030     1.5516   118.8398         4.7144720     63.309 TRIG_00657750

Foreground time interval of the image:
 -4.832  13.381 (delta_t =  18.213 [sec])
Background time interval of the image:
-239.120  -4.832 (delta_t = 234.288 [sec])
Lightcurves
Notes:
- 1) The mask-weighted light curves are using the flight position.
- 2) Multiple plots of different time binning/intervals are shown to cover all scenarios of short/long GRBs, rate/image triggers, and real/false positives.
- 3) For all the mask-weighted lightcurves, the y-axis units are counts/sec/det where a det is 0.4 x 0.4 = 0.16 sq cm.
- 4) The verticle lines correspond to following: green dotted lines are T50 interval, black dotted lines are T90 interval, blue solid line(s) is a spacecraft slew start time, and orange solid line(s) is a spacecraft slew end time.
- 5) Time of each bin is in the middle of the bin.
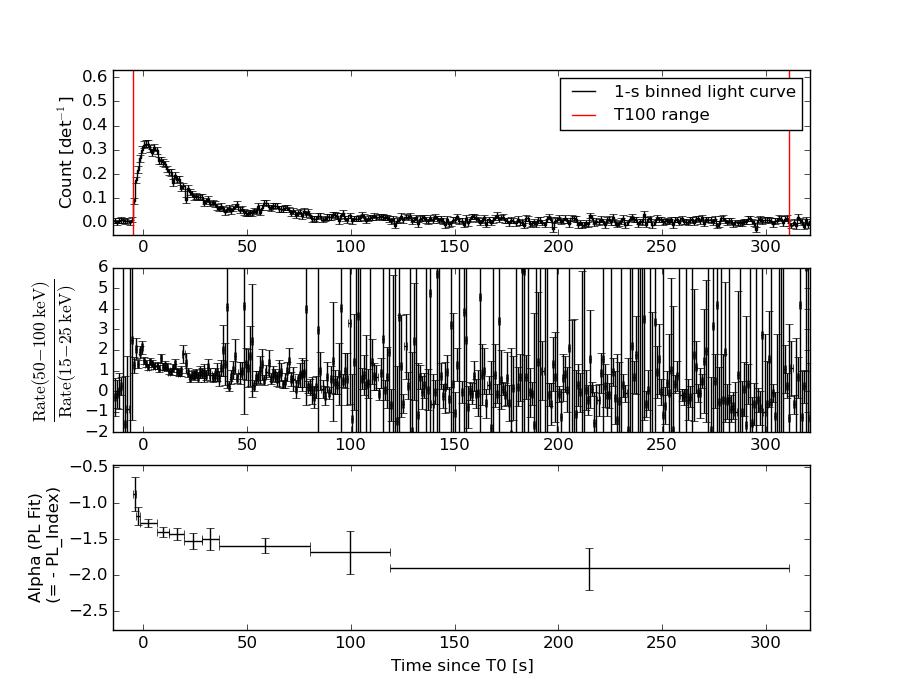
1 s binning
From T0-310 s to T0+310 s

From T100_start - 20 s to T100_end + 30 s

Full time interval
64 ms binning
Full time interval
From T100_start to T100_end

From T0-5 sec to T0+5 sec
16 ms binning
From T100_start-5 s to T100_start+5 s
Blue+Cyan dotted lines: Time interval of the scaled map
From 0.000000 to 1.024000
8 ms binning
From T100_start-3 s to T100_start+3 s

Blue+Cyan dotted lines: Time interval of the scaled map
From 0.000000 to 1.024000
2 ms binning
From T100_start-1 s to T100_start+1 s

Blue+Cyan dotted lines: Time interval of the scaled map
From 0.000000 to 1.024000
SN=5 or 10 sec. binning (whichever binning is satisfied first)

SN=5 or 10 sec. binning (T < 200 sec)
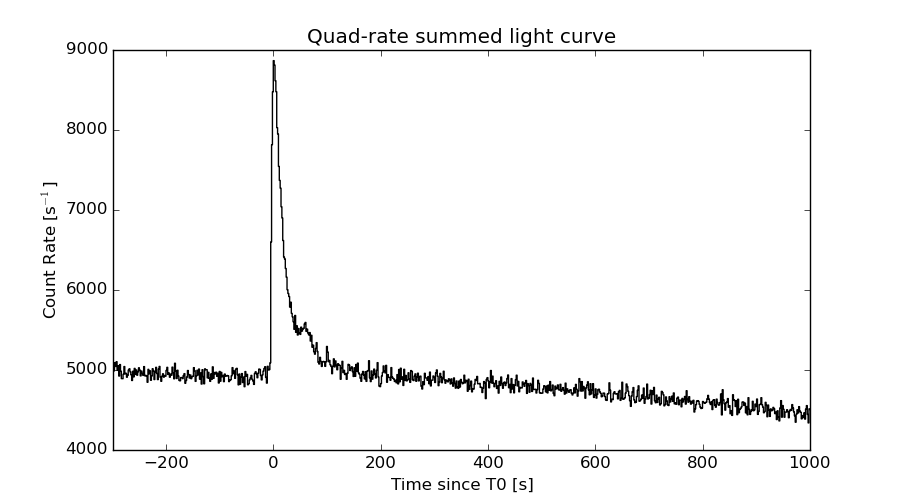
Quad-rate summed light curves (from T0-300s to T0+1000s)
Spectral Evolution
Spectra
Notes:
- 1) The fitting includes the systematic errors.
- 2) When the burst includes telescope slew time periods, the fitting uses an average response file made from multiple 5-s response files through out the slew time plus single time preiod for the non-slew times, and weighted by the total counts in the corresponding time period using addrmf. An average response file is needed becuase a spectral fit using the pre-slew DRM will introduce some errors in both a spectral shape and a normalization if the PHA file contains a lot of the slew/post-slew time interval.
- 3) For fits to more complicated models (e.g. a power-law over a cutoff power-law), the BAT team has decided to require a chi-square improvement of more than 6 for each extra dof.
Time averaged spectrum fit using the average DRM
Power-law model

Time interval is from   -4.832 sec. to  311.296 sec.

Spectral model in power-law:
------------------------------------------------------------
Parameters  : value       lower 90%   higher 90%
Photon index: 1.50078     ( -0.0596992   0.0598692 )
Norm@50keV  : 2.40760E-03    ( -7.33652e-05   7.33105e-05 )
------------------------------------------------------------
#Fit statistic : Chi-Squared =          43.96 using 59 PHA bins.
# Reduced chi-squared =         0.7712 for     57 degrees of freedom
# Null hypothesis probability =   8.971696e-01

Photon flux (15-150 keV)    in 316.1 sec: 0.300626 ( -0.00982275  0.00986294 ) ph/cm2/s
Energy fluence (15-150 keV)             : 7.21868e-06 ( -2.38214e-07  2.3928e-07 ) ergs/cm2
Cutoff power-law model

Time interval is from   -4.832 sec. to  311.296 sec.
Spectral model in the cutoff power-law:
------------------------------------------------------------
Parameters  : value       lower 90%   higher 90%
Photon index: 1.49873     ( -0.0604159   0.0597608 )
Epeak [keV] : 9999.36      ( -9999.36 -9999.36 )
Norm@50keV  : 2.41441E-03    ( -7.3536e-05   0.000642606 )
------------------------------------------------------------
#Fit statistic : Chi-Squared =          43.96 using 59 PHA bins.
# Reduced chi-squared =         0.7850 for     56 degrees of freedom
# Null hypothesis probability =   8.783696e-01

Photon flux (15-150 keV)    in 316.1 sec: 0.300551 ( -0.009488  0.009765 ) ph/cm2/s
Energy fluence (15-150 keV)             : 7.21865e-06 ( -2.5563e-07  2.36601e-07 ) ergs/cm2
Band function

Time interval is from   -4.832 sec. to  311.296 sec.

Spectral model in the Band function:
------------------------------------------------------------
Parameters  : value       lower 90%   higher 90%
alpha       : 4.97837   ( -4.97837   -4.97837 )
beta        : -1.51093    ( -0.0633348   0.0610984 )
Epeak [keV] : 20.3222      ( -20.3222 3.78067 )
Norm@50keV   : 876.438    ( -26.5046   830649 )
------------------------------------------------------------
#Fit statistic : Chi-Squared =          43.31 using 59 PHA bins.
# Reduced chi-squared =         0.7874 for     55 degrees of freedom
# Null hypothesis probability =   8.729855e-01

Photon flux (15-150 keV)    in 316.1 sec:  (    ) ph/cm2/s
Energy fluence (15-150 keV)             : 0 ( 0  0 ) ergs/cm2
Single BB

Spectral model blackbody:
------------------------------------------------------------
Parameters  : value    Lower 90%  Upper 90%
kT [keV]    : 16.1313  (  )
R^2/D10^2   : 2.50888E-02  (   )
(R is the radius in km and D10 is the distance to the source in units of 10 kpc)
------------------------------------------------------------
#Fit statistic : Chi-Squared =         291.23 using 59 PHA bins.
# Reduced chi-squared =         5.1094 for     57 degrees of freedom
# Null hypothesis probability =   3.794475e-33

Energy  Fluence     90% Error
[keV]   [erg/cm2]   [erg/cm2]
15- 25  4.259e-07   2.813e-08
25- 50  1.805e-06   8.171e-08
50-150  3.293e-06   1.906e-07
15-150  5.523e-06   2.055e-07
Thermal bremsstrahlung (OTTB)
Spectral model: thermal bremsstrahlung
------------------------------------------------------------
Parameters  : value         Lower 90%    Upper 90%
kT [keV]    : 200.000       (-12.4566      -200)
Norm        : 1.22537       (-0.0371181     0.0371181)
------------------------------------------------------------
#Fit statistic : Chi-Squared =          53.08 using 59 PHA bins.
# Reduced chi-squared =         0.9312 for     57 degrees of freedom
# Null hypothesis probability =   6.229261e-01

Energy  Fluence     90% Error
[keV]   [erg/cm2]   [erg/cm2]
15- 25  9.647e-07   3.240e-08
25- 50  1.856e-06   6.559e-08
50-150  4.070e-06   1.249e-07
15-150  6.890e-06   2.260e-07
Double BB

Spectral model: bbodyrad<1> + bbodyrad<2>
------------------------------------------------------------
Parameters  : value         Lower 90%    Upper 90%
kT1 [keV]   : 6.84432        (-0.77421      0.878376)
R1^2/D10^2  : 0.333549        (-0.112766      0.184793)
kT2 [keV]   : 27.3548        (-2.86951      3.99518)
R2^2/D10^2  : 3.36936E-03    (-0.00125443   0.0016183)
------------------------------------------------------------
#Fit statistic : Chi-Squared =          53.27 using 59 PHA bins.
# Reduced chi-squared =         0.9685 for     55 degrees of freedom
# Null hypothesis probability =   5.410146e-01

Energy  Fluence     90% Error
[keV]   [erg/cm2]   [erg/cm2]
15- 25  9.064e-07   1.045e-07
25- 50  1.796e-06   1.285e-07
50-150  4.408e-06   3.762e-07
15-150  7.110e-06   4.536e-07
Peak spectrum fit
Power-law model

Time interval is from    1.700 sec. to    2.700 sec.

Spectral model in power-law:
------------------------------------------------------------
Parameters  : value       lower 90%   higher 90%
Photon index: 1.38422     ( -0.115197   0.115982 )
Norm@50keV  : 2.20194E-02    ( -0.00155886   0.00155261 )
------------------------------------------------------------
#Fit statistic : Chi-Squared =          71.66 using 59 PHA bins.
# Reduced chi-squared =          1.257 for     57 degrees of freedom
# Null hypothesis probability =   9.153157e-02

Photon flux (15-150 keV)    in 1 sec: 2.67210 ( -0.183249  0.183287 ) ph/cm2/s
Energy fluence (15-150 keV)             : 2.13464e-07 ( -1.70901e-08  1.7242e-08 ) ergs/cm2
Cutoff power-law model
Time interval is from    1.700 sec. to    2.700 sec.
Spectral model in the cutoff power-law:
------------------------------------------------------------
Parameters  : value       lower 90%   higher 90%
Photon index: 0.827543     ( -0.527116   0.46892 )
Epeak [keV] : 101.766      ( -28.9012 241.646 )
Norm@50keV  : 4.30221E-02    ( -0.0182081   0.0371095 )
------------------------------------------------------------
#Fit statistic : Chi-Squared =          67.47 using 59 PHA bins.
# Reduced chi-squared =          1.205 for     56 degrees of freedom
# Null hypothesis probability =   1.400961e-01

Photon flux (15-150 keV)    in 1 sec: 2.61617 ( -0.18977  0.18934 ) ph/cm2/s
Energy fluence (15-150 keV)             : 2.03087e-07 ( -1.9394e-08  1.9432e-08 ) ergs/cm2
Band function
Time interval is from    1.700 sec. to    2.700 sec.

Spectral model in the Band function:
------------------------------------------------------------
Parameters  : value       lower 90%   higher 90%
alpha       : 1.72574   ( -2.60126   -1.73165 )
beta        : -1.57306    ( -1.7386   0.184325 )
Epeak [keV] : 35.5601      ( -8.2612 96.1956 )
Norm@50keV   : 2.86902    ( -2.98565   367.166 )
------------------------------------------------------------
#Fit statistic : Chi-Squared =          65.12 using 59 PHA bins.
# Reduced chi-squared =          1.184 for     55 degrees of freedom
# Null hypothesis probability =   1.649504e-01

Photon flux (15-150 keV)    in 1 sec:  (    ) ph/cm2/s
Energy fluence (15-150 keV)             : 2.07066e-07 ( -2.07059e-07  -1.8413e-08 ) ergs/cm2
Single BB
Spectral model blackbody:
------------------------------------------------------------
Parameters  : value    Lower 90%  Upper 90%
kT [keV]    : 14.8499  (-1.26353  1.40913)
R^2/D10^2   : 0.323876  (-0.0867697   0.116011)
(R is the radius in km and D10 is the distance to the source in units of 10 kpc)
------------------------------------------------------------
#Fit statistic : Chi-Squared =         102.43 using 59 PHA bins.
# Reduced chi-squared =         1.7971 for     57 degrees of freedom
# Null hypothesis probability =   2.105450e-04

Energy  Fluence     90% Error
[keV]   [erg/cm2]   [erg/cm2]
15- 25  1.498e-08   2.025e-09
25- 50  5.896e-08   5.365e-09
50-150  8.808e-08   1.248e-08
15-150  1.620e-07   1.420e-08
Thermal bremsstrahlung (OTTB)
Spectral model: thermal bremsstrahlung
------------------------------------------------------------
Parameters  : value         Lower 90%    Upper 90%
kT [keV]    : 200.000       (-28.1555      -200)
Norm        : 10.9465       (-0.748116     0.748116)
------------------------------------------------------------
#Fit statistic : Chi-Squared =          73.30 using 59 PHA bins.
# Reduced chi-squared =          1.286 for     57 degrees of freedom
# Null hypothesis probability =   7.175082e-02

Energy  Fluence     90% Error
[keV]   [erg/cm2]   [erg/cm2]
15- 25  2.727e-08   2.170e-09
25- 50  5.246e-08   5.990e-09
50-150  1.151e-07   3.143e-08
15-150  1.948e-07   3.585e-08
Double BB

Spectral model: bbodyrad<1> + bbodyrad<2>
------------------------------------------------------------
Parameters  : value         Lower 90%    Upper 90%
kT1 [keV]   : 7.85818        (-1.76025      2.12758)
R1^2/D10^2  : 1.73196        (-0.835818      1.98028)
kT2 [keV]   : 27.0587        (-6.04001      15.5256)
R2^2/D10^2  : 3.10443E-02    (-0.0241865   0.0485889)
------------------------------------------------------------
#Fit statistic : Chi-Squared =          65.71 using 59 PHA bins.
# Reduced chi-squared =          1.195 for     55 degrees of freedom
# Null hypothesis probability =   1.528542e-01

Energy  Fluence     90% Error
[keV]   [erg/cm2]   [erg/cm2]
15- 25  2.286e-08   6.760e-09
25- 50  5.465e-08   1.579e-08
50-150  1.272e-07   5.910e-08
15-150  2.047e-07   7.241e-08
Pre-slew spectrum (Pre-slew PHA with pre-slew DRM)
Power-law model

Spectral model in power-law:
------------------------------------------------------------
Parameters  : value       lower 90%   higher 90%
Photon index: 1.30966     ( -0.0450069   0.0449334 )
Norm@50keV  : 1.71089E-02    ( -0.000402365   0.000402323 )
------------------------------------------------------------
#Fit statistic : Chi-Squared =          39.93 using 59 PHA bins.
# Reduced chi-squared =         0.7006 for     57 degrees of freedom
# Null hypothesis probability =   9.581227e-01

Photon flux (15-150 keV)    in 18.21 sec: 2.04481 ( -0.0520856  0.0522009 ) ph/cm2/s
Energy fluence (15-150 keV)             : 3.07152e-06 ( -7.74599e-08  7.75839e-08 ) ergs/cm2
Cutoff power-law model
Spectral model in the cutoff power-law:
------------------------------------------------------------
Parameters  : value       lower 90%   higher 90%
Photon index: 1.13546     ( -0.183122   0.089974 )
Epeak [keV] : 279.925      ( -113.991 9521.61 )
Norm@50keV  : 2.04604E-02    ( -0.00286855   0.00410329 )
------------------------------------------------------------
#Fit statistic : Chi-Squared =          37.08 using 59 PHA bins.
# Reduced chi-squared =         0.6622 for     56 degrees of freedom
# Null hypothesis probability =   9.759143e-01

Photon flux (15-150 keV)    in 18.21 sec: 2.01932 ( -0.05753  0.05768 ) ph/cm2/s
Energy fluence (15-150 keV)             : 3.03776e-06 ( -8.56416e-08  8.52956e-08 ) ergs/cm2
Band function
Spectral model in the Band function:
------------------------------------------------------------
Parameters  : value       lower 90%   higher 90%
alpha       : -0.392779   ( -1.60951   -0.322698 )
beta        : -1.35183    ( 1.34571   0.0582672 )
Epeak [keV] : 57.8492      ( -28.5298 224.305 )
Norm@50keV   : 6.46168E-02    ( -0.0391904   596.203 )
------------------------------------------------------------
#Fit statistic : Chi-Squared =          36.32 using 59 PHA bins.
# Reduced chi-squared =         0.6604 for     55 degrees of freedom
# Null hypothesis probability =   9.755562e-01

Photon flux (15-150 keV)    in 18.21 sec:  (    ) ph/cm2/s
Energy fluence (15-150 keV)             : 0 ( 0  0 ) ergs/cm2
S(25-50 keV) vs. S(50-100 keV) plot
S(25-50 keV)  = 1.79e-06
S(50-100 keV) = 2.52e-06
T90 vs. Hardness ratio plot

T90                                   = 211.056000053883 sec.
Hardness ratio (energy fluence ratio) = 1.40782
Color vs. Color plot
Count Ratio  (25-50 keV) / (15-25 keV) = 1.2441
Count Ratio (50-100 keV) / (15-25 keV) = 0.982424
Mask shadow pattern
IMX = -1.306597232928468E-02, IMY = -2.372788338045695E-02
TIME vs. PHA plot around the trigger time
Blue+Cyan dotted lines: Time interval of the scaled map
From 0.000000 to 1.024000
TIME vs. DetID plot around the trigger time
Blue+Cyan dotted lines: Time interval of the scaled map
From 0.000000 to 1.024000
100 us light curve (15-350 keV)

Blue+Cyan dotted lines: Time interval of the scaled map
From 0.000000 to 1.024000
Spacecraft aspect plot

Bright source in the pre-burst/pre-slew/post-slew images
Pre-burst image of 15-350 keV band
Time interval of the image:
-239.120000 -4.832000

# RAcent  DECcent POSerr Theta    Phi  PeakCts   SNR AngSep     Name
#  [deg]    [deg]    ['] [deg]  [deg]                   [']
 65.3966  71.4309    3.0  26.1   94.0   1.2108   3.9 ------	UNKNOWN
264.0344  79.6434    2.6  26.9  161.1   1.0088   4.4 ------	UNKNOWN
260.1167  42.4677    2.7  57.6 -165.4   4.1960   4.2 ------	UNKNOWN
207.4730  38.0683    3.0  43.7 -116.2   3.1771   3.8 ------	UNKNOWN
Pre-slew background subtracted image of 15-350 keV band
Time interval of the image:
-4.832000 13.380610

# RAcent  DECcent POSerr Theta    Phi  PeakCts   SNR AngSep     Name
#  [deg]    [deg]    ['] [deg]  [deg]                   [']
147.4259  70.5081    0.2   1.6  118.8   4.7143  63.3 ------	UNKNOWN
239.2723  73.5369    2.1  26.4  179.5   0.4706   5.6 ------	UNKNOWN
181.4065  32.3858    2.3  41.0  -83.6   1.4586   5.1 ------	UNKNOWN
Post-slew image of 15-350 keV band
Time interval of the image:
34.580600 962.982600

# RAcent  DECcent POSerr Theta    Phi  PeakCts   SNR AngSep     Name
#  [deg]    [deg]    ['] [deg]  [deg]                   [']
 21.1631  64.3488    3.5  40.2  102.2   7.0374   3.3 ------	UNKNOWN
 96.5075  47.6733    3.0  33.0   28.7   3.0482   3.9 ------	UNKNOWN
100.9872  43.9685    2.6  34.9   20.7   3.5081   4.5 ------	UNKNOWN
181.6500  87.7619    3.6  17.7  139.2   1.7587   3.2 ------	UNKNOWN
268.5713  65.1275    3.0  38.5  170.3   3.1434   3.8 ------	UNKNOWN
105.4162  24.9154    3.1  51.5    5.8   5.3676   3.8 ------	UNKNOWN
263.9458  67.4099    2.8  35.6  171.2   2.9484   4.1 ------	UNKNOWN
147.4318  70.4813    0.9   0.0  -43.1   5.8168  13.0 ------	UNKNOWN
241.2119  35.2163    2.0  58.3 -151.6  16.9782   5.9 ------	UNKNOWN
215.5475  37.3260    3.7  47.9 -129.0   6.9672   3.1 ------	UNKNOWN
207.7194  37.3185    3.5  45.3 -121.2   7.0318   3.3 ------	UNKNOWN
Plot creation:
Sun Nov  1 14:28:47 EST 2015