Click here for the BAT GCN circular template
Image
Pre-slew 15.0-350.0 keV image (Event data)
#   RAcent    DECcent   POSerr    Theta     Phi              Peak Cts       SNR   Name
  337.6473   -33.1889   0.0060    43.6488    37.5777        22.7162599     32.579 TRIG_00660671

Foreground time interval of the image:
-21.620  16.829 (delta_t =  38.449 [sec])
Background time interval of the image:
-239.872 -21.620 (delta_t = 218.252 [sec])
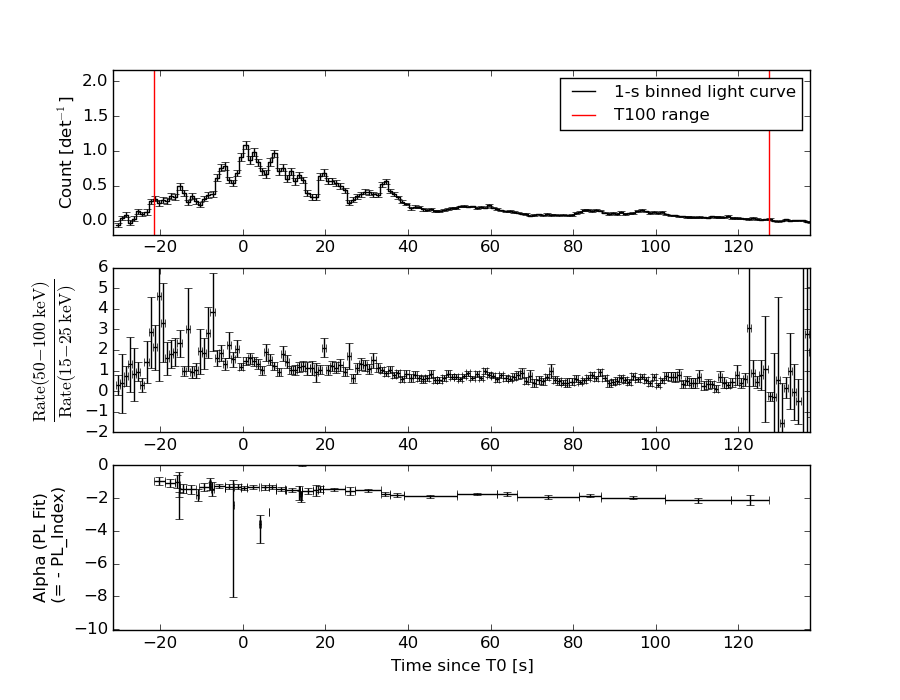
Lightcurves
Notes:
- 1) The mask-weighted light curves are using the flight position.
- 2) Multiple plots of different time binning/intervals are shown to cover all scenarios of short/long GRBs, rate/image triggers, and real/false positives.
- 3) For all the mask-weighted lightcurves, the y-axis units are counts/sec/det where a det is 0.4 x 0.4 = 0.16 sq cm.
- 4) The verticle lines correspond to following: green dotted lines are T50 interval, black dotted lines are T90 interval, blue solid line(s) is a spacecraft slew start time, and orange solid line(s) is a spacecraft slew end time.
- 5) Time of each bin is in the middle of the bin.
1 s binning
From T0-310 s to T0+310 s
From T100_start - 20 s to T100_end + 30 s
Full time interval

64 ms binning
Full time interval

From T100_start to T100_end

From T0-5 sec to T0+5 sec
16 ms binning
From T100_start-5 s to T100_start+5 s
Blue+Cyan dotted lines: Time interval of the scaled map
From 0.000000 to 1.024000
8 ms binning
From T100_start-3 s to T100_start+3 s

Blue+Cyan dotted lines: Time interval of the scaled map
From 0.000000 to 1.024000
2 ms binning
From T100_start-1 s to T100_start+1 s
Blue+Cyan dotted lines: Time interval of the scaled map
From 0.000000 to 1.024000
SN=5 or 10 sec. binning (whichever binning is satisfied first)
SN=5 or 10 sec. binning (T < 200 sec)
Quad-rate summed light curves (from T0-300s to T0+1000s)

Spectral Evolution
Spectra
Notes:
- 1) The fitting includes the systematic errors.
- 2) When the burst includes telescope slew time periods, the fitting uses an average response file made from multiple 5-s response files through out the slew time plus single time preiod for the non-slew times, and weighted by the total counts in the corresponding time period using addrmf. An average response file is needed becuase a spectral fit using the pre-slew DRM will introduce some errors in both a spectral shape and a normalization if the PHA file contains a lot of the slew/post-slew time interval.
- 3) For fits to more complicated models (e.g. a power-law over a cutoff power-law), the BAT team has decided to require a chi-square improvement of more than 6 for each extra dof.
Time averaged spectrum fit using the average DRM
Power-law model

Time interval is from  -21.620 sec. to  127.424 sec.

Spectral model in power-law:
------------------------------------------------------------
Parameters  : value       lower 90%   higher 90%
Photon index: 1.52493     ( -0.0370307   0.0370114 )
Norm@50keV  : 1.94554E-02    ( -0.000368632   0.000368495 )
------------------------------------------------------------
#Fit statistic : Chi-Squared =          37.10 using 59 PHA bins.
# Reduced chi-squared =         0.6509 for     57 degrees of freedom
# Null hypothesis probability =   9.809880e-01

Photon flux (15-150 keV)    in 149 sec: 2.44544 ( -0.0549612  0.0551901 ) ph/cm2/s
Energy fluence (15-150 keV)             : 2.73916e-05 ( -5.25387e-07  5.2563e-07 ) ergs/cm2
Cutoff power-law model
Time interval is from  -21.620 sec. to  127.424 sec.
Spectral model in the cutoff power-law:
------------------------------------------------------------
Parameters  : value       lower 90%   higher 90%
Photon index: 1.52347     ( -0.0384361   0.0362975 )
Epeak [keV] : 9999.36      ( -9999.36 -9999.36 )
Norm@50keV  : 1.94844E-02    ( -0.000367566   0.00173074 )
------------------------------------------------------------
#Fit statistic : Chi-Squared =          37.18 using 59 PHA bins.
# Reduced chi-squared =         0.6639 for     56 degrees of freedom
# Null hypothesis probability =   9.752514e-01

Photon flux (15-150 keV)    in 149 sec: 2.44703 ( -0.05827  0.05229 ) ph/cm2/s
Energy fluence (15-150 keV)             : 2.73938e-05 ( -5.23735e-07  5.16285e-07 ) ergs/cm2
Band function
Time interval is from  -21.620 sec. to  127.424 sec.

Spectral model in the Band function:
------------------------------------------------------------
Parameters  : value       lower 90%   higher 90%
alpha       : -0.712455   ( 0.996294   5.87017 )
beta        : -1.53556    ( -0.0483707   0.0403238 )
Epeak [keV] : 43.9723      ( -43.9903 107.734 )
Norm@50keV   : 7.14302E-02    ( -0.072059   1.88467e+06 )
------------------------------------------------------------
#Fit statistic : Chi-Squared =          36.12 using 59 PHA bins.
# Reduced chi-squared =         0.6567 for     55 degrees of freedom
# Null hypothesis probability =   9.769764e-01

Photon flux (15-150 keV)    in 149 sec:  (    ) ph/cm2/s
Energy fluence (15-150 keV)             : 0 ( 0  0 ) ergs/cm2
Single BB
Spectral model blackbody:
------------------------------------------------------------
Parameters  : value    Lower 90%  Upper 90%
kT [keV]    : 17.8689  (  )
R^2/D10^2   : 0.141446  (   )
(R is the radius in km and D10 is the distance to the source in units of 10 kpc)
------------------------------------------------------------
#Fit statistic : Chi-Squared =         734.59 using 59 PHA bins.
# Reduced chi-squared =         12.888 for     57 degrees of freedom
# Null hypothesis probability =  1.986586e-118

Energy  Fluence     90% Error
[keV]   [erg/cm2]   [erg/cm2]
15- 25  1.350e-06   5.647e-08
25- 50  6.211e-06   1.810e-07
50-150  1.437e-05   4.217e-07
15-150  2.193e-05   4.321e-07
Thermal bremsstrahlung (OTTB)

Spectral model: thermal bremsstrahlung
------------------------------------------------------------
Parameters  : value         Lower 90%    Upper 90%
kT [keV]    : 200.000       (-4.69772      -200)
Norm        : 9.99879       (-0.188741     0.188741)
------------------------------------------------------------
#Fit statistic : Chi-Squared =          71.00 using 59 PHA bins.
# Reduced chi-squared =          1.246 for     57 degrees of freedom
# Null hypothesis probability =   1.005719e-01

Energy  Fluence     90% Error
[keV]   [erg/cm2]   [erg/cm2]
15- 25  3.711e-06   7.971e-08
25- 50  7.139e-06   1.475e-07
50-150  1.566e-05   3.427e-07
15-150  2.651e-05   5.885e-07
Double BB
Spectral model: bbodyrad<1> + bbodyrad<2>
------------------------------------------------------------
Parameters  : value         Lower 90%    Upper 90%
kT1 [keV]   : 7.95155        (-0.517184      0.541468)
R1^2/D10^2  : 1.67924        (-0.344595      0.457805)
kT2 [keV]   : 32.4431        (-2.3466      2.8818)
R2^2/D10^2  : 1.46831E-02    (-0.00366099   0.00437095)
------------------------------------------------------------
#Fit statistic : Chi-Squared =          47.41 using 59 PHA bins.
# Reduced chi-squared =         0.8621 for     55 degrees of freedom
# Null hypothesis probability =   7.565444e-01

Energy  Fluence     90% Error
[keV]   [erg/cm2]   [erg/cm2]
15- 25  3.191e-06   1.862e-07
25- 50  7.113e-06   2.742e-07
50-150  1.693e-05   6.854e-07
15-150  2.724e-05   8.717e-07
Peak spectrum fit
Power-law model

Time interval is from   -0.132 sec. to    0.868 sec.

Spectral model in power-law:
------------------------------------------------------------
Parameters  : value       lower 90%   higher 90%
Photon index: 1.42029     ( -0.154429   0.15749 )
Norm@50keV  : 7.96116E-02    ( -0.00698165   0.00693836 )
------------------------------------------------------------
#Fit statistic : Chi-Squared =          47.83 using 59 PHA bins.
# Reduced chi-squared =         0.8391 for     57 degrees of freedom
# Null hypothesis probability =   8.013330e-01

Photon flux (15-150 keV)    in 1 sec: 9.74078 ( -0.838999  0.840017 ) ph/cm2/s
Energy fluence (15-150 keV)             : 7.6614e-07 ( -7.57774e-08  7.62499e-08 ) ergs/cm2
Cutoff power-law model
Time interval is from   -0.132 sec. to    0.868 sec.
Spectral model in the cutoff power-law:
------------------------------------------------------------
Parameters  : value       lower 90%   higher 90%
Photon index: 1.41847     ( -0.26532   0.157481 )
Epeak [keV] : 9999.36      ( -9999.36 -9999.36 )
Norm@50keV  : 7.98705E-02    ( -0.0798722   0.0284313 )
------------------------------------------------------------
#Fit statistic : Chi-Squared =          47.85 using 59 PHA bins.
# Reduced chi-squared =         0.8545 for     56 degrees of freedom
# Null hypothesis probability =   7.723984e-01

Photon flux (15-150 keV)    in 1 sec: 9.75232 ( -0.84706  0.82858 ) ph/cm2/s
Energy fluence (15-150 keV)             : 7.60553e-07 ( -7.0418e-08  8.1084e-08 ) ergs/cm2
Band function

Time interval is from   -0.132 sec. to    0.868 sec.

Spectral model in the Band function:
------------------------------------------------------------
Parameters  : value       lower 90%   higher 90%
alpha       : -1.21717   ( 1.21719   1.21719 )
beta        : -1.42024    ( -0.157493   0.154445 )
Epeak [keV] : 15.7066      ( -15.7072 -15.7072 )
Norm@50keV   : 0.162290    ( -0.0895955   1.88524 )
------------------------------------------------------------
#Fit statistic : Chi-Squared =          47.83 using 59 PHA bins.
# Reduced chi-squared =         0.8696 for     55 degrees of freedom
# Null hypothesis probability =   7.426294e-01

Photon flux (15-150 keV)    in 1 sec:  (    ) ph/cm2/s
Energy fluence (15-150 keV)             : 0 ( 0  0 ) ergs/cm2
Single BB

Spectral model blackbody:
------------------------------------------------------------
Parameters  : value    Lower 90%  Upper 90%
kT [keV]    : 17.2775  (-2.38562  2.70271)
R^2/D10^2   : 0.675406  (-0.254907   0.430409)
(R is the radius in km and D10 is the distance to the source in units of 10 kpc)
------------------------------------------------------------
#Fit statistic : Chi-Squared =         104.96 using 59 PHA bins.
# Reduced chi-squared =         1.8414 for     57 degrees of freedom
# Null hypothesis probability =   1.136358e-04

Energy  Fluence     90% Error
[keV]   [erg/cm2]   [erg/cm2]
15- 25  4.087e-08   6.985e-09
25- 50  1.832e-07   2.315e-08
50-150  3.924e-07   6.955e-08
15-150  6.165e-07   7.655e-08
Thermal bremsstrahlung (OTTB)
Spectral model: thermal bremsstrahlung
------------------------------------------------------------
Parameters  : value         Lower 90%    Upper 90%
kT [keV]    : 200.000       (-35.7      -200)
Norm        : 39.8306       (-3.40175     3.40175)
------------------------------------------------------------
#Fit statistic : Chi-Squared =          53.24 using 59 PHA bins.
# Reduced chi-squared =         0.9340 for     57 degrees of freedom
# Null hypothesis probability =   6.170869e-01

Energy  Fluence     90% Error
[keV]   [erg/cm2]   [erg/cm2]
15- 25  9.917e-08   1.231e-08
25- 50  1.908e-07   4.340e-08
50-150  4.184e-07   1.905e-07
15-150  7.083e-07   1.828e-07
Double BB
Spectral model: bbodyrad<1> + bbodyrad<2>
------------------------------------------------------------
Parameters  : value         Lower 90%    Upper 90%
kT1 [keV]   : 5.99641        (-1.11392      1.35273)
R1^2/D10^2  : 19.1559        (-10.2411      24.5673)
kT2 [keV]   : 31.3129        (-5.88933      9.71426)
R2^2/D10^2  : 8.12564E-02    (-0.0457479   0.0790745)
------------------------------------------------------------
#Fit statistic : Chi-Squared =          43.49 using 59 PHA bins.
# Reduced chi-squared =         0.7908 for     55 degrees of freedom
# Null hypothesis probability =   8.685898e-01

Energy  Fluence     90% Error
[keV]   [erg/cm2]   [erg/cm2]
15- 25  1.036e-07   4.511e-08
25- 50  1.672e-07   4.497e-08
50-150  5.264e-07   1.549e-07
15-150  7.972e-07   2.418e-07
Pre-slew spectrum (Pre-slew PHA with pre-slew DRM)
Power-law model
Spectral model in power-law:
------------------------------------------------------------
Parameters  : value       lower 90%   higher 90%
Photon index: 1.33406     ( -0.0468071   0.0467011 )
Norm@50keV  : 4.12866E-02    ( -0.0010457   0.00104485 )
------------------------------------------------------------
#Fit statistic : Chi-Squared =          38.03 using 59 PHA bins.
# Reduced chi-squared =         0.6671 for     57 degrees of freedom
# Null hypothesis probability =   9.749960e-01

Photon flux (15-150 keV)    in 38.45 sec: 4.95784 ( -0.139264  0.139833 ) ph/cm2/s
Energy fluence (15-150 keV)             : 1.55608e-05 ( -4.06386e-07  4.06793e-07 ) ergs/cm2
Cutoff power-law model
Spectral model in the cutoff power-law:
------------------------------------------------------------
Parameters  : value       lower 90%   higher 90%
Photon index: 1.33014     ( -0.179727   0.0466121 )
Epeak [keV] : 9998.94      ( -9998.96 -9998.96 )
Norm@50keV  : 4.14513E-02    ( -0.00104025   0.00751761 )
------------------------------------------------------------
#Fit statistic : Chi-Squared =          38.03 using 59 PHA bins.
# Reduced chi-squared =         0.6792 for     56 degrees of freedom
# Null hypothesis probability =   9.684405e-01

Photon flux (15-150 keV)    in 38.45 sec: 4.95639 ( -0.13514  0.13699 ) ph/cm2/s
Energy fluence (15-150 keV)             : 1.55632e-05 ( -4.03994e-07  4.05917e-07 ) ergs/cm2
Band function
Spectral model in the Band function:
------------------------------------------------------------
Parameters  : value       lower 90%   higher 90%
alpha       : -0.511340   ( 0.829145   0.829145 )
beta        : -1.35918    ( 1.36643   0.0660207 )
Epeak [keV] : 56.2784      ( -56.1698 181.318 )
Norm@50keV   : 0.141899    ( -0.142988   2561.37 )
------------------------------------------------------------
#Fit statistic : Chi-Squared =          36.52 using 59 PHA bins.
# Reduced chi-squared =         0.6640 for     55 degrees of freedom
# Null hypothesis probability =   9.740920e-01

Photon flux (15-150 keV)    in 38.45 sec:  (    ) ph/cm2/s
Energy fluence (15-150 keV)             : 0 ( 0  0 ) ergs/cm2
S(25-50 keV) vs. S(50-100 keV) plot

S(25-50 keV)  = 6.86e-06
S(50-100 keV) = 9.53e-06
T90 vs. Hardness ratio plot
T90                                   = 110.055999994278 sec.
Hardness ratio (energy fluence ratio) = 1.38921
Color vs. Color plot
Count Ratio  (25-50 keV) / (15-25 keV) = 1.40848
Count Ratio (50-100 keV) / (15-25 keV) = 1.11388
Mask shadow pattern

IMX = 7.560019176857721E-01, IMY = -5.817320087857388E-01
TIME vs. PHA plot around the trigger time

Blue+Cyan dotted lines: Time interval of the scaled map
From 0.000000 to 1.024000
TIME vs. DetID plot around the trigger time

Blue+Cyan dotted lines: Time interval of the scaled map
From 0.000000 to 1.024000
100 us light curve (15-350 keV)
Blue+Cyan dotted lines: Time interval of the scaled map
From 0.000000 to 1.024000
Spacecraft aspect plot
Bright source in the pre-burst/pre-slew/post-slew images
Pre-burst image of 15-350 keV band
Time interval of the image:
-239.872000 -21.620000

# RAcent  DECcent POSerr Theta    Phi  PeakCts   SNR AngSep     Name
#  [deg]    [deg]    ['] [deg]  [deg]                   [']
264.9099 -44.4855    5.5  52.5  -39.8  -1.9910  -2.1    7.5	4U 1735-44
  1.7972 -39.1271    2.6  34.4   66.7   1.8133   4.5 ------	UNKNOWN
343.8240 -35.6354    2.9  40.1   44.2   1.9290   4.1 ------	UNKNOWN
 94.0575 -32.3076    2.5  56.9  173.8   5.6401   4.7 ------	UNKNOWN
105.9736 -35.5910    3.3  57.2 -173.8   2.9952   3.5 ------	UNKNOWN
Pre-slew background subtracted image of 15-350 keV band
Time interval of the image:
-21.620000 16.828600

# RAcent  DECcent POSerr Theta    Phi  PeakCts   SNR AngSep     Name
#  [deg]    [deg]    ['] [deg]  [deg]                   [']
264.6746 -44.4019    4.8  52.6  -39.9   1.0241   2.4    4.1	4U 1735-44
337.6473 -33.1889    0.4  43.6   37.6  22.7168  32.6 ------	UNKNOWN
322.5658 -28.8344    3.1  51.3   22.2   4.3124   3.7 ------	UNKNOWN
270.5725 -44.3638    3.2  51.2  -34.9   0.9884   3.7 ------	UNKNOWN
146.6341 -53.2562    2.3  49.8 -133.0   2.0714   4.9 ------	UNKNOWN
Post-slew image of 15-350 keV band
Time interval of the image:
79.828600 362.388000

# RAcent  DECcent POSerr Theta    Phi  PeakCts   SNR AngSep     Name
#  [deg]    [deg]    ['] [deg]  [deg]                   [']
335.2506  15.2399    3.2  48.5   32.4  25.4987   3.6 ------	UNKNOWN
 36.3615 -50.5473    3.0  45.7  166.1  14.0846   3.9 ------	UNKNOWN
 55.8931 -55.3067    2.2  56.8  173.7  60.4724   5.3 ------	UNKNOWN
326.0215 -12.1229    3.8  23.6    6.1   5.4314   3.0 ------	UNKNOWN
 72.7684 -75.3051    2.9  59.3 -161.6  43.8263   4.0 ------	UNKNOWN
287.7540 -74.9248    2.4  48.0 -129.0  33.0735   4.7 ------	UNKNOWN
286.0252 -52.6279    3.6  41.3  -98.5  20.1053   3.2 ------	UNKNOWN
Plot creation:
Mon Nov 16 15:50:33 EST 2015