Special notes of this burst
Image
Pre-slew 15.0-350.0 keV image (Event data)

#   RAcent    DECcent   POSerr    Theta     Phi              Peak Cts       SNR   Name
  271.0125    -8.2931   0.0139    18.0224   133.0387         0.5888895     13.788 TRIG_00661253

Foreground time interval of the image:
 -0.984  12.164 (delta_t =  13.148 [sec])
Background time interval of the image:
-250.227  -0.984 (delta_t = 249.243 [sec])
Lightcurves
Notes:
- 1) The mask-weighted light curves are using the flight position.
- 2) Multiple plots of different time binning/intervals are shown to cover all scenarios of short/long GRBs, rate/image triggers, and real/false positives.
- 3) For all the mask-weighted lightcurves, the y-axis units are counts/sec/det where a det is 0.4 x 0.4 = 0.16 sq cm.
- 4) The verticle lines correspond to following: green dotted lines are T50 interval, black dotted lines are T90 interval, blue solid line(s) is a spacecraft slew start time, and orange solid line(s) is a spacecraft slew end time.
- 5) Time of each bin is in the middle of the bin.
1 s binning
From T0-310 s to T0+310 s
From T100_start - 20 s to T100_end + 30 s

Full time interval
64 ms binning
Full time interval
From T100_start to T100_end
From T0-5 sec to T0+5 sec

16 ms binning
From T100_start-5 s to T100_start+5 s

Blue+Cyan dotted lines: Time interval of the scaled map
From 0.000000 to 1.024000
8 ms binning
From T100_start-3 s to T100_start+3 s
Blue+Cyan dotted lines: Time interval of the scaled map
From 0.000000 to 1.024000
2 ms binning
From T100_start-1 s to T100_start+1 s

Blue+Cyan dotted lines: Time interval of the scaled map
From 0.000000 to 1.024000
SN=5 or 10 sec. binning (whichever binning is satisfied first)

SN=5 or 10 sec. binning (T < 200 sec)

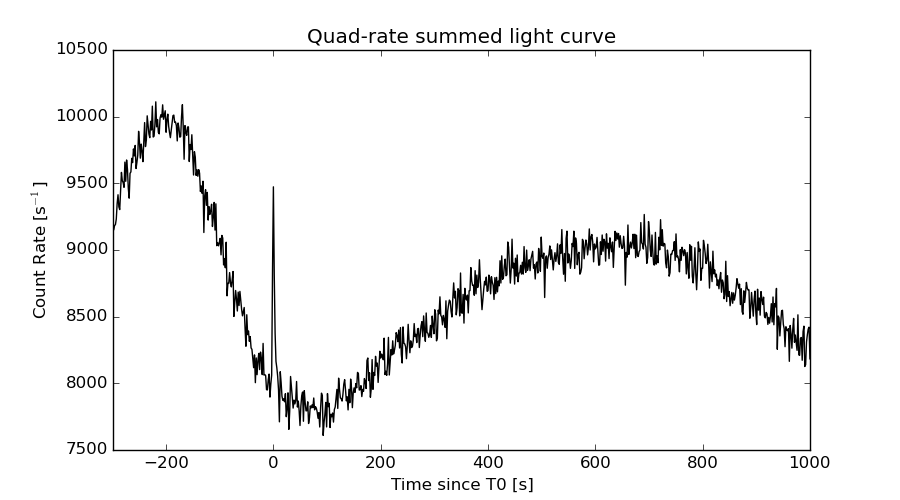
Quad-rate summed light curves (from T0-300s to T0+1000s)
Spectral Evolution

Spectra
Notes:
- 1) The fitting includes the systematic errors.
- 2) When the burst includes telescope slew time periods, the fitting uses an average response file made from multiple 5-s response files through out the slew time plus single time preiod for the non-slew times, and weighted by the total counts in the corresponding time period using addrmf. An average response file is needed becuase a spectral fit using the pre-slew DRM will introduce some errors in both a spectral shape and a normalization if the PHA file contains a lot of the slew/post-slew time interval.
- 3) For fits to more complicated models (e.g. a power-law over a cutoff power-law), the BAT team has decided to require a chi-square improvement of more than 6 for each extra dof.
Time averaged spectrum fit using the average DRM
Power-law model
Time interval is from   -0.984 sec. to   12.164 sec.

Spectral model in power-law:
------------------------------------------------------------
Parameters  : value       lower 90%   higher 90%
Photon index: 2.25372     ( -0.222453   0.238941 )
Norm@50keV  : 2.13222E-03    ( -0.000346467   0.000339462 )
------------------------------------------------------------
#Fit statistic : Chi-Squared =          56.25 using 59 PHA bins.
# Reduced chi-squared =         0.9869 for     57 degrees of freedom
# Null hypothesis probability =   5.030606e-01

Photon flux (15-150 keV)    in 13.15 sec: 0.363269 ( -0.0409836  0.0409962 ) ph/cm2/s
Energy fluence (15-150 keV)             : 2.65788e-07 ( -3.57522e-08  3.6788e-08 ) ergs/cm2
Cutoff power-law model

Time interval is from   -0.984 sec. to   12.164 sec.
Spectral model in the cutoff power-law:
------------------------------------------------------------
Parameters  : value       lower 90%   higher 90%
Photon index: 1.36334     ( -1.28187   0.723564 )
Epeak [keV] : 27.3063      (   )
Norm@50keV  : 7.39775E-03    (     )
------------------------------------------------------------
#Fit statistic : Chi-Squared =          53.99 using 59 PHA bins.
# Reduced chi-squared =         0.9641 for     56 degrees of freedom
# Null hypothesis probability =   5.513589e-01

Photon flux (15-150 keV)    in 13.15 sec: 0.351205 ( -0.042695  0.042999 ) ph/cm2/s
Energy fluence (15-150 keV)             : 2.42798e-07 ( -3.83191e-08  4.37132e-08 ) ergs/cm2
Band function
Time interval is from   -0.984 sec. to   12.164 sec.

Spectral model in the Band function:
------------------------------------------------------------
Parameters  : value       lower 90%   higher 90%
alpha       : -1.34301   ( 0.548511   5.32368 )
beta        : -3.59408    ( 3.64474   1.48212 )
Epeak [keV] : 27.8072      ( -27.7985 10.7584 )
Norm@50keV   : 7.54673E-03    ( -0.00219096   0 )
------------------------------------------------------------
#Fit statistic : Chi-Squared =          53.94 using 59 PHA bins.
# Reduced chi-squared =         0.9807 for     55 degrees of freedom
# Null hypothesis probability =   5.152343e-01

Photon flux (15-150 keV)    in 13.15 sec:  (    ) ph/cm2/s
Energy fluence (15-150 keV)             : 0 ( 0  0 ) ergs/cm2
Single BB
Spectral model blackbody:
------------------------------------------------------------
Parameters  : value    Lower 90%  Upper 90%
kT [keV]    : 8.44233  (-1.02892  1.18624)
R^2/D10^2   : 0.317724  (-0.130903   0.220577)
(R is the radius in km and D10 is the distance to the source in units of 10 kpc)
------------------------------------------------------------
#Fit statistic : Chi-Squared =          64.41 using 59 PHA bins.
# Reduced chi-squared =          1.130 for     57 degrees of freedom
# Null hypothesis probability =   2.333304e-01

Energy  Fluence     90% Error
[keV]   [erg/cm2]   [erg/cm2]
15- 25  5.588e-08   9.915e-09
25- 50  1.072e-07   1.738e-08
50-150  3.348e-08   1.229e-08
15-150  1.965e-07   2.985e-08
Thermal bremsstrahlung (OTTB)

Spectral model: thermal bremsstrahlung
------------------------------------------------------------
Parameters  : value         Lower 90%    Upper 90%
kT [keV]    : 43.6680       (-11.1409      17.4538)
Norm        : 2.21472       (-0.429091     0.575666)
------------------------------------------------------------
#Fit statistic : Chi-Squared =          53.99 using 59 PHA bins.
# Reduced chi-squared =         0.9472 for     57 degrees of freedom
# Null hypothesis probability =   5.886037e-01

Energy  Fluence     90% Error
[keV]   [erg/cm2]   [erg/cm2]
15- 25  6.875e-08   9.869e-09
25- 50  9.381e-08   1.282e-08
50-150  7.967e-08   2.594e-08
15-150  2.422e-07   3.912e-08
Double BB

Spectral model: bbodyrad<1> + bbodyrad<2>
------------------------------------------------------------
Parameters  : value         Lower 90%    Upper 90%
kT1 [keV]   : 5.33825        (-2.71565      1.98973)
R1^2/D10^2  : 1.34906        (-0.877141      27.8265)
kT2 [keV]   : 14.9885        (-5.16553      13.4986)
R2^2/D10^2  : 2.03637E-02    (-0.0189897   0.0468471)
------------------------------------------------------------
#Fit statistic : Chi-Squared =          54.32 using 59 PHA bins.
# Reduced chi-squared =         0.9876 for     55 degrees of freedom
# Null hypothesis probability =   5.006724e-01

Energy  Fluence     90% Error
[keV]   [erg/cm2]   [erg/cm2]
15- 25  6.826e-08   3.690e-08
25- 50  9.259e-08   4.707e-08
50-150  7.880e-08   4.559e-08
15-150  2.397e-07   1.228e-07
Peak spectrum fit
Power-law model
Time interval is from    0.236 sec. to    1.236 sec.

Spectral model in power-law:
------------------------------------------------------------
Parameters  : value       lower 90%   higher 90%
Photon index: 2.04033     ( -0.317234   0.346018 )
Norm@50keV  : 6.81711E-03    ( -0.00141991   0.00133567 )
------------------------------------------------------------
#Fit statistic : Chi-Squared =          58.48 using 59 PHA bins.
# Reduced chi-squared =          1.026 for     57 degrees of freedom
# Null hypothesis probability =   4.207775e-01

Photon flux (15-150 keV)    in 1 sec: 1.04200 ( -0.15618  0.156319 ) ph/cm2/s
Energy fluence (15-150 keV)             : 6.30225e-08 ( -1.15675e-08  1.19412e-08 ) ergs/cm2
Cutoff power-law model

Time interval is from    0.236 sec. to    1.236 sec.
Spectral model in the cutoff power-law:
------------------------------------------------------------
Parameters  : value       lower 90%   higher 90%
Photon index: 2.36264     ( -0.723384   0 )
Epeak [keV] : 136.362      (   )
Norm@50keV  : 4.52716E-03    (     )
------------------------------------------------------------
#Fit statistic : Chi-Squared =          55.89 using 59 PHA bins.
# Reduced chi-squared =         0.9979 for     56 degrees of freedom
# Null hypothesis probability =   4.791910e-01

Photon flux (15-150 keV)    in 1 sec: 1.04212 ( -0.155292  0.15565 ) ph/cm2/s
Energy fluence (15-150 keV)             : 6.25954e-08 ( -1.11239e-08  1.23784e-08 ) ergs/cm2
Band function

Time interval is from    0.236 sec. to    1.236 sec.

Spectral model in the Band function:
------------------------------------------------------------
Parameters  : value       lower 90%   higher 90%
alpha       : -1.55965   ( 1.56356   1.56356 )
beta        : -2.03718    ( 2.0401   0.31659 )
Epeak [keV] : 12.3886      ( -11.5993 -11.5993 )
Norm@50keV   : 2.05865E-02    ( -0.0210251   0.129578 )
------------------------------------------------------------
#Fit statistic : Chi-Squared =          58.48 using 59 PHA bins.
# Reduced chi-squared =          1.063 for     55 degrees of freedom
# Null hypothesis probability =   3.488189e-01

Photon flux (15-150 keV)    in 1 sec:  (    ) ph/cm2/s
Energy fluence (15-150 keV)             : 0 ( 0  0 ) ergs/cm2
Single BB
Spectral model blackbody:
------------------------------------------------------------
Parameters  : value    Lower 90%  Upper 90%
kT [keV]    : 8.25901  (-1.74249  2.3403)
R^2/D10^2   : 0.935843  (-0.579865   1.50473)
(R is the radius in km and D10 is the distance to the source in units of 10 kpc)
------------------------------------------------------------
#Fit statistic : Chi-Squared =          79.45 using 59 PHA bins.
# Reduced chi-squared =          1.394 for     57 degrees of freedom
# Null hypothesis probability =   2.634382e-02

Energy  Fluence     90% Error
[keV]   [erg/cm2]   [erg/cm2]
15- 25  1.181e-08   3.579e-09
25- 50  2.182e-08   5.935e-09
50-150  6.357e-09   3.180e-09
15-150  3.999e-08   1.073e-08
Thermal bremsstrahlung (OTTB)
Spectral model: thermal bremsstrahlung
------------------------------------------------------------
Parameters  : value         Lower 90%    Upper 90%
kT [keV]    : 70.1931       (-31.3134      86.1647)
Norm        : 4.96933       (-1.22076     1.92008)
------------------------------------------------------------
#Fit statistic : Chi-Squared =          63.02 using 59 PHA bins.
# Reduced chi-squared =          1.106 for     57 degrees of freedom
# Null hypothesis probability =   2.718200e-01

Energy  Fluence     90% Error
[keV]   [erg/cm2]   [erg/cm2]
15- 25  1.275e-08   2.732e-09
25- 50  2.030e-08   3.820e-09
50-150  2.613e-08   1.461e-08
15-150  5.919e-08   1.585e-08
Double BB
Spectral model: bbodyrad<1> + bbodyrad<2>
------------------------------------------------------------
Parameters  : value         Lower 90%    Upper 90%
kT1 [keV]   : 5.35950        (-1.41987      1.78903)
R1^2/D10^2  : 4.70723        (-3.21106      13.5244)
kT2 [keV]   : 34.8319        (-15.3812      123.204)
R2^2/D10^2  : 4.27888E-03    (-0.00379959   0.0153223)
------------------------------------------------------------
#Fit statistic : Chi-Squared =          56.68 using 59 PHA bins.
# Reduced chi-squared =          1.030 for     55 degrees of freedom
# Null hypothesis probability =   4.123000e-01

Energy  Fluence     90% Error
[keV]   [erg/cm2]   [erg/cm2]
15- 25  1.573e-08   8.241e-09
25- 50  1.639e-08   7.346e-09
50-150  3.899e-08   2.301e-08
15-150  7.111e-08   3.184e-08
Pre-slew spectrum (Pre-slew PHA with pre-slew DRM)
Power-law model

Spectral model in power-law:
------------------------------------------------------------
Parameters  : value       lower 90%   higher 90%
Photon index: 2.25372     ( -0.222453   0.238941 )
Norm@50keV  : 2.13222E-03    ( -0.000346467   0.000339462 )
------------------------------------------------------------
#Fit statistic : Chi-Squared =          56.25 using 59 PHA bins.
# Reduced chi-squared =         0.9869 for     57 degrees of freedom
# Null hypothesis probability =   5.030606e-01

Photon flux (15-150 keV)    in 13.15 sec: 0.363269 ( -0.0409836  0.0409962 ) ph/cm2/s
Energy fluence (15-150 keV)             : 2.65788e-07 ( -3.57522e-08  3.6788e-08 ) ergs/cm2
Cutoff power-law model
Spectral model in the cutoff power-law:
------------------------------------------------------------
Parameters  : value       lower 90%   higher 90%
Photon index: 1.36334     ( -1.28187   0.723564 )
Epeak [keV] : 27.3063      (   )
Norm@50keV  : 7.39775E-03    (     )
------------------------------------------------------------
#Fit statistic : Chi-Squared =          53.99 using 59 PHA bins.
# Reduced chi-squared =         0.9641 for     56 degrees of freedom
# Null hypothesis probability =   5.513589e-01

Photon flux (15-150 keV)    in 13.15 sec: 0.351205 ( -0.042695  0.042999 ) ph/cm2/s
Energy fluence (15-150 keV)             : 2.42798e-07 ( -3.83191e-08  4.37132e-08 ) ergs/cm2
Band function

Spectral model in the Band function:
------------------------------------------------------------
Parameters  : value       lower 90%   higher 90%
alpha       : -1.34301   ( 0.548511   5.32364 )
beta        : -3.59408    ( 3.64474   1.48212 )
Epeak [keV] : 27.8072      ( -27.7985 10.7584 )
Norm@50keV   : 7.54673E-03    ( -0.00219096   0 )
------------------------------------------------------------
#Fit statistic : Chi-Squared =          53.94 using 59 PHA bins.
# Reduced chi-squared =         0.9807 for     55 degrees of freedom
# Null hypothesis probability =   5.152343e-01

Photon flux (15-150 keV)    in 13.15 sec:  (    ) ph/cm2/s
Energy fluence (15-150 keV)             : 0 ( 0  0 ) ergs/cm2
S(25-50 keV) vs. S(50-100 keV) plot

S(25-50 keV)  = 8.51e-08
S(50-100 keV) = 7.14e-08
T90 vs. Hardness ratio plot
T90                                   = 10.7599999308586 sec.
Hardness ratio (energy fluence ratio) = 0.839013
Color vs. Color plot

Count Ratio  (25-50 keV) / (15-25 keV) = 1.03605
Count Ratio (50-100 keV) / (15-25 keV) = 0.384509
Mask shadow pattern

IMX = -2.220497500751255E-01, IMY = -2.377966004227701E-01
TIME vs. PHA plot around the trigger time

Blue+Cyan dotted lines: Time interval of the scaled map
From 0.000000 to 1.024000
TIME vs. DetID plot around the trigger time
Blue+Cyan dotted lines: Time interval of the scaled map
From 0.000000 to 1.024000
100 us light curve (15-350 keV)
Blue+Cyan dotted lines: Time interval of the scaled map
From 0.000000 to 1.024000
Spacecraft aspect plot
Bright source in the pre-burst/pre-slew/post-slew images
Pre-burst image of 15-350 keV band
Time interval of the image:
-250.227400 -0.984000

# RAcent  DECcent POSerr Theta    Phi  PeakCts   SNR AngSep     Name
#  [deg]    [deg]    ['] [deg]  [deg]                   [']
244.9836 -15.6358    0.4  18.5 -133.1  11.0989  31.5    0.4	Sco X-1
254.3811  35.3450   18.1  35.3   14.3   0.2845   0.6    3.7	Her X-1
255.9868 -37.8209    1.6  37.9 -166.2   2.8908   7.4    1.4	4U 1700-377
256.5457 -36.4317    2.4  36.5 -167.0   1.7747   4.8    5.4	GX 349+2
263.1716 -24.8571    7.7  26.1  178.0   0.5462   1.5   11.1	GX 1+4
264.6408 -44.5545   29.8  45.4 -174.5  -0.2530  -0.4    7.6	4U 1735-44
268.3521  -1.4794    7.9  13.5  111.6   0.4829   1.5    1.9	SW J1753.5-0127
270.3206 -25.0495    2.8  29.1  165.6   1.5532   4.1    2.7	GX 5-1
270.2116 -25.8267    6.8  29.7  166.7   0.6407   1.7    7.0	GRS 1758-258
274.1051 -13.8469    0.0  23.5  142.1   1.2588   3.4   12.8	GX 17+2
275.8865 -30.5437    6.2  36.5  164.0   0.9773   1.9   10.8	H1820-303
285.1305 -24.7506    8.6  38.3  147.7  -0.8509  -1.3   11.4	HT1900.1-2455
288.8002  10.9400  750.8  35.3   86.0   0.0121   0.0    0.3	GRS 1915+105
263.0964 -33.7618    5.9  34.6 -176.8   0.7639   2.0    6.9	GX 354-0
281.4067 -38.5847    2.6  45.6  166.0   3.4907   4.4 ------	UNKNOWN
264.5482  -9.1463    2.7  13.2  149.3   1.2805   4.3 ------	UNKNOWN
219.2044  29.4217    4.1  45.0  -30.9   1.8317   2.8 ------	UNKNOWN
Pre-slew background subtracted image of 15-350 keV band
Time interval of the image:
-0.984000 12.164000

# RAcent  DECcent POSerr Theta    Phi  PeakCts   SNR AngSep     Name
#  [deg]    [deg]    ['] [deg]  [deg]                   [']
244.8706 -15.8122    0.0  18.7 -133.1   0.0861   2.2   12.1	Sco X-1
254.5506  35.5081    5.4  35.5   14.6  -0.1185  -2.1   10.9	Her X-1
255.7753 -37.7294    0.0  37.8 -165.9  -0.0244  -0.5   12.2	4U 1700-377
256.2417 -36.3439   12.2  36.4 -166.6   0.0470   0.9   10.5	GX 349+2
262.9793 -24.5969    5.4  25.8  178.2   0.0862   2.1    9.1	GX 1+4
264.6885 -44.4118   10.1  45.3 -174.6   0.0812   1.1    3.3	4U 1735-44
268.3379  -1.5679    6.3  13.5  112.0  -0.0725  -1.8    7.1	SW J1753.5-0127
270.1761 -25.2137   53.0  29.2  166.1  -0.0103  -0.2   10.0	GX 5-1
270.4721 -25.7951   65.8  29.8  166.2  -0.0083  -0.2    9.7	GRS 1758-258
274.1051 -13.8469    0.0  23.5  142.1  -0.0686  -1.5   12.8	GX 17+2
275.8081 -30.3943    3.7  36.3  163.9   0.1698   3.1    6.3	H1820-303
285.0672 -24.8918   62.2  38.3  148.0   0.0131   0.2    2.4	HT1900.1-2455
288.8741  10.8353   22.0  35.4   86.2  -0.0525  -0.5    8.0	GRS 1915+105
263.0303 -33.8395    5.9  34.7 -176.7  -0.0911  -1.9    2.1	GX 354-0
283.5989  31.3347    2.1  41.4   53.4   0.6702   5.5 ------	UNKNOWN
271.0125  -8.2931    0.8  18.0  133.0   0.5888  13.8 ------	UNKNOWN
Post-slew image of 15-350 keV band
Time interval of the image:
58.772590 962.959600

# RAcent  DECcent POSerr Theta    Phi  PeakCts   SNR AngSep     Name
#  [deg]    [deg]    ['] [deg]  [deg]                   [']
244.9865 -15.6358    0.3  26.5  -99.8  39.8850  43.2    0.5	Sco X-1
254.3218  35.3718    8.7  46.4  -10.1   1.6773   1.3    6.9	Her X-1
256.0040 -37.8328    1.7  32.5 -148.9   5.1757   7.0    1.1	4U 1700-377
256.4441 -36.4198    1.2  31.1 -148.2   6.7184   9.3    0.5	GX 349+2
263.0923 -24.8607   30.6  18.2 -147.7   0.2665   0.4    8.3	GX 1+4
264.8215 -44.4985    3.9  36.6 -163.8   2.3502   3.0    4.4	4U 1735-44
268.3707  -1.4009   14.2   7.4  -12.1   0.5171   0.8    3.1	SW J1753.5-0127
270.2456 -25.0874    1.6  16.8 -168.9   4.5963   7.2    2.2	GX 5-1
270.2311 -25.7694    2.3  17.5 -168.9   3.2066   5.0    4.2	GRS 1758-258
273.9864 -14.0243    1.7   6.4  161.9   4.4165   6.8    1.3	GX 17+2
275.8007 -30.3557    2.9  22.5  177.9   2.7838   4.0    6.5	H1820-303
285.0648 -24.9896    7.4  21.4  151.6  -1.1561  -1.6    4.4	HT1900.1-2455
288.8141  10.9691    2.4  26.2   51.6   4.4522   4.9    1.7	GRS 1915+105
263.1042 -33.8572    4.9  26.6 -156.4   1.7867   2.4    5.9	GX 354-0
297.4870  35.0651    3.7  50.1   37.2  11.5084   3.1 ------	UNKNOWN
289.0975 -63.4700    4.2  56.7  179.2  14.4543   2.7 ------	UNKNOWN
266.1210  -0.2751    2.5   9.4  -22.6   2.6133   4.5 ------	UNKNOWN
260.3800 -33.5172    2.5  27.0 -151.5   3.0597   4.5 ------	UNKNOWN
244.8563  41.8386    2.9  55.6  -14.7  10.2328   4.0 ------	UNKNOWN
230.5263 -39.9536    2.6  47.9 -129.2  13.7677   4.4 ------	UNKNOWN
229.7104 -17.3933    4.1  41.2  -98.2  10.7274   2.8 ------	UNKNOWN
Plot creation:
Mon Nov 16 15:46:31 EST 2015