Click here for the BAT GCN circular template
Image
Pre-slew 15.0-350.0 keV image (Event data)

#   RAcent    DECcent   POSerr    Theta     Phi              Peak Cts       SNR   Name
   76.1894    -6.4284   0.0228    37.3753   118.1370         2.3288620      8.413 TRIG_00661869

Foreground time interval of the image:
  1.000  97.000 (delta_t =  96.000 [sec])
Background time interval of the image:
-239.000   1.000 (delta_t = 240.000 [sec])
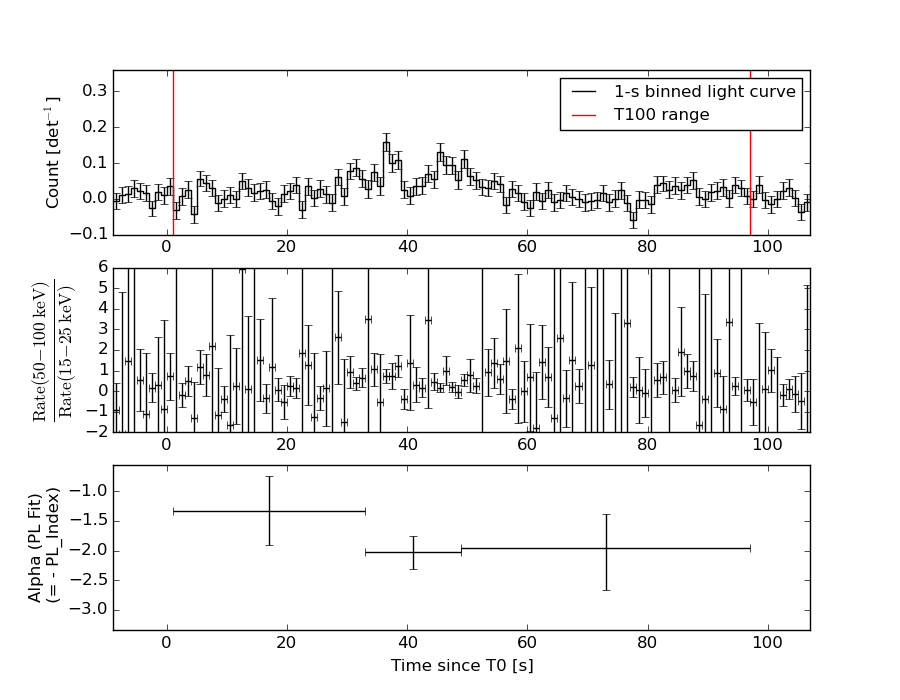
Lightcurves
Notes:
- 1) The mask-weighted light curves are using the flight position.
- 2) Multiple plots of different time binning/intervals are shown to cover all scenarios of short/long GRBs, rate/image triggers, and real/false positives.
- 3) For all the mask-weighted lightcurves, the y-axis units are counts/sec/det where a det is 0.4 x 0.4 = 0.16 sq cm.
- 4) The verticle lines correspond to following: green dotted lines are T50 interval, black dotted lines are T90 interval, blue solid line(s) is a spacecraft slew start time, and orange solid line(s) is a spacecraft slew end time.
- 5) Time of each bin is in the middle of the bin.
1 s binning
From T0-310 s to T0+310 s
From T100_start - 20 s to T100_end + 30 s
Full time interval
64 ms binning
Full time interval
From T100_start to T100_end
From T0-5 sec to T0+5 sec
16 ms binning
From T100_start-5 s to T100_start+5 s

Blue+Cyan dotted lines: Time interval of the scaled map
From 0.000000 to 120.000000
8 ms binning
From T100_start-3 s to T100_start+3 s
Blue+Cyan dotted lines: Time interval of the scaled map
From 0.000000 to 120.000000
2 ms binning
From T100_start-1 s to T100_start+1 s

Blue+Cyan dotted lines: Time interval of the scaled map
From 0.000000 to 120.000000
SN=5 or 10 sec. binning (whichever binning is satisfied first)

SN=5 or 10 sec. binning (T < 200 sec)

Quad-rate summed light curves (from T0-300s to T0+1000s)

Spectral Evolution
Spectra
Notes:
- 1) The fitting includes the systematic errors.
- 2) When the burst includes telescope slew time periods, the fitting uses an average response file made from multiple 5-s response files through out the slew time plus single time preiod for the non-slew times, and weighted by the total counts in the corresponding time period using addrmf. An average response file is needed becuase a spectral fit using the pre-slew DRM will introduce some errors in both a spectral shape and a normalization if the PHA file contains a lot of the slew/post-slew time interval.
- 3) For fits to more complicated models (e.g. a power-law over a cutoff power-law), the BAT team has decided to require a chi-square improvement of more than 6 for each extra dof.
Time averaged spectrum fit using the average DRM
Power-law model

Time interval is from    1.000 sec. to   97.000 sec.

Spectral model in power-law:
------------------------------------------------------------
Parameters  : value       lower 90%   higher 90%
Photon index: 1.81721     ( -0.26495   0.282463 )
Norm@50keV  : 1.66723E-03    ( -0.000288695   0.000279106 )
------------------------------------------------------------
#Fit statistic : Chi-Squared =          58.80 using 59 PHA bins.
# Reduced chi-squared =          1.032 for     57 degrees of freedom
# Null hypothesis probability =   4.094122e-01

Photon flux (15-150 keV)    in 96 sec: 0.231290 ( -0.0338478  0.0338749 ) ph/cm2/s
Energy fluence (15-150 keV)             : 1.47266e-06 ( -2.53097e-07  2.58318e-07 ) ergs/cm2
Cutoff power-law model
Time interval is from    1.000 sec. to   97.000 sec.
Spectral model in the cutoff power-law:
------------------------------------------------------------
Parameters  : value       lower 90%   higher 90%
Photon index: 1.72437     ( -1.0249   0.617109 )
Epeak [keV] : 137.506      (   )
Norm@50keV  : 1.87001E-03    (     )
------------------------------------------------------------
#Fit statistic : Chi-Squared =          58.71 using 59 PHA bins.
# Reduced chi-squared =          1.048 for     56 degrees of freedom
# Null hypothesis probability =   3.762945e-01

Photon flux (15-150 keV)    in 96 sec: 0.229869 ( -0.034244  0.025994 ) ph/cm2/s
Energy fluence (15-150 keV)             : 1.45767e-06 ( -2.65632e-07  2.69126e-07 ) ergs/cm2
Band function
Time interval is from    1.000 sec. to   97.000 sec.

Spectral model in the Band function:
------------------------------------------------------------
Parameters  : value       lower 90%   higher 90%
alpha       : -1.69030   ( -1.2239   0.932466 )
beta        : -9.37167    ( 9.37167   19.3717 )
Epeak [keV] : 110.723      ( -81.7478 -110.859 )
Norm@50keV   : 1.95801E-03    ( -0.000574404   0.00419886 )
------------------------------------------------------------
#Fit statistic : Chi-Squared =          58.71 using 59 PHA bins.
# Reduced chi-squared =          1.067 for     55 degrees of freedom
# Null hypothesis probability =   3.412548e-01

Photon flux (15-150 keV)    in 96 sec: 0.228895 (    ) ph/cm2/s
Energy fluence (15-150 keV)             : 0 ( 0  0 ) ergs/cm2
Single BB
Spectral model blackbody:
------------------------------------------------------------
Parameters  : value    Lower 90%  Upper 90%
kT [keV]    : 13.6403  (-2.88555  3.29365)
R^2/D10^2   : 3.38600E-02  (-0.0180528   0.0456924)
(R is the radius in km and D10 is the distance to the source in units of 10 kpc)
------------------------------------------------------------
#Fit statistic : Chi-Squared =          76.67 using 59 PHA bins.
# Reduced chi-squared =          1.345 for     57 degrees of freedom
# Null hypothesis probability =   4.222653e-02

Energy  Fluence     90% Error
[keV]   [erg/cm2]   [erg/cm2]
15- 25  1.280e-07   4.334e-08
25- 50  4.638e-07   1.228e-07
50-150  5.605e-07   1.923e-07
15-150  1.152e-06   2.533e-07
Thermal bremsstrahlung (OTTB)

Spectral model: thermal bremsstrahlung
------------------------------------------------------------
Parameters  : value         Lower 90%    Upper 90%
kT [keV]    : 107.519       (-44.6691      -107.237)
Norm        : 0.999205       (-0.16419     0.242797)
------------------------------------------------------------
#Fit statistic : Chi-Squared =          59.23 using 59 PHA bins.
# Reduced chi-squared =          1.039 for     57 degrees of freedom
# Null hypothesis probability =   3.943029e-01

Energy  Fluence     90% Error
[keV]   [erg/cm2]   [erg/cm2]
15- 25  2.506e-07   5.174e-08
25- 50  4.395e-07   9.648e-08
50-150  7.413e-07   4.414e-07
15-150  1.431e-06   5.381e-07
Double BB

Spectral model: bbodyrad<1> + bbodyrad<2>
------------------------------------------------------------
Parameters  : value         Lower 90%    Upper 90%
kT1 [keV]   : 4.34399        (-1.19105      1.56171)
R1^2/D10^2  : 1.91872        (-1.4188      5.99674)
kT2 [keV]   : 20.5487        (-4.36188      6.56342)
R2^2/D10^2  : 6.56927E-03    (-0.00414696   0.0091693)
------------------------------------------------------------
#Fit statistic : Chi-Squared =          53.95 using 59 PHA bins.
# Reduced chi-squared =         0.9809 for     55 degrees of freedom
# Null hypothesis probability =   5.148547e-01

Energy  Fluence     90% Error
[keV]   [erg/cm2]   [erg/cm2]
15- 25  2.972e-07   1.548e-07
25- 50  3.693e-07   1.727e-07
50-150  8.107e-07   4.767e-07
15-150  1.477e-06   6.332e-07
Peak spectrum fit
Power-law model
Time interval is from   40.500 sec. to   41.500 sec.

Spectral model in power-law:
------------------------------------------------------------
Parameters  : value       lower 90%   higher 90%
Photon index: 2.10979     ( -2.10699   -2.10699 )
Norm@50keV  : 1.60831E-03    ( -0.00160976   0.00258621 )
------------------------------------------------------------
#Fit statistic : Chi-Squared =          45.81 using 59 PHA bins.
# Reduced chi-squared =         0.8038 for     57 degrees of freedom
# Null hypothesis probability =   8.558133e-01

Photon flux (15-150 keV)    in 1 sec: 0.254262 ( -0.254262  0.318978 ) ph/cm2/s
Energy fluence (15-150 keV)             : 1.49714e-08 ( -1.49693e-08  2.50599e-08 ) ergs/cm2
Cutoff power-law model
Time interval is from   40.500 sec. to   41.500 sec.
Spectral model in the cutoff power-law:
------------------------------------------------------------
Parameters  : value       lower 90%   higher 90%
Photon index: -10.0000     (     )
Epeak [keV] : 41.4233      (   )
Norm@50keV  : 5739.87    (     )
------------------------------------------------------------
#Fit statistic : Chi-Squared =          45.67 using 59 PHA bins.
# Reduced chi-squared =         0.8155 for     56 degrees of freedom
# Null hypothesis probability =   8.363681e-01

Photon flux (15-150 keV)    in 1 sec: 0.239603 0.175872 (    ) ph/cm2/s
Energy fluence (15-150 keV)             : 1.31614e-16 ( 0  0 ) ergs/cm2
Band function

Time interval is from   40.500 sec. to   41.500 sec.

Spectral model in the Band function:
------------------------------------------------------------
Parameters  : value       lower 90%   higher 90%
alpha       : 4.87348   ( -4.87348   -4.87348 )
beta        : -5.44985    ( 5.44985   5.44985 )
Epeak [keV] : 39.8211      (   )
Norm@50keV   : 13.7887    (     )
------------------------------------------------------------
#Fit statistic : Chi-Squared =          45.73 using 59 PHA bins.
# Reduced chi-squared =         0.8314 for     55 degrees of freedom
# Null hypothesis probability =   8.092030e-01

Photon flux (15-150 keV)    in 1 sec:  (    ) ph/cm2/s
Energy fluence (15-150 keV)             : 0 ( 0  0 ) ergs/cm2
Single BB

Spectral model blackbody:
------------------------------------------------------------
Parameters  : value    Lower 90%  Upper 90%
kT [keV]    : 9.18338  (-9.18338  -9.18338)
R^2/D10^2   : 0.174122  (-0.174122   -0.174122)
(R is the radius in km and D10 is the distance to the source in units of 10 kpc)
------------------------------------------------------------
#Fit statistic : Chi-Squared =          45.70 using 59 PHA bins.
# Reduced chi-squared =         0.8018 for     57 degrees of freedom
# Null hypothesis probability =   8.586032e-01

Energy  Fluence     90% Error
[keV]   [erg/cm2]   [erg/cm2]
15- 25  2.888e-09   2.258e-09
25- 50  6.333e-09   5.620e-09
50-150  2.569e-09   3.139e-09
15-150  1.179e-08   1.124e-08
Thermal bremsstrahlung (OTTB)
Spectral model: thermal bremsstrahlung
------------------------------------------------------------
Parameters  : value         Lower 90%    Upper 90%
kT [keV]    : 50.7804       (-51.009      -51.009)
Norm        : 1.46394       (-1.46155     -1.46155)
------------------------------------------------------------
#Fit statistic : Chi-Squared =          45.73 using 59 PHA bins.
# Reduced chi-squared =         0.8023 for     57 degrees of freedom
# Null hypothesis probability =   8.577877e-01

Energy  Fluence     90% Error
[keV]   [erg/cm2]   [erg/cm2]
15- 25  3.592e-09   2.786e-09
25- 50  5.187e-09   4.439e-09
50-150  5.110e-09   7.015e-09
15-150  1.389e-08   1.410e-08
Double BB

Spectral model: bbodyrad<1> + bbodyrad<2>
------------------------------------------------------------
Parameters  : value         Lower 90%    Upper 90%
kT1 [keV]   : 3.40117        (-3.86798      -3.86798)
R1^2/D10^2  : 1.76466        (-2.16555      -2.16555)
kT2 [keV]   : 9.67992        (-10.1763      -10.1763)
R2^2/D10^2  : 0.128658    (-0.103893   -0.103893)
------------------------------------------------------------
#Fit statistic : Chi-Squared =          45.67 using 59 PHA bins.
# Reduced chi-squared =         0.8304 for     55 degrees of freedom
# Null hypothesis probability =   8.107143e-01

Energy  Fluence     90% Error
[keV]   [erg/cm2]   [erg/cm2]
15- 25  3.117e-09   2.414e-09
25- 50  5.909e-09   6.935e-09
50-150  2.733e-09   3.242e-09
15-150  1.176e-08   1.236e-08
Pre-slew spectrum (Pre-slew PHA with pre-slew DRM)
Power-law model

Spectral model in power-law:
------------------------------------------------------------
Parameters  : value       lower 90%   higher 90%
Photon index: 1.81721     ( -0.26495   0.282463 )
Norm@50keV  : 1.66723E-03    ( -0.000288695   0.000279106 )
------------------------------------------------------------
#Fit statistic : Chi-Squared =          58.80 using 59 PHA bins.
# Reduced chi-squared =          1.032 for     57 degrees of freedom
# Null hypothesis probability =   4.094122e-01

Photon flux (15-150 keV)    in 96 sec: 0.231290 ( -0.0338478  0.0338749 ) ph/cm2/s
Energy fluence (15-150 keV)             : 1.47266e-06 ( -2.53097e-07  2.58318e-07 ) ergs/cm2
Cutoff power-law model

Spectral model in the cutoff power-law:
------------------------------------------------------------
Parameters  : value       lower 90%   higher 90%
Photon index: 1.72437     ( -1.0249   0.617109 )
Epeak [keV] : 137.506      (   )
Norm@50keV  : 1.87001E-03    (     )
------------------------------------------------------------
#Fit statistic : Chi-Squared =          58.71 using 59 PHA bins.
# Reduced chi-squared =          1.048 for     56 degrees of freedom
# Null hypothesis probability =   3.762945e-01

Photon flux (15-150 keV)    in 96 sec: 0.229869 ( -0.034244  0.025994 ) ph/cm2/s
Energy fluence (15-150 keV)             : 1.45767e-06 ( -2.65632e-07  2.69126e-07 ) ergs/cm2
Band function

Spectral model in the Band function:
------------------------------------------------------------
Parameters  : value       lower 90%   higher 90%
alpha       : -1.69030   ( -1.2239   0.932466 )
beta        : -9.37167    ( 9.37167   19.3717 )
Epeak [keV] : 110.723      ( -81.7478 -110.859 )
Norm@50keV   : 1.95801E-03    ( -0.000574404   0.00419886 )
------------------------------------------------------------
#Fit statistic : Chi-Squared =          58.71 using 59 PHA bins.
# Reduced chi-squared =          1.067 for     55 degrees of freedom
# Null hypothesis probability =   3.412548e-01

Photon flux (15-150 keV)    in 96 sec: 0.228895 (    ) ph/cm2/s
Energy fluence (15-150 keV)             : 0 ( 0  0 ) ergs/cm2
S(25-50 keV) vs. S(50-100 keV) plot
S(25-50 keV)  = 4.17e-07
S(50-100 keV) = 4.74e-07
T90 vs. Hardness ratio plot

T90                                   = 80 sec.
Hardness ratio (energy fluence ratio) = 1.13669
Color vs. Color plot

Count Ratio  (25-50 keV) / (15-25 keV) = 0.828306
Count Ratio (50-100 keV) / (15-25 keV) = 0.821733
Mask shadow pattern

IMX = -3.602301433771306E-01, IMY = -6.736029410987967E-01
TIME vs. PHA plot around the trigger time
Blue+Cyan dotted lines: Time interval of the scaled map
From 0.000000 to 120.000000
TIME vs. DetID plot around the trigger time
Blue+Cyan dotted lines: Time interval of the scaled map
From 0.000000 to 120.000000
100 us light curve (15-350 keV)

Blue+Cyan dotted lines: Time interval of the scaled map
From 0.000000 to 120.000000
Spacecraft aspect plot
Bright source in the pre-burst/pre-slew/post-slew images
Pre-burst image of 15-350 keV band
Time interval of the image:
-239.000000 1.000000

# RAcent  DECcent POSerr Theta    Phi  PeakCts   SNR AngSep     Name
#  [deg]    [deg]    ['] [deg]  [deg]                   [']
135.4507 -40.5442    3.4  34.3 -116.6   1.0651   3.3    3.6	Vela X-1
 52.3804 -17.7056    2.3  39.7   76.2   3.4876   5.0 ------	UNKNOWN
 25.2412 -33.7544    3.0  50.0   37.1   3.6788   3.9 ------	UNKNOWN
 45.1844 -34.9603    2.6  34.8   46.6   1.2711   4.4 ------	UNKNOWN
101.5367   4.0535    2.3  47.3  156.6   2.4561   5.0 ------	UNKNOWN
 71.6697 -36.2584    2.5  14.8   66.8   0.7903   4.6 ------	UNKNOWN
357.2594 -78.1398    2.5  49.5  -24.5   1.7715   4.7 ------	UNKNOWN
145.8728 -27.1456    3.4  48.0 -129.2   2.8144   3.4 ------	UNKNOWN
148.9548 -49.6272    4.9  41.2  -98.2   2.1857   2.4 ------	UNKNOWN
Pre-slew background subtracted image of 15-350 keV band
Time interval of the image:
1.000000 97.000000

# RAcent  DECcent POSerr Theta    Phi  PeakCts   SNR AngSep     Name
#  [deg]    [deg]    ['] [deg]  [deg]                   [']
135.5177 -40.5034    4.7  34.4 -116.7   0.4398   2.4    3.1	Vela X-1
 76.1894  -6.4284    1.4  37.4  118.1   2.3264   8.4 ------	UNKNOWN
148.0289 -64.0324    2.3  39.7  -76.0   1.7274   5.1 ------	UNKNOWN
Post-slew image of 15-350 keV band
Time interval of the image:
189.500590 417.900590

# RAcent  DECcent POSerr Theta    Phi  PeakCts   SNR AngSep     Name
#  [deg]    [deg]    ['] [deg]  [deg]                   [']
 83.6216  22.0224    0.3  29.4  170.5   9.9218  42.3    0.8	Crab
 29.7133 -18.7454    2.2  46.9   46.7   4.4664   5.2 ------	UNKNOWN
107.3423   2.2668    3.1  32.3 -128.3   1.0017   3.7 ------	UNKNOWN
106.5528 -46.5971    2.5  47.8  -51.5   4.8841   4.6 ------	UNKNOWN
Plot creation:
Mon Nov 16 15:42:17 EST 2015