Special notes of this burst
Image
Pre-slew 15.0-350.0 keV image (Event data)
#   RAcent    DECcent   POSerr    Theta     Phi              Peak Cts       SNR   Name
   83.1890   -39.1246   0.0093    36.4261  -170.6488         0.6707202     20.720 TRIG_00662330

Foreground time interval of the image:
  0.304   6.304 (delta_t =   6.000 [sec])
Background time interval of the image:
-50.595   0.304 (delta_t =  50.899 [sec])
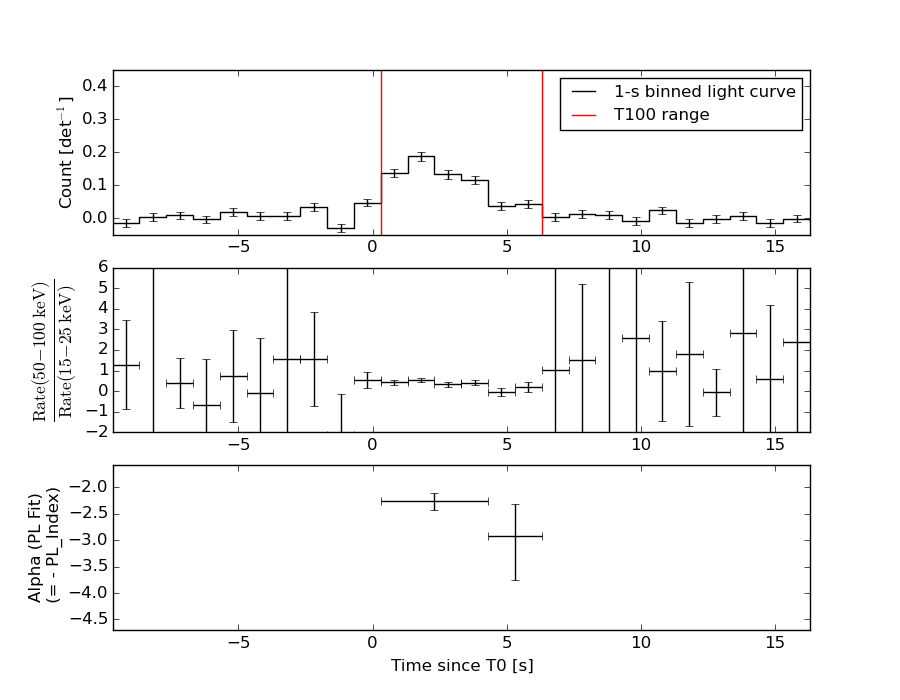
Lightcurves
Notes:
- 1) The mask-weighted light curves are using the flight position.
- 2) Multiple plots of different time binning/intervals are shown to cover all scenarios of short/long GRBs, rate/image triggers, and real/false positives.
- 3) For all the mask-weighted lightcurves, the y-axis units are counts/sec/det where a det is 0.4 x 0.4 = 0.16 sq cm.
- 4) The verticle lines correspond to following: green dotted lines are T50 interval, black dotted lines are T90 interval, blue solid line(s) is a spacecraft slew start time, and orange solid line(s) is a spacecraft slew end time.
- 5) Time of each bin is in the middle of the bin.
1 s binning
From T0-310 s to T0+310 s

From T100_start - 20 s to T100_end + 30 s

Full time interval

64 ms binning
Full time interval
From T100_start to T100_end

From T0-5 sec to T0+5 sec

16 ms binning
From T100_start-5 s to T100_start+5 s

Blue+Cyan dotted lines: Time interval of the scaled map
From 0.000000 to 0.512000
8 ms binning
From T100_start-3 s to T100_start+3 s

Blue+Cyan dotted lines: Time interval of the scaled map
From 0.000000 to 0.512000
2 ms binning
From T100_start-1 s to T100_start+1 s

Blue+Cyan dotted lines: Time interval of the scaled map
From 0.000000 to 0.512000
SN=5 or 10 sec. binning (whichever binning is satisfied first)
SN=5 or 10 sec. binning (T < 200 sec)

Quad-rate summed light curves (from T0-300s to T0+1000s)

Spectral Evolution
Spectra
Notes:
- 1) The fitting includes the systematic errors.
- 2) When the burst includes telescope slew time periods, the fitting uses an average response file made from multiple 5-s response files through out the slew time plus single time preiod for the non-slew times, and weighted by the total counts in the corresponding time period using addrmf. An average response file is needed becuase a spectral fit using the pre-slew DRM will introduce some errors in both a spectral shape and a normalization if the PHA file contains a lot of the slew/post-slew time interval.
- 3) For fits to more complicated models (e.g. a power-law over a cutoff power-law), the BAT team has decided to require a chi-square improvement of more than 6 for each extra dof.
Time averaged spectrum fit using the average DRM
Power-law model

Time interval is from    0.304 sec. to    6.304 sec.

Spectral model in power-law:
------------------------------------------------------------
Parameters  : value       lower 90%   higher 90%
Photon index: 2.36257     ( -0.163314   0.172341 )
Norm@50keV  : 5.79990E-03    ( -0.000675628   0.000663838 )
------------------------------------------------------------
#Fit statistic : Chi-Squared =          47.17 using 59 PHA bins.
# Reduced chi-squared =         0.8275 for     57 degrees of freedom
# Null hypothesis probability =   8.202299e-01

Photon flux (15-150 keV)    in 6 sec: 1.05008 ( -0.0831785  0.0832305 ) ph/cm2/s
Energy fluence (15-150 keV)             : 3.36685e-07 ( -3.09467e-08  3.14627e-08 ) ergs/cm2
Cutoff power-law model
Time interval is from    0.304 sec. to    6.304 sec.
Spectral model in the cutoff power-law:
------------------------------------------------------------
Parameters  : value       lower 90%   higher 90%
Photon index: 1.98267     ( -0.519926   0.0289324 )
Epeak [keV] : 1.82342      ( -0.724274 23.0684 )
Norm@50keV  : 9.71596E-03    ( -0.00162087   0.00179295 )
------------------------------------------------------------
#Fit statistic : Chi-Squared =          47.12 using 59 PHA bins.
# Reduced chi-squared =         0.8414 for     56 degrees of freedom
# Null hypothesis probability =   7.950514e-01

Photon flux (15-150 keV)    in 6 sec: 1.04172 ( -0.086846  0.08666 ) ph/cm2/s
Energy fluence (15-150 keV)             : 3.29872e-07 ( -3.70368e-08  3.6489e-08 ) ergs/cm2
Band function
Time interval is from    0.304 sec. to    6.304 sec.

Spectral model in the Band function:
------------------------------------------------------------
Parameters  : value       lower 90%   higher 90%
alpha       : 4.54505   ( -4.54505   -4.54505 )
beta        : -2.50632    ( -0.231467   0.203562 )
Epeak [keV] : 20.7945      ( -4.07098 2.814 )
Norm@50keV   : 1885.50    ( -147.442   1.34102e+07 )
------------------------------------------------------------
#Fit statistic : Chi-Squared =          44.72 using 59 PHA bins.
# Reduced chi-squared =         0.8131 for     55 degrees of freedom
# Null hypothesis probability =   8.374875e-01

Photon flux (15-150 keV)    in 6 sec:  (    ) ph/cm2/s
Energy fluence (15-150 keV)             : 0 ( 0  0 ) ergs/cm2
Single BB
Spectral model blackbody:
------------------------------------------------------------
Parameters  : value    Lower 90%  Upper 90%
kT [keV]    : 7.52772  (-0.739264  0.836665)
R^2/D10^2   : 1.40588  (-0.497995   0.768454)
(R is the radius in km and D10 is the distance to the source in units of 10 kpc)
------------------------------------------------------------
#Fit statistic : Chi-Squared =          83.95 using 59 PHA bins.
# Reduced chi-squared =          1.473 for     57 degrees of freedom
# Null hypothesis probability =   1.161589e-02

Energy  Fluence     90% Error
[keV]   [erg/cm2]   [erg/cm2]
15- 25  8.230e-08   1.065e-08
25- 50  1.292e-07   1.383e-08
50-150  2.766e-08   7.710e-09
15-150  2.392e-07   2.370e-08
Thermal bremsstrahlung (OTTB)

Spectral model: thermal bremsstrahlung
------------------------------------------------------------
Parameters  : value         Lower 90%    Upper 90%
kT [keV]    : 39.2301       (-7.6367      10.2393)
Norm        : 6.76245       (-1.08793     1.35723)
------------------------------------------------------------
#Fit statistic : Chi-Squared =          50.69 using 59 PHA bins.
# Reduced chi-squared =         0.8892 for     57 degrees of freedom
# Null hypothesis probability =   7.094060e-01

Energy  Fluence     90% Error
[keV]   [erg/cm2]   [erg/cm2]
15- 25  9.256e-08   9.570e-09
25- 50  1.207e-07   1.113e-08
50-150  9.143e-08   2.244e-08
15-150  3.047e-07   2.937e-08
Double BB
Spectral model: bbodyrad<1> + bbodyrad<2>
------------------------------------------------------------
Parameters  : value         Lower 90%    Upper 90%
kT1 [keV]   : 5.15015        (-0.763596      0.822274)
R1^2/D10^2  : 5.57516        (-2.51784      5.33371)
kT2 [keV]   : 19.0014        (-4.35268      7.15918)
R2^2/D10^2  : 2.15855E-02    (-0.0152664   0.041362)
------------------------------------------------------------
#Fit statistic : Chi-Squared =          42.72 using 59 PHA bins.
# Reduced chi-squared =         0.7766 for     55 degrees of freedom
# Null hypothesis probability =   8.863106e-01

Energy  Fluence     90% Error
[keV]   [erg/cm2]   [erg/cm2]
15- 25  1.006e-07   2.403e-08
25- 50  1.084e-07   2.761e-08
50-150  1.203e-07   6.700e-08
15-150  3.294e-07   1.004e-07
Peak spectrum fit
Power-law model

Time interval is from    1.304 sec. to    2.304 sec.

Spectral model in power-law:
------------------------------------------------------------
Parameters  : value       lower 90%   higher 90%
Photon index: 2.05274     ( -0.199694   0.211756 )
Norm@50keV  : 1.11824E-02    ( -0.00159857   0.00156187 )
------------------------------------------------------------
#Fit statistic : Chi-Squared =          39.53 using 59 PHA bins.
# Reduced chi-squared =         0.6935 for     57 degrees of freedom
# Null hypothesis probability =   9.622656e-01

Photon flux (15-150 keV)    in 1 sec: 1.71935 ( -0.193624  0.193689 ) ph/cm2/s
Energy fluence (15-150 keV)             : 1.03473e-07 ( -1.35609e-08  1.38057e-08 ) ergs/cm2
Cutoff power-law model
Time interval is from    1.304 sec. to    2.304 sec.
Spectral model in the cutoff power-law:
------------------------------------------------------------
Parameters  : value       lower 90%   higher 90%
Photon index: 1.34610     ( -1.10542   0.84917 )
Epeak [keV] : 37.4536      (   )
Norm@50keV  : 2.92909E-02    (     )
------------------------------------------------------------
#Fit statistic : Chi-Squared =          37.57 using 59 PHA bins.
# Reduced chi-squared =         0.6710 for     56 degrees of freedom
# Null hypothesis probability =   9.722536e-01

Photon flux (15-150 keV)    in 1 sec: 1.68400 ( -0.19814  0.19819 ) ph/cm2/s
Energy fluence (15-150 keV)             : 9.67144e-08 ( -1.52452e-08  1.59736e-08 ) ergs/cm2
Band function

Time interval is from    1.304 sec. to    2.304 sec.

Spectral model in the Band function:
------------------------------------------------------------
Parameters  : value       lower 90%   higher 90%
alpha       : 4.50837   ( -5.98178   -4.50837 )
beta        : -2.36108    ( -0.356628   0.290752 )
Epeak [keV] : 25.4936      ( -3.71645 3.64407 )
Norm@50keV   : 762.657    ( -84.5003   6593.58 )
------------------------------------------------------------
#Fit statistic : Chi-Squared =          34.71 using 59 PHA bins.
# Reduced chi-squared =         0.6311 for     55 degrees of freedom
# Null hypothesis probability =   9.852177e-01

Photon flux (15-150 keV)    in 1 sec:  (    ) ph/cm2/s
Energy fluence (15-150 keV)             : 9.87649e-08 ( 0  0 ) ergs/cm2
Single BB

Spectral model blackbody:
------------------------------------------------------------
Parameters  : value    Lower 90%  Upper 90%
kT [keV]    : 9.08817  (-1.11896  1.3072)
R^2/D10^2   : 1.16769  (-0.480255   0.791621)
(R is the radius in km and D10 is the distance to the source in units of 10 kpc)
------------------------------------------------------------
#Fit statistic : Chi-Squared =          49.99 using 59 PHA bins.
# Reduced chi-squared =         0.8771 for     57 degrees of freedom
# Null hypothesis probability =   7.330016e-01

Energy  Fluence     90% Error
[keV]   [erg/cm2]   [erg/cm2]
15- 25  1.887e-08   3.795e-09
25- 50  4.072e-08   6.055e-09
50-150  1.600e-08   4.955e-09
15-150  7.560e-08   1.160e-08
Thermal bremsstrahlung (OTTB)
Spectral model: thermal bremsstrahlung
------------------------------------------------------------
Parameters  : value         Lower 90%    Upper 90%
kT [keV]    : 59.2364       (-16.3819      26.4524)
Norm        : 9.11658       (-1.6294     1.95073)
------------------------------------------------------------
#Fit statistic : Chi-Squared =          37.52 using 59 PHA bins.
# Reduced chi-squared =         0.6582 for     57 degrees of freedom
# Null hypothesis probability =   9.784587e-01

Energy  Fluence     90% Error
[keV]   [erg/cm2]   [erg/cm2]
15- 25  2.286e-08   3.595e-09
25- 50  3.466e-08   4.355e-09
50-150  3.902e-08   1.001e-08
15-150  9.655e-08   1.416e-08
Double BB

Spectral model: bbodyrad<1> + bbodyrad<2>
------------------------------------------------------------
Parameters  : value         Lower 90%    Upper 90%
kT1 [keV]   : 6.51100        (-1.55185      1.61841)
R1^2/D10^2  : 3.34656        (-1.78574      5.1684)
kT2 [keV]   : 22.4320        (-8.00332      29.5062)
R2^2/D10^2  : 2.07389E-02    (-0.0194169   0.0713229)
------------------------------------------------------------
#Fit statistic : Chi-Squared =          34.95 using 59 PHA bins.
# Reduced chi-squared =         0.6355 for     55 degrees of freedom
# Null hypothesis probability =   9.840077e-01

Energy  Fluence     90% Error
[keV]   [erg/cm2]   [erg/cm2]
15- 25  2.292e-08   8.940e-09
25- 50  3.514e-08   1.400e-08
50-150  4.165e-08   2.339e-08
15-150  9.970e-08   4.289e-08
Pre-slew spectrum (Pre-slew PHA with pre-slew DRM)
Power-law model
Spectral model in power-law:
------------------------------------------------------------
Parameters  : value       lower 90%   higher 90%
Photon index: 2.36257     ( -0.163314   0.172341 )
Norm@50keV  : 5.79990E-03    ( -0.000675628   0.000663838 )
------------------------------------------------------------
#Fit statistic : Chi-Squared =          47.17 using 59 PHA bins.
# Reduced chi-squared =         0.8275 for     57 degrees of freedom
# Null hypothesis probability =   8.202299e-01

Photon flux (15-150 keV)    in 6 sec: 1.05008 ( -0.0831785  0.0832305 ) ph/cm2/s
Energy fluence (15-150 keV)             : 3.36685e-07 ( -3.09467e-08  3.14627e-08 ) ergs/cm2
Cutoff power-law model

Spectral model in the cutoff power-law:
------------------------------------------------------------
Parameters  : value       lower 90%   higher 90%
Photon index: 1.98267     ( -0.519926   0.0289324 )
Epeak [keV] : 1.82342      ( -0.724274 23.0684 )
Norm@50keV  : 9.71596E-03    ( -0.00162087   0.00179295 )
------------------------------------------------------------
#Fit statistic : Chi-Squared =          47.12 using 59 PHA bins.
# Reduced chi-squared =         0.8414 for     56 degrees of freedom
# Null hypothesis probability =   7.950514e-01

Photon flux (15-150 keV)    in 6 sec: 1.04172 ( -0.086846  0.08666 ) ph/cm2/s
Energy fluence (15-150 keV)             : 3.29872e-07 ( -3.70368e-08  3.6489e-08 ) ergs/cm2
Band function

Spectral model in the Band function:
------------------------------------------------------------
Parameters  : value       lower 90%   higher 90%
alpha       : 4.54505   ( -4.54505   -4.54505 )
beta        : -2.50632    ( -0.231467   0.203562 )
Epeak [keV] : 20.7945      ( -4.07098 2.814 )
Norm@50keV   : 1885.50    ( -147.442   1.38305e+07 )
------------------------------------------------------------
#Fit statistic : Chi-Squared =          44.72 using 59 PHA bins.
# Reduced chi-squared =         0.8131 for     55 degrees of freedom
# Null hypothesis probability =   8.374875e-01

Photon flux (15-150 keV)    in 6 sec:  (    ) ph/cm2/s
Energy fluence (15-150 keV)             : 0 ( 0  0 ) ergs/cm2
S(25-50 keV) vs. S(50-100 keV) plot

S(25-50 keV)  = 1.10e-07
S(50-100 keV) = 8.54e-08
T90 vs. Hardness ratio plot

T90                                   = 5 sec.
Hardness ratio (energy fluence ratio) = 0.776364
Color vs. Color plot

Count Ratio  (25-50 keV) / (15-25 keV) = 0.844906
Count Ratio (50-100 keV) / (15-25 keV) = 0.370523
Mask shadow pattern

IMX = -7.281587782672493E-01, IMY = 1.199093804592359E-01
TIME vs. PHA plot around the trigger time
Blue+Cyan dotted lines: Time interval of the scaled map
From 0.000000 to 0.512000
TIME vs. DetID plot around the trigger time
Blue+Cyan dotted lines: Time interval of the scaled map
From 0.000000 to 0.512000
100 us light curve (15-350 keV)
Blue+Cyan dotted lines: Time interval of the scaled map
From 0.000000 to 0.512000
Spacecraft aspect plot
Bright source in the pre-burst/pre-slew/post-slew images
Pre-burst image of 15-350 keV band
Time interval of the image:
-50.595410 0.304000

# RAcent  DECcent POSerr Theta    Phi  PeakCts   SNR AngSep     Name
#  [deg]    [deg]    ['] [deg]  [deg]                   [']
354.4498 -43.8590    2.4  27.5   -5.8   0.3437   4.8 ------	UNKNOWN
Pre-slew background subtracted image of 15-350 keV band
Time interval of the image:
0.304000 6.304000

# RAcent  DECcent POSerr Theta    Phi  PeakCts   SNR AngSep     Name
#  [deg]    [deg]    ['] [deg]  [deg]                   [']
 87.5103 -14.4508    2.0  55.0  165.5   0.8283   5.7 ------	UNKNOWN
 83.1890 -39.1246    0.6  36.4 -170.6   0.6706  20.7 ------	UNKNOWN
 54.1634 -75.0811    2.3  29.8  -97.6   0.2008   5.1 ------	UNKNOWN
Post-slew image of 15-350 keV band
Time interval of the image:
283.804610 364.604580

# RAcent  DECcent POSerr Theta    Phi  PeakCts   SNR AngSep     Name
#  [deg]    [deg]    ['] [deg]  [deg]                   [']
 83.6284  22.0206    0.4  29.4  156.5   3.4016  27.2    0.5	Crab
100.6786  33.0549    2.0  45.8  171.4   1.1568   5.7 ------	UNKNOWN
105.0101  34.9381    2.1  49.5  173.7   1.4196   5.5 ------	UNKNOWN
124.6364  26.9558    2.8  57.5 -165.4   2.0312   4.0 ------	UNKNOWN
 55.2615 -56.8507    2.6  53.0  -23.4   1.1991   4.4 ------	UNKNOWN
 86.0979 -56.4292    2.8  50.6  -44.6   2.0974   4.1 ------	UNKNOWN
Plot creation:
Mon Nov 16 15:33:23 EST 2015