Special notes of this burst
Image
Pre-slew 15.0-350.0 keV image (Event data)

#   RAcent    DECcent   POSerr    Theta     Phi              Peak Cts       SNR   Name
    2.0541   -61.6687   0.0162    35.9590   -38.2473         1.6418399     11.829 TRIG_00663179

Foreground time interval of the image:
 -0.064  69.024 (delta_t =  69.088 [sec])
Background time interval of the image:
-239.488  -0.064 (delta_t = 239.424 [sec])
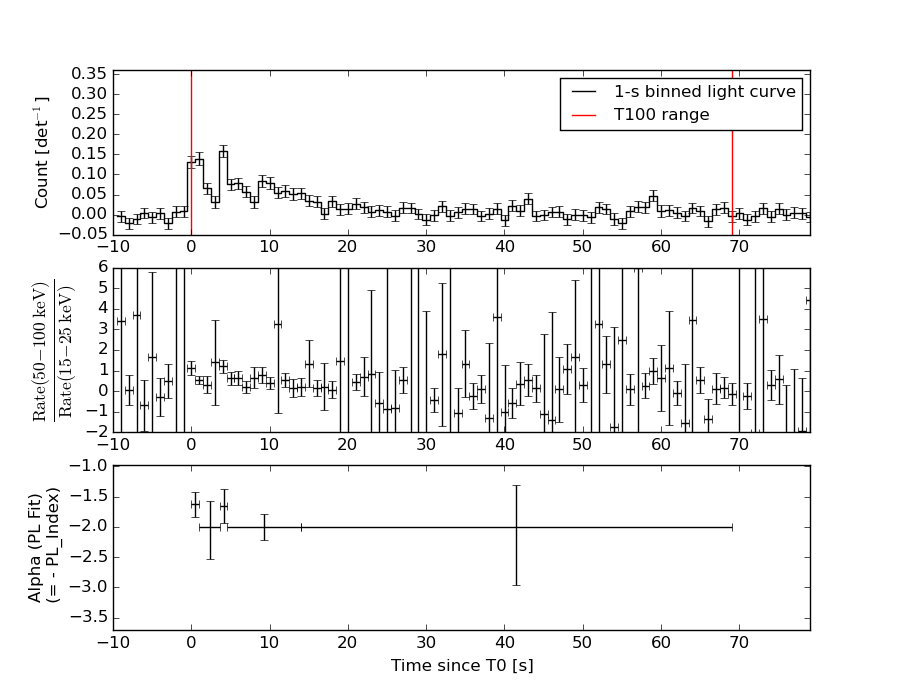
Lightcurves
Notes:
- 1) The mask-weighted light curves are using the flight position.
- 2) Multiple plots of different time binning/intervals are shown to cover all scenarios of short/long GRBs, rate/image triggers, and real/false positives.
- 3) For all the mask-weighted lightcurves, the y-axis units are counts/sec/det where a det is 0.4 x 0.4 = 0.16 sq cm.
- 4) The verticle lines correspond to following: green dotted lines are T50 interval, black dotted lines are T90 interval, blue solid line(s) is a spacecraft slew start time, and orange solid line(s) is a spacecraft slew end time.
- 5) Time of each bin is in the middle of the bin.
1 s binning
From T0-310 s to T0+310 s

From T100_start - 20 s to T100_end + 30 s

Full time interval

64 ms binning
Full time interval
From T100_start to T100_end

From T0-5 sec to T0+5 sec

16 ms binning
From T100_start-5 s to T100_start+5 s

Blue+Cyan dotted lines: Time interval of the scaled map
From 0.000000 to 0.512000
8 ms binning
From T100_start-3 s to T100_start+3 s

Blue+Cyan dotted lines: Time interval of the scaled map
From 0.000000 to 0.512000
2 ms binning
From T100_start-1 s to T100_start+1 s

Blue+Cyan dotted lines: Time interval of the scaled map
From 0.000000 to 0.512000
SN=5 or 10 sec. binning (whichever binning is satisfied first)

SN=5 or 10 sec. binning (T < 200 sec)

Quad-rate summed light curves (from T0-300s to T0+1000s)

Spectral Evolution
Spectra
Notes:
- 1) The fitting includes the systematic errors.
- 2) When the burst includes telescope slew time periods, the fitting uses an average response file made from multiple 5-s response files through out the slew time plus single time preiod for the non-slew times, and weighted by the total counts in the corresponding time period using addrmf. An average response file is needed becuase a spectral fit using the pre-slew DRM will introduce some errors in both a spectral shape and a normalization if the PHA file contains a lot of the slew/post-slew time interval.
- 3) For fits to more complicated models (e.g. a power-law over a cutoff power-law), the BAT team has decided to require a chi-square improvement of more than 6 for each extra dof.
Time averaged spectrum fit using the average DRM
Power-law model

Time interval is from   -0.064 sec. to   69.024 sec.

Spectral model in power-law:
------------------------------------------------------------
Parameters  : value       lower 90%   higher 90%
Photon index: 1.88008     ( -0.217691   0.229938 )
Norm@50keV  : 1.46218E-03    ( -0.000203439   0.000197332 )
------------------------------------------------------------
#Fit statistic : Chi-Squared =          70.97 using 59 PHA bins.
# Reduced chi-squared =          1.245 for     57 degrees of freedom
# Null hypothesis probability =   1.010607e-01

Photon flux (15-150 keV)    in 69.09 sec: 0.208086 ( -0.0240912  0.0241165 ) ph/cm2/s
Energy fluence (15-150 keV)             : 9.28687e-07 ( -1.25879e-07  1.28049e-07 ) ergs/cm2
Cutoff power-law model

Time interval is from   -0.064 sec. to   69.024 sec.
Spectral model in the cutoff power-law:
------------------------------------------------------------
Parameters  : value       lower 90%   higher 90%
Photon index: 1.87952     ( -0.713716   1.16182 )
Epeak [keV] : 830.730      (   )
Norm@50keV  : 1.46174E-03    (     )
------------------------------------------------------------
#Fit statistic : Chi-Squared =          70.98 using 59 PHA bins.
# Reduced chi-squared =          1.267 for     56 degrees of freedom
# Null hypothesis probability =   8.575130e-02

Photon flux (15-150 keV)    in 69.09 sec: 0.208169 ( -0.024274  0.023979 ) ph/cm2/s
Energy fluence (15-150 keV)             : 9.27112e-07 ( -1.29606e-07  1.281e-07 ) ergs/cm2
Band function

Time interval is from   -0.064 sec. to   69.024 sec.

Spectral model in the Band function:
------------------------------------------------------------
Parameters  : value       lower 90%   higher 90%
alpha       : -1.53199   ( 1.53199   1.53199 )
beta        : -1.88007    ( 1.88007   0.21769 )
Epeak [keV] : 15.2142      ( -15.188 -15.188 )
Norm@50keV   : 3.47366E-03    ( -0.00219061   0.216302 )
------------------------------------------------------------
#Fit statistic : Chi-Squared =          70.97 using 59 PHA bins.
# Reduced chi-squared =          1.290 for     55 degrees of freedom
# Null hypothesis probability =   7.242565e-02

Photon flux (15-150 keV)    in 69.09 sec:  (    ) ph/cm2/s
Energy fluence (15-150 keV)             : 0 ( 0  0 ) ergs/cm2
Single BB

Spectral model blackbody:
------------------------------------------------------------
Parameters  : value    Lower 90%  Upper 90%
kT [keV]    : 11.2131  (-1.7011  2.01303)
R^2/D10^2   : 6.13797E-02  (-0.0280666   0.0522944)
(R is the radius in km and D10 is the distance to the source in units of 10 kpc)
------------------------------------------------------------
#Fit statistic : Chi-Squared =          96.60 using 59 PHA bins.
# Reduced chi-squared =          1.695 for     57 degrees of freedom
# Null hypothesis probability =   8.256062e-04

Energy  Fluence     90% Error
[keV]   [erg/cm2]   [erg/cm2]
15- 25  1.118e-07   2.328e-08
25- 50  3.240e-07   5.413e-08
50-150  2.335e-07   6.636e-08
15-150  6.692e-07   1.110e-07
Thermal bremsstrahlung (OTTB)

Spectral model: thermal bremsstrahlung
------------------------------------------------------------
Parameters  : value         Lower 90%    Upper 90%
kT [keV]    : 91.6550       (-31.5616      66.6067)
Norm        : 0.928583       (-0.149695     0.193179)
------------------------------------------------------------
#Fit statistic : Chi-Squared =          73.02 using 59 PHA bins.
# Reduced chi-squared =          1.281 for     57 degrees of freedom
# Null hypothesis probability =   7.493247e-02

Energy  Fluence     90% Error
[keV]   [erg/cm2]   [erg/cm2]
15- 25  1.675e-07   2.815e-08
25- 50  2.844e-07   3.848e-08
50-150  4.379e-07   2.016e-07
15-150  8.898e-07   2.145e-07
Double BB

Spectral model: bbodyrad<1> + bbodyrad<2>
------------------------------------------------------------
Parameters  : value         Lower 90%    Upper 90%
kT1 [keV]   : 5.03899        (-1.86215      2.28788)
R1^2/D10^2  : 0.918227        (-0.661673      6.52807)
kT2 [keV]   : 20.4594        (-5.74004      14.288)
R2^2/D10^2  : 5.22585E-03    (-0.00435855   0.0117571)
------------------------------------------------------------
#Fit statistic : Chi-Squared =          72.94 using 59 PHA bins.
# Reduced chi-squared =          1.326 for     55 degrees of freedom
# Null hypothesis probability =   5.308965e-02

Energy  Fluence     90% Error
[keV]   [erg/cm2]   [erg/cm2]
15- 25  1.880e-07   9.507e-08
25- 50  2.519e-07   1.150e-07
50-150  4.587e-07   2.584e-07
15-150  8.986e-07   3.581e-07
Peak spectrum fit
Power-law model

Time interval is from   -0.012 sec. to    0.988 sec.

Spectral model in power-law:
------------------------------------------------------------
Parameters  : value       lower 90%   higher 90%
Photon index: 1.65599     ( -0.201893   0.208766 )
Norm@50keV  : 1.43314E-02    ( -0.00182636   0.00180265 )
------------------------------------------------------------
#Fit statistic : Chi-Squared =          57.80 using 59 PHA bins.
# Reduced chi-squared =          1.014 for     57 degrees of freedom
# Null hypothesis probability =   4.456678e-01

Photon flux (15-150 keV)    in 1 sec: 1.87499 ( -0.227457  0.227824 ) ph/cm2/s
Energy fluence (15-150 keV)             : 1.33209e-07 ( -1.78381e-08  1.79943e-08 ) ergs/cm2
Cutoff power-law model

Time interval is from   -0.012 sec. to    0.988 sec.
Spectral model in the cutoff power-law:
------------------------------------------------------------
Parameters  : value       lower 90%   higher 90%
Photon index: 1.15316     ( -0.998857   0.719826 )
Epeak [keV] : 85.1179      ( -33.5379 -85.1171 )
Norm@50keV  : 2.57424E-02    ( -0.0128263   0.0536685 )
------------------------------------------------------------
#Fit statistic : Chi-Squared =          56.77 using 59 PHA bins.
# Reduced chi-squared =          1.014 for     56 degrees of freedom
# Null hypothesis probability =   4.461475e-01

Photon flux (15-150 keV)    in 1 sec: 1.84088 ( -0.23628  0.23511 ) ph/cm2/s
Energy fluence (15-150 keV)             : 1.29934e-07 ( -1.8749e-08  1.8883e-08 ) ergs/cm2
Band function

Time interval is from   -0.012 sec. to    0.988 sec.

Spectral model in the Band function:
------------------------------------------------------------
Parameters  : value       lower 90%   higher 90%
alpha       : -1.17432   ( -0.492857   0.739616 )
beta        : -9.36769    ( 9.37073   19.3707 )
Epeak [keV] : 87.5603      ( -30.1105 -87.4342 )
Norm@50keV   : 2.50084E-02    ( -0.0120889   0.00941826 )
------------------------------------------------------------
#Fit statistic : Chi-Squared =          56.77 using 59 PHA bins.
# Reduced chi-squared =          1.032 for     55 degrees of freedom
# Null hypothesis probability =   4.087413e-01

Photon flux (15-150 keV)    in 1 sec: 1.84298 (    ) ph/cm2/s
Energy fluence (15-150 keV)             : 1.3017e-07 ( 0  0 ) ergs/cm2
Single BB

Spectral model blackbody:
------------------------------------------------------------
Parameters  : value    Lower 90%  Upper 90%
kT [keV]    : 14.5500  (-1.86833  2.15014)
R^2/D10^2   : 0.236459  (-0.0928768   0.15044)
(R is the radius in km and D10 is the distance to the source in units of 10 kpc)
------------------------------------------------------------
#Fit statistic : Chi-Squared =          69.63 using 59 PHA bins.
# Reduced chi-squared =          1.222 for     57 degrees of freedom
# Null hypothesis probability =   1.216919e-01

Energy  Fluence     90% Error
[keV]   [erg/cm2]   [erg/cm2]
15- 25  1.053e-08   2.458e-09
25- 50  4.065e-08   7.070e-09
50-150  5.776e-08   1.347e-08
15-150  1.089e-07   1.774e-08
Thermal bremsstrahlung (OTTB)

Spectral model: thermal bremsstrahlung
------------------------------------------------------------
Parameters  : value         Lower 90%    Upper 90%
kT [keV]    : 160.212       (-65.9775      -158.778)
Norm        : 7.71462       (-0.986248     1.26512)
------------------------------------------------------------
#Fit statistic : Chi-Squared =          56.91 using 59 PHA bins.
# Reduced chi-squared =         0.9984 for     57 degrees of freedom
# Null hypothesis probability =   4.784885e-01

Energy  Fluence     90% Error
[keV]   [erg/cm2]   [erg/cm2]
15- 25  1.970e-08   5.971e-09
25- 50  3.685e-08   1.923e-08
50-150  7.469e-08   4.163e-08
15-150  1.312e-07   7.305e-08
Double BB

Spectral model: bbodyrad<1> + bbodyrad<2>
------------------------------------------------------------
Parameters  : value         Lower 90%    Upper 90%
kT1 [keV]   : 2.98989        (-1.10983      1.73271)
R1^2/D10^2  : 74.6294        (-67.4444      1613.98)
kT2 [keV]   : 17.1682        (-2.549      3.41702)
R2^2/D10^2  : 0.120040    (-0.0597928   0.0613809)
------------------------------------------------------------
#Fit statistic : Chi-Squared =          53.00 using 59 PHA bins.
# Reduced chi-squared =         0.9637 for     55 degrees of freedom
# Null hypothesis probability =   5.512657e-01

Energy  Fluence     90% Error
[keV]   [erg/cm2]   [erg/cm2]
15- 25  2.085e-08   8.907e-09
25- 50  3.401e-08   8.775e-09
50-150  6.765e-08   2.056e-08
15-150  1.225e-07   2.471e-08
Pre-slew spectrum (Pre-slew PHA with pre-slew DRM)
Power-law model
Spectral model in power-law:
------------------------------------------------------------
Parameters  : value       lower 90%   higher 90%
Photon index: 1.88008     ( -0.217691   0.229938 )
Norm@50keV  : 1.46218E-03    ( -0.000203439   0.000197332 )
------------------------------------------------------------
#Fit statistic : Chi-Squared =          70.97 using 59 PHA bins.
# Reduced chi-squared =          1.245 for     57 degrees of freedom
# Null hypothesis probability =   1.010607e-01

Photon flux (15-150 keV)    in 69.09 sec: 0.208086 ( -0.0240912  0.0241165 ) ph/cm2/s
Energy fluence (15-150 keV)             : 9.28687e-07 ( -1.25879e-07  1.28049e-07 ) ergs/cm2
Cutoff power-law model
Spectral model in the cutoff power-law:
------------------------------------------------------------
Parameters  : value       lower 90%   higher 90%
Photon index: 1.87952     ( -0.713716   1.16182 )
Epeak [keV] : 830.730      (   )
Norm@50keV  : 1.46174E-03    (     )
------------------------------------------------------------
#Fit statistic : Chi-Squared =          70.98 using 59 PHA bins.
# Reduced chi-squared =          1.267 for     56 degrees of freedom
# Null hypothesis probability =   8.575130e-02

Photon flux (15-150 keV)    in 69.09 sec: 0.208169 ( -0.024274  0.023979 ) ph/cm2/s
Energy fluence (15-150 keV)             : 9.27112e-07 ( -1.29606e-07  1.281e-07 ) ergs/cm2
Band function

Spectral model in the Band function:
------------------------------------------------------------
Parameters  : value       lower 90%   higher 90%
alpha       : -1.53199   ( 1.53199   1.53199 )
beta        : -1.88007    ( 1.88007   0.21769 )
Epeak [keV] : 15.2142      ( -15.188 -15.188 )
Norm@50keV   : 3.47366E-03    ( -0.00219061   3.65737 )
------------------------------------------------------------
#Fit statistic : Chi-Squared =          70.97 using 59 PHA bins.
# Reduced chi-squared =          1.290 for     55 degrees of freedom
# Null hypothesis probability =   7.242565e-02

Photon flux (15-150 keV)    in 69.09 sec:  (    ) ph/cm2/s
Energy fluence (15-150 keV)             : 0 ( 0  0 ) ergs/cm2
S(25-50 keV) vs. S(50-100 keV) plot

S(25-50 keV)  = 2.69e-07
S(50-100 keV) = 2.92e-07
T90 vs. Hardness ratio plot

T90                                   = 58.8640000224113 sec.
Hardness ratio (energy fluence ratio) = 1.0855
Color vs. Color plot

Count Ratio  (25-50 keV) / (15-25 keV) = 1.03292
Count Ratio (50-100 keV) / (15-25 keV) = 0.677149
Mask shadow pattern
IMX = 5.697283094631234E-01, IMY = 4.490948199953240E-01
TIME vs. PHA plot around the trigger time

Blue+Cyan dotted lines: Time interval of the scaled map
From 0.000000 to 0.512000
TIME vs. DetID plot around the trigger time

Blue+Cyan dotted lines: Time interval of the scaled map
From 0.000000 to 0.512000
100 us light curve (15-350 keV)

Blue+Cyan dotted lines: Time interval of the scaled map
From 0.000000 to 0.512000
Spacecraft aspect plot

Bright source in the pre-burst/pre-slew/post-slew images
Pre-burst image of 15-350 keV band
Time interval of the image:
-239.488000 -0.064000

# RAcent  DECcent POSerr Theta    Phi  PeakCts   SNR AngSep     Name
#  [deg]    [deg]    ['] [deg]  [deg]                   [']
 38.2522  -6.9890    2.1  40.6   71.3   3.8558   5.5 ------	UNKNOWN
 73.4591  -7.0346    2.6  39.9  126.7   2.3328   4.4 ------	UNKNOWN
 11.3604 -25.2023    2.8  41.3   22.4   1.3281   4.0 ------	UNKNOWN
106.0974 -27.7744    2.7  42.4 -175.3   1.1980   4.3 ------	UNKNOWN
342.6739 -31.0523    3.1  58.2   -3.7   4.3229   3.7 ------	UNKNOWN
 14.9085 -53.4893    2.7  28.7  -23.6   0.8289   4.3 ------	UNKNOWN
132.5091 -54.3277    2.7  48.0 -129.1   3.4966   4.2 ------	UNKNOWN
Pre-slew background subtracted image of 15-350 keV band
Time interval of the image:
-0.064000 69.024000

# RAcent  DECcent POSerr Theta    Phi  PeakCts   SNR AngSep     Name
#  [deg]    [deg]    ['] [deg]  [deg]                   [']
 15.4746 -11.1946    2.3  48.4   40.4   1.9938   5.0 ------	UNKNOWN
 85.6790 -16.0006    2.5  37.2  150.5   0.7519   4.7 ------	UNKNOWN
  2.0541 -61.6687    1.0  36.0  -38.2   1.6416  11.8 ------	UNKNOWN
 20.2433 -69.4912    2.1  31.3  -55.9   0.6827   5.4 ------	UNKNOWN
108.5020 -81.1551    2.1  40.8  -90.2   2.0789   5.6 ------	UNKNOWN
Post-slew image of 15-350 keV band
Time interval of the image:
414.812600 427.412600

# RAcent  DECcent POSerr Theta    Phi  PeakCts   SNR AngSep     Name
#  [deg]    [deg]    ['] [deg]  [deg]                   [']
188.2363  46.9224    2.8  33.1 -108.8   0.4412   4.1 ------	UNKNOWN
217.8339  51.7559    2.6  48.0 -129.0   1.2724   4.5 ------	UNKNOWN
Plot creation:
Sun Dec 13 19:50:45 EST 2015