Special notes of this burst
Image
Pre-slew 15.0-350.0 keV image (Event data)

#   RAcent    DECcent   POSerr    Theta     Phi              Peak Cts       SNR   Name
   41.1945   -43.4611   0.0218    21.7582   -24.8531         0.1334408      8.815 TRIG_00666378

Foreground time interval of the image:
 -0.220   1.316 (delta_t =   1.536 [sec])
Background time interval of the image:
-239.048  -0.220 (delta_t = 238.828 [sec])
Lightcurves
Notes:
- 1) The mask-weighted light curves are using the flight position.
- 2) Multiple plots of different time binning/intervals are shown to cover all scenarios of short/long GRBs, rate/image triggers, and real/false positives.
- 3) For all the mask-weighted lightcurves, the y-axis units are counts/sec/det where a det is 0.4 x 0.4 = 0.16 sq cm.
- 4) The verticle lines correspond to following: green dotted lines are T50 interval, black dotted lines are T90 interval, blue solid line(s) is a spacecraft slew start time, and orange solid line(s) is a spacecraft slew end time.
- 5) Time of each bin is in the middle of the bin.
1 s binning
From T0-310 s to T0+310 s

From T100_start - 20 s to T100_end + 30 s

Full time interval

64 ms binning
Full time interval

From T100_start to T100_end

From T0-5 sec to T0+5 sec

16 ms binning
From T100_start-5 s to T100_start+5 s

Blue+Cyan dotted lines: Time interval of the scaled map
From 0.000000 to 1.408000
8 ms binning
From T100_start-3 s to T100_start+3 s

Blue+Cyan dotted lines: Time interval of the scaled map
From 0.000000 to 1.408000
2 ms binning
From T100_start-1 s to T100_start+1 s

Blue+Cyan dotted lines: Time interval of the scaled map
From 0.000000 to 1.408000
SN=5 or 10 sec. binning (whichever binning is satisfied first)

SN=5 or 10 sec. binning (T < 200 sec)

Quad-rate summed light curves (from T0-300s to T0+1000s)

Spectral Evolution

Spectra
Notes:
- 1) The fitting includes the systematic errors.
- 2) When the burst includes telescope slew time periods, the fitting uses an average response file made from multiple 5-s response files through out the slew time plus single time preiod for the non-slew times, and weighted by the total counts in the corresponding time period using addrmf. An average response file is needed becuase a spectral fit using the pre-slew DRM will introduce some errors in both a spectral shape and a normalization if the PHA file contains a lot of the slew/post-slew time interval.
- 3) For fits to more complicated models (e.g. a power-law over a cutoff power-law), the BAT team has decided to require a chi-square improvement of more than 6 for each extra dof.
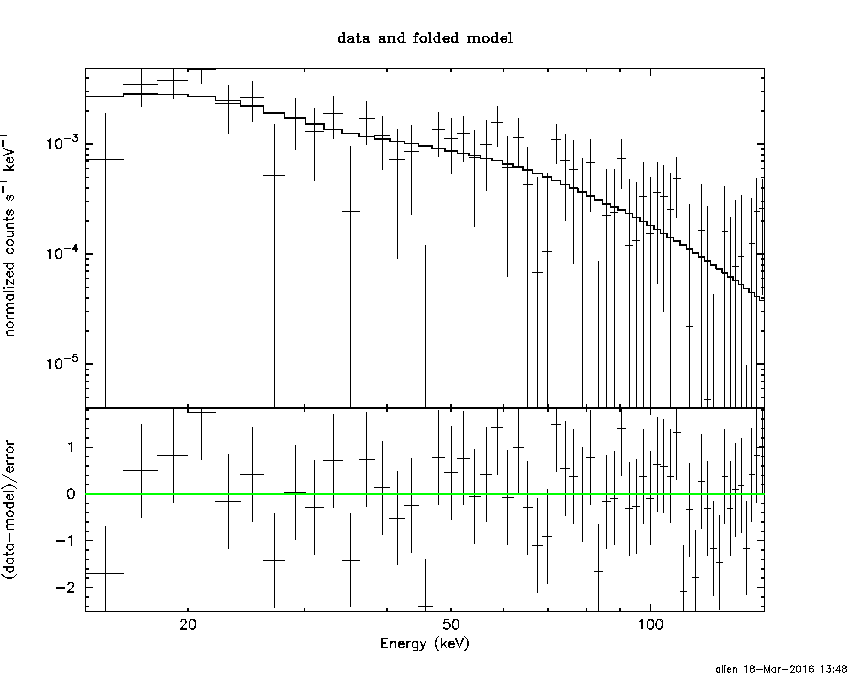
Time averaged spectrum fit using the average DRM
Power-law model

Time interval is from   -0.220 sec. to    1.316 sec.

Spectral model in power-law:
------------------------------------------------------------
Parameters  : value       lower 90%   higher 90%
Photon index: 1.60453     ( -0.307598   0.32219 )
Norm@50keV  : 5.58738E-03    ( -0.00109827   0.00106645 )
------------------------------------------------------------
#Fit statistic : Chi-Squared =          50.79 using 59 PHA bins.
# Reduced chi-squared =         0.8911 for     57 degrees of freedom
# Null hypothesis probability =   7.057520e-01

Photon flux (15-150 keV)    in 1.536 sec: 0.719039 ( -0.124216  0.124243 ) ph/cm2/s
Energy fluence (15-150 keV)             : 8.0229e-08 ( -1.67498e-08  1.72636e-08 ) ergs/cm2
Cutoff power-law model

Time interval is from   -0.220 sec. to    1.316 sec.
Spectral model in the cutoff power-law:
------------------------------------------------------------
Parameters  : value       lower 90%   higher 90%
Photon index: 1.39185     ( -1.2494   0.526329 )
Epeak [keV] : 132.033      ( -131.538 -131.538 )
Norm@50keV  : 7.28951E-03    (     )
------------------------------------------------------------
#Fit statistic : Chi-Squared =          50.67 using 59 PHA bins.
# Reduced chi-squared =         0.9048 for     56 degrees of freedom
# Null hypothesis probability =   6.761575e-01

Photon flux (15-150 keV)    in 1.536 sec: 0.713103 ( -0.127478  0.127289 ) ph/cm2/s
Energy fluence (15-150 keV)             : 7.85346e-08 ( -1.84199e-08  1.85033e-08 ) ergs/cm2
Band function

Time interval is from   -0.220 sec. to    1.316 sec.

Spectral model in the Band function:
------------------------------------------------------------
Parameters  : value       lower 90%   higher 90%
alpha       : 4.97525   ( -4.97525   -4.97525 )
beta        : -1.71403    ( -0.421324   0.34825 )
Epeak [keV] : 22.6887      ( -22.6887 6.01589 )
Norm@50keV   : 1181.72    ( -202.351   3.88408e+06 )
------------------------------------------------------------
#Fit statistic : Chi-Squared =          49.45 using 59 PHA bins.
# Reduced chi-squared =         0.8990 for     55 degrees of freedom
# Null hypothesis probability =   6.858864e-01

Photon flux (15-150 keV)    in 1.536 sec:  (    ) ph/cm2/s
Energy fluence (15-150 keV)             : 0 ( 0  0 ) ergs/cm2
Single BB

Spectral model blackbody:
------------------------------------------------------------
Parameters  : value    Lower 90%  Upper 90%
kT [keV]    : 13.6559  (-3.18865  3.98339)
R^2/D10^2   : 0.110210  (-0.0645486   0.170329)
(R is the radius in km and D10 is the distance to the source in units of 10 kpc)
------------------------------------------------------------
#Fit statistic : Chi-Squared =          60.71 using 59 PHA bins.
# Reduced chi-squared =          1.065 for     57 degrees of freedom
# Null hypothesis probability =   3.436943e-01

Energy  Fluence     90% Error
[keV]   [erg/cm2]   [erg/cm2]
15- 25  6.682e-09   2.152e-09
25- 50  2.424e-08   8.587e-09
50-150  2.937e-08   1.226e-08
15-150  6.029e-08   1.617e-08
Thermal bremsstrahlung (OTTB)

Spectral model: thermal bremsstrahlung
------------------------------------------------------------
Parameters  : value         Lower 90%    Upper 90%
kT [keV]    : 168.047       (-90.1436      -165.1)
Norm        : 2.93010       (-0.529649     0.678124)
------------------------------------------------------------
#Fit statistic : Chi-Squared =          50.72 using 59 PHA bins.
# Reduced chi-squared =         0.8898 for     57 degrees of freedom
# Null hypothesis probability =   7.082983e-01

Energy  Fluence     90% Error
[keV]   [erg/cm2]   [erg/cm2]
15- 25  1.144e-08   6.361e-09
25- 50  2.153e-08   1.205e-08
50-150  4.446e-08   2.584e-08
15-150  7.743e-08   4.362e-08
Double BB

Spectral model: bbodyrad<1> + bbodyrad<2>
------------------------------------------------------------
Parameters  : value         Lower 90%    Upper 90%
kT1 [keV]   : 5.01450        (-1.62767      3.02959)
R1^2/D10^2  : 2.77752        (-2.15324      12.0842)
kT2 [keV]   : 21.8802        (-6.15167      13.4811)
R2^2/D10^2  : 1.75832E-02    (-0.0140278   0.040256)
------------------------------------------------------------
#Fit statistic : Chi-Squared =          48.68 using 59 PHA bins.
# Reduced chi-squared =         0.8852 for     55 degrees of freedom
# Null hypothesis probability =   7.131446e-01

Energy  Fluence     90% Error
[keV]   [erg/cm2]   [erg/cm2]
15- 25  1.290e-08   7.410e-09
25- 50  1.955e-08   1.025e-08
50-150  4.550e-08   2.721e-08
15-150  7.795e-08   4.065e-08
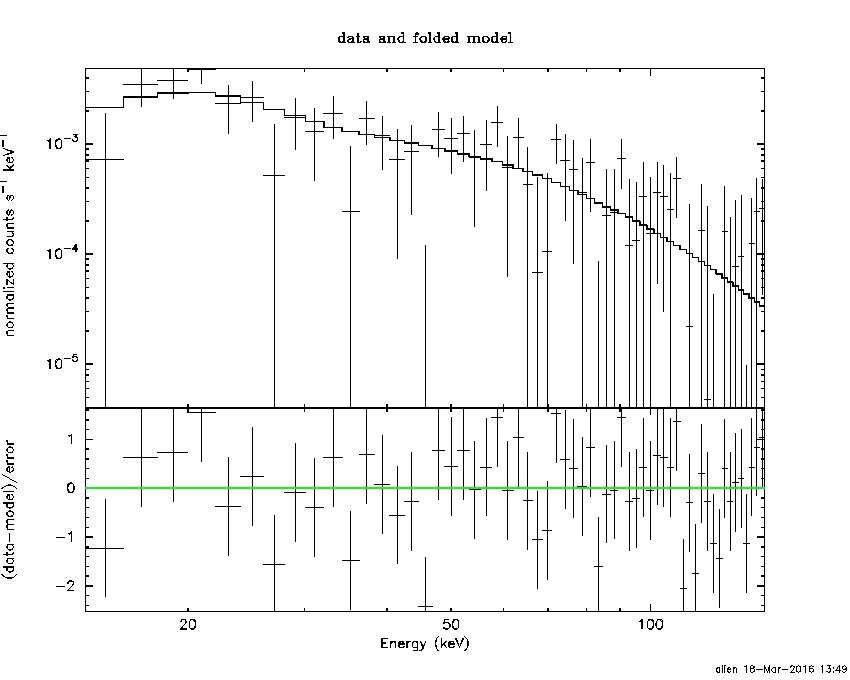
Peak spectrum fit
Power-law model

Time interval is from    0.112 sec. to    1.112 sec.

Spectral model in power-law:
------------------------------------------------------------
Parameters  : value       lower 90%   higher 90%
Photon index: 1.81695     ( -0.425919   0.470491 )
Norm@50keV  : 5.22253E-03    ( -0.00150886   0.00140391 )
------------------------------------------------------------
#Fit statistic : Chi-Squared =          51.12 using 59 PHA bins.
# Reduced chi-squared =         0.8968 for     57 degrees of freedom
# Null hypothesis probability =   6.943532e-01

Photon flux (15-150 keV)    in 1 sec: 0.724476 ( -0.154914  0.154917 ) ph/cm2/s
Energy fluence (15-150 keV)             : 4.80607e-08 ( -1.32847e-08  1.40233e-08 ) ergs/cm2
Cutoff power-law model

Time interval is from    0.112 sec. to    1.112 sec.
Spectral model in the cutoff power-law:
------------------------------------------------------------
Parameters  : value       lower 90%   higher 90%
Photon index: 1.83285     (     )
Epeak [keV] : 9999.36      (   )
Norm@50keV  : 5.18956E-03    (     )
------------------------------------------------------------
#Fit statistic : Chi-Squared =          51.12 using 59 PHA bins.
# Reduced chi-squared =         0.9129 for     56 degrees of freedom
# Null hypothesis probability =   6.596634e-01

Photon flux (15-150 keV)    in 1 sec: 0.551793 ( -0.222474  0.309474 ) ph/cm2/s
Energy fluence (15-150 keV)             : 4.24033e-08 ( -1.63298e-08  1.24812e-08 ) ergs/cm2
Band function

Time interval is from    0.112 sec. to    1.112 sec.

Spectral model in the Band function:
------------------------------------------------------------
Parameters  : value       lower 90%   higher 90%
alpha       : 4.98345   ( -4.98345   -4.98345 )
beta        : -1.92710    ( -0.661996   0.479531 )
Epeak [keV] : 20.5337      ( -20.5337 64.1848 )
Norm@50keV   : 2612.11    ( -555.116   6.83051e+06 )
------------------------------------------------------------
#Fit statistic : Chi-Squared =          50.41 using 59 PHA bins.
# Reduced chi-squared =         0.9166 for     55 degrees of freedom
# Null hypothesis probability =   6.503210e-01

Photon flux (15-150 keV)    in 1 sec:  (    ) ph/cm2/s
Energy fluence (15-150 keV)             : 0 ( 0  0 ) ergs/cm2
Single BB

Spectral model blackbody:
------------------------------------------------------------
Parameters  : value    Lower 90%  Upper 90%
kT [keV]    : 8.00442  (-2.6073  6.01888)
R^2/D10^2   : 0.729591  (-0.613553   2.71276)
(R is the radius in km and D10 is the distance to the source in units of 10 kpc)
------------------------------------------------------------
#Fit statistic : Chi-Squared =          62.50 using 59 PHA bins.
# Reduced chi-squared =          1.096 for     57 degrees of freedom
# Null hypothesis probability =   2.873314e-01

Energy  Fluence     90% Error
[keV]   [erg/cm2]   [erg/cm2]
15- 25  8.457e-09   4.522e-09
25- 50  1.482e-08   7.085e-09
50-150  3.897e-09   2.516e-09
15-150  2.717e-08   1.513e-08
Thermal bremsstrahlung (OTTB)

Spectral model: thermal bremsstrahlung
------------------------------------------------------------
Parameters  : value         Lower 90%    Upper 90%
kT [keV]    : 99.7535       (-58.1859      -99.9563)
Norm        : 3.17132       (-0.845525     1.38316)
------------------------------------------------------------
#Fit statistic : Chi-Squared =          52.57 using 59 PHA bins.
# Reduced chi-squared =         0.9223 for     57 degrees of freedom
# Null hypothesis probability =   6.416686e-01

Energy  Fluence     90% Error
[keV]   [erg/cm2]   [erg/cm2]
15- 25  8.289e-09   3.551e-09
25- 50  1.433e-08   6.514e-09
50-150  2.318e-08   1.707e-08
15-150  4.580e-08   2.332e-08
Double BB

Spectral model: bbodyrad<1> + bbodyrad<2>
------------------------------------------------------------
Parameters  : value         Lower 90%    Upper 90%
kT1 [keV]   : 4.94041        (-1.42114      2.0806)
R1^2/D10^2  : 4.18376        (-3.18345      13.1726)
kT2 [keV]   : 30.6106        (-13.6103      131.024)
R2^2/D10^2  : 5.36812E-03    (-0.0050207   0.0306771)
------------------------------------------------------------
#Fit statistic : Chi-Squared =          48.37 using 59 PHA bins.
# Reduced chi-squared =         0.8795 for     55 degrees of freedom
# Null hypothesis probability =   7.240943e-01

Energy  Fluence     90% Error
[keV]   [erg/cm2]   [erg/cm2]
15- 25  1.047e-08   5.910e-09
25- 50  1.098e-08   5.820e-09
50-150  3.197e-08   2.082e-08
15-150  5.342e-08   2.845e-08
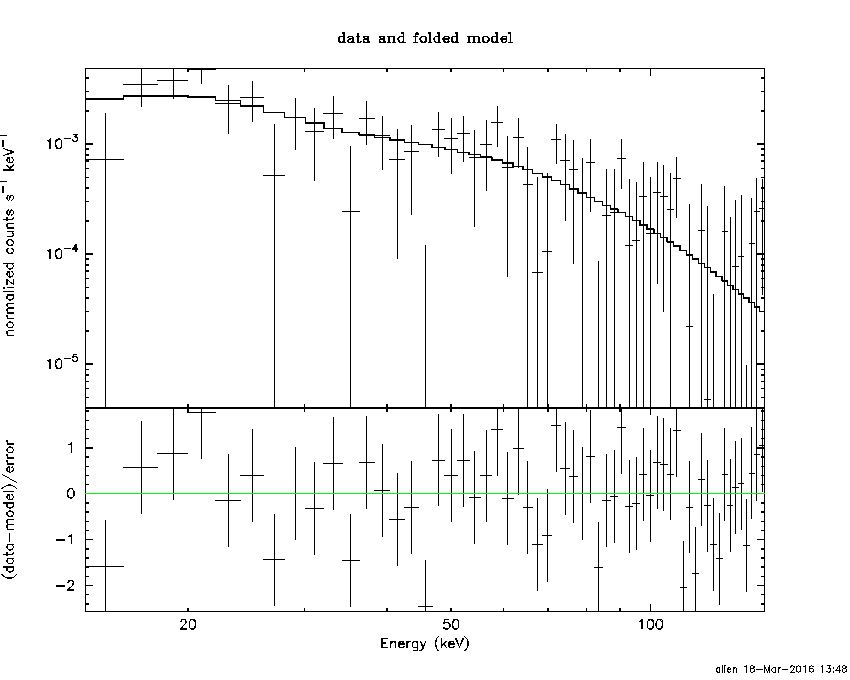
Pre-slew spectrum (Pre-slew PHA with pre-slew DRM)
Power-law model
Spectral model in power-law:
------------------------------------------------------------
Parameters  : value       lower 90%   higher 90%
Photon index: 1.60453     ( -0.307598   0.32219 )
Norm@50keV  : 5.58738E-03    ( -0.00109827   0.00106645 )
------------------------------------------------------------
#Fit statistic : Chi-Squared =          50.79 using 59 PHA bins.
# Reduced chi-squared =         0.8911 for     57 degrees of freedom
# Null hypothesis probability =   7.057520e-01

Photon flux (15-150 keV)    in 1.536 sec: 0.719015 ( -0.124211  0.124238 ) ph/cm2/s
Energy fluence (15-150 keV)             : 8.02181e-08 ( -1.67402e-08  1.72737e-08 ) ergs/cm2
Cutoff power-law model
Spectral model in the cutoff power-law:
------------------------------------------------------------
Parameters  : value       lower 90%   higher 90%
Photon index: 1.39048     ( -1.24948   0.526282 )
Epeak [keV] : 131.537      ( -131.533 -131.533 )
Norm@50keV  : 7.30179E-03    (     )
------------------------------------------------------------
#Fit statistic : Chi-Squared =          50.67 using 59 PHA bins.
# Reduced chi-squared =         0.9048 for     56 degrees of freedom
# Null hypothesis probability =   6.761575e-01

Photon flux (15-150 keV)    in 1.536 sec: 0.713000 ( -0.127448  0.127242 ) ph/cm2/s
Energy fluence (15-150 keV)             : 7.85638e-08 ( -1.83933e-08  1.85196e-08 ) ergs/cm2
Band function
Spectral model in the Band function:
------------------------------------------------------------
Parameters  : value       lower 90%   higher 90%
alpha       : 4.97525   ( -4.97525   -4.97525 )
beta        : -1.71403    ( -0.421324   0.34825 )
Epeak [keV] : 22.6887      ( -22.6887 6.01589 )
Norm@50keV   : 1181.72    ( -202.351   3.88408e+06 )
------------------------------------------------------------
#Fit statistic : Chi-Squared =          49.45 using 59 PHA bins.
# Reduced chi-squared =         0.8990 for     55 degrees of freedom
# Null hypothesis probability =   6.858864e-01

Photon flux (15-150 keV)    in 1.536 sec:  (    ) ph/cm2/s
Energy fluence (15-150 keV)             : 0 ( 0  0 ) ergs/cm2
S(25-50 keV) vs. S(50-100 keV) plot

S(25-50 keV)  = 2.09e-08
S(50-100 keV) = 2.73e-08
T90 vs. Hardness ratio plot

T90                                   = 1.43599992990494 sec.
Hardness ratio (energy fluence ratio) = 1.30622
Color vs. Color plot

Count Ratio  (25-50 keV) / (15-25 keV) = 0.905422
Count Ratio (50-100 keV) / (15-25 keV) = 0.926746
Mask shadow pattern

IMX = 3.621614184850643E-01, IMY = 1.677496858247010E-01
TIME vs. PHA plot around the trigger time

Blue+Cyan dotted lines: Time interval of the scaled map
From 0.000000 to 1.408000
TIME vs. DetID plot around the trigger time

Blue+Cyan dotted lines: Time interval of the scaled map
From 0.000000 to 1.408000
100 us light curve (15-350 keV)

Blue+Cyan dotted lines: Time interval of the scaled map
From 0.000000 to 1.408000
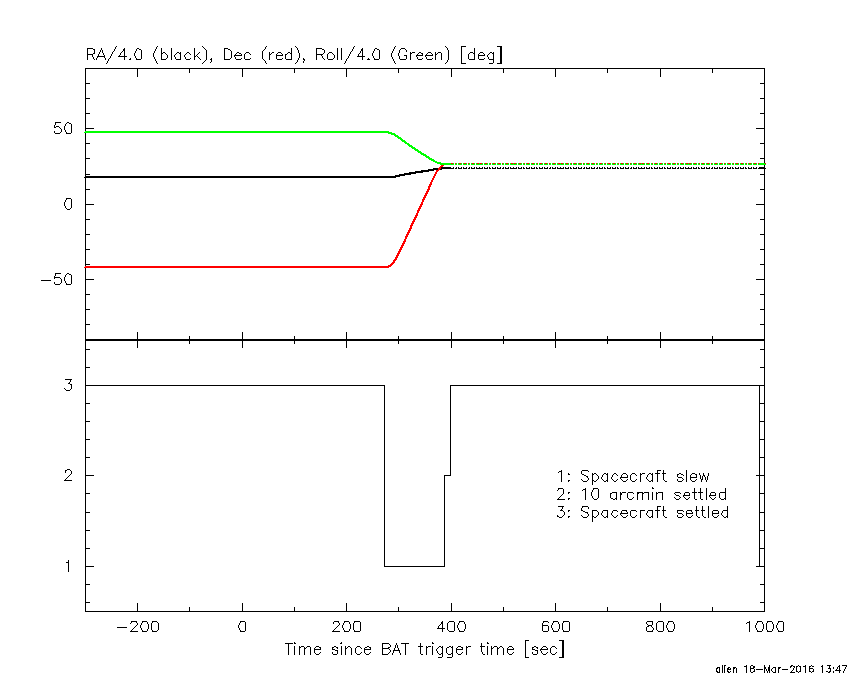
Spacecraft aspect plot
Bright source in the pre-burst/pre-slew/post-slew images
Pre-burst image of 15-350 keV band
Time interval of the image:
-239.048000 -0.220000

# RAcent  DECcent POSerr Theta    Phi  PeakCts   SNR AngSep     Name
#  [deg]    [deg]    ['] [deg]  [deg]                   [']
135.6095 -40.6382    3.2  47.5 -169.1   1.6469   3.6    6.2	Vela X-1
 68.9732  -2.5480    2.1  39.3   76.5   4.9731   5.5 ------	UNKNOWN
103.6878 -32.2672    3.0  27.7  160.0   1.0199   3.8 ------	UNKNOWN
136.1720 -27.7063    3.2  54.2  176.5   2.9230   3.6 ------	UNKNOWN
  2.8813 -28.8823    3.2  55.5  -20.4   2.8722   3.7 ------	UNKNOWN
356.5996 -48.2141    4.8  50.8  -44.7   3.4605   2.4 ------	UNKNOWN
Pre-slew background subtracted image of 15-350 keV band
Time interval of the image:
-0.220000 1.316000

# RAcent  DECcent POSerr Theta    Phi  PeakCts   SNR AngSep     Name
#  [deg]    [deg]    ['] [deg]  [deg]                   [']
135.4479 -40.7403   21.6  47.4 -169.0  -0.0167  -0.5   11.7	Vela X-1
105.7352 -23.0831    2.6  34.5  147.6   0.1037   4.4 ------	UNKNOWN
 41.1945 -43.4611    1.3  21.8  -24.9   0.1335   8.8 ------	UNKNOWN
Post-slew image of 15-350 keV band
Time interval of the image:
388.252600 963.043200

# RAcent  DECcent POSerr Theta    Phi  PeakCts   SNR AngSep     Name
#  [deg]    [deg]    ['] [deg]  [deg]                   [']
 83.6277  22.0154    0.2  11.5   53.1  23.9116  51.8    0.3	Crab
102.6101  55.1267    2.7  29.0  173.3   2.2446   4.3 ------	UNKNOWN
 96.2805  29.3254    3.1   2.8 -175.7   1.6587   3.7 ------	UNKNOWN
130.4894  66.2763    2.8  45.2 -176.4   3.4546   4.2 ------	UNKNOWN
 95.9044 -26.3049    3.1  53.0  -16.3   4.7511   3.7 ------	UNKNOWN
116.9470  20.9473    3.4  20.7  -94.1   1.7670   3.4 ------	UNKNOWN
 96.7245 -32.9141    3.0  59.6  -17.0  11.3294   3.9 ------	UNKNOWN
158.5695  44.1392    3.0  53.1 -142.2  12.8093   3.9 ------	UNKNOWN
118.5550 -18.7702    3.5  50.8  -44.5   9.1636   3.3 ------	UNKNOWN
141.8523  22.0630    3.2  42.5 -109.8   8.6472   3.6 ------	UNKNOWN
Plot creation:
Fri Mar 18 13:49:48 EDT 2016