Special notes of this burst
Image
Pre-slew 15.0-350.0 keV image (Event data)

#   RAcent    DECcent   POSerr    Theta     Phi              Peak Cts       SNR   Name
  214.0198   -17.6664   0.0145    14.2243  -167.1569         0.1175101     13.320 TRIG_00668543

Foreground time interval of the image:
 -0.036   0.276 (delta_t =   0.312 [sec])
Background time interval of the image:
-67.499  -0.036 (delta_t =  67.463 [sec])
Lightcurves
Notes:
- 1) The mask-weighted light curves are using the flight position.
- 2) Multiple plots of different time binning/intervals are shown to cover all scenarios of short/long GRBs, rate/image triggers, and real/false positives.
- 3) For all the mask-weighted lightcurves, the y-axis units are counts/sec/det where a det is 0.4 x 0.4 = 0.16 sq cm.
- 4) The verticle lines correspond to following: green dotted lines are T50 interval, black dotted lines are T90 interval, blue solid line(s) is a spacecraft slew start time, and orange solid line(s) is a spacecraft slew end time.
- 5) Time of each bin is in the middle of the bin.
1 s binning
From T0-310 s to T0+310 s

From T100_start - 20 s to T100_end + 30 s

Full time interval

64 ms binning
Full time interval

From T100_start to T100_end

From T0-5 sec to T0+5 sec

16 ms binning
From T100_start-5 s to T100_start+5 s

Blue+Cyan dotted lines: Time interval of the scaled map
From 0.000000 to 0.256000
8 ms binning
From T100_start-3 s to T100_start+3 s

Blue+Cyan dotted lines: Time interval of the scaled map
From 0.000000 to 0.256000
2 ms binning
From T100_start-1 s to T100_start+1 s

Blue+Cyan dotted lines: Time interval of the scaled map
From 0.000000 to 0.256000
SN=5 or 10 sec. binning (whichever binning is satisfied first)

SN=5 or 10 sec. binning (T < 200 sec)

Quad-rate summed light curves (from T0-300s to T0+1000s)

Spectral Evolution

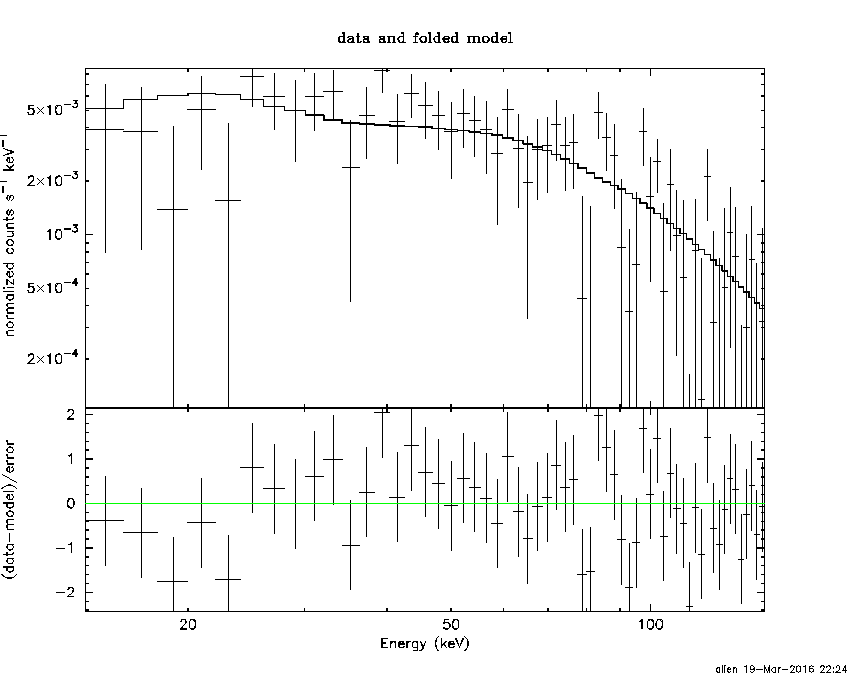
Spectra
Notes:
- 1) The fitting includes the systematic errors.
- 2) When the burst includes telescope slew time periods, the fitting uses an average response file made from multiple 5-s response files through out the slew time plus single time preiod for the non-slew times, and weighted by the total counts in the corresponding time period using addrmf. An average response file is needed becuase a spectral fit using the pre-slew DRM will introduce some errors in both a spectral shape and a normalization if the PHA file contains a lot of the slew/post-slew time interval.
- 3) For fits to more complicated models (e.g. a power-law over a cutoff power-law), the BAT team has decided to require a chi-square improvement of more than 6 for each extra dof.
Time averaged spectrum fit using the average DRM
Power-law model

Time interval is from   -0.036 sec. to    0.276 sec.

Spectral model in power-law:
------------------------------------------------------------
Parameters  : value       lower 90%   higher 90%
Photon index: 0.824371     ( -0.203026   0.196566 )
Norm@50keV  : 2.31150E-02    ( -0.00284636   0.00283681 )
------------------------------------------------------------
#Fit statistic : Chi-Squared =          54.96 using 59 PHA bins.
# Reduced chi-squared =         0.9642 for     57 degrees of freedom
# Null hypothesis probability =   5.519268e-01

Photon flux (15-150 keV)    in 0.312 sec: 2.65468 ( -0.32399  0.3243 ) ph/cm2/s
Energy fluence (15-150 keV)             : 8.34363e-08 ( -1.11935e-08  1.12931e-08 ) ergs/cm2
Cutoff power-law model

Time interval is from   -0.036 sec. to    0.276 sec.
Spectral model in the cutoff power-law:
------------------------------------------------------------
Parameters  : value       lower 90%   higher 90%
Photon index: -0.583979     ( -1.23273   0.968552 )
Epeak [keV] : 101.966      ( -25.0876 99.3817 )
Norm@50keV  : 0.101308    ( -0.0637016   0.250547 )
------------------------------------------------------------
#Fit statistic : Chi-Squared =          48.27 using 59 PHA bins.
# Reduced chi-squared =         0.8619 for     56 degrees of freedom
# Null hypothesis probability =   7.591867e-01

Photon flux (15-150 keV)    in 0.312 sec: 2.53317 ( -0.33594  0.33578 ) ph/cm2/s
Energy fluence (15-150 keV)             : 7.65729e-08 ( -1.26091e-08  1.26085e-08 ) ergs/cm2
Band function

Time interval is from   -0.036 sec. to    0.276 sec.

Spectral model in the Band function:
------------------------------------------------------------
Parameters  : value       lower 90%   higher 90%
alpha       : 4.99999   ( -5.0229e-05   -4.99999 )
beta        : -1.33626    ( -0.518707   0.339035 )
Epeak [keV] : 46.9547      ( -10.4656 7.98883 )
Norm@50keV   : 45.7123    ( -5.4008   132.179 )
------------------------------------------------------------
#Fit statistic : Chi-Squared =          46.28 using 59 PHA bins.
# Reduced chi-squared =         0.8414 for     55 degrees of freedom
# Null hypothesis probability =   7.926765e-01

Photon flux (15-150 keV)    in 0.312 sec:  (    ) ph/cm2/s
Energy fluence (15-150 keV)             : 0 ( 0  0 ) ergs/cm2
Single BB

Spectral model blackbody:
------------------------------------------------------------
Parameters  : value    Lower 90%  Upper 90%
kT [keV]    : 21.9507  (-3.03941  3.80623)
R^2/D10^2   : 0.102607  (-0.0395901   0.0599057)
(R is the radius in km and D10 is the distance to the source in units of 10 kpc)
------------------------------------------------------------
#Fit statistic : Chi-Squared =          49.79 using 59 PHA bins.
# Reduced chi-squared =         0.8736 for     57 degrees of freedom
# Null hypothesis probability =   7.397560e-01

Energy  Fluence     90% Error
[keV]   [erg/cm2]   [erg/cm2]
15- 25  2.858e-09   6.831e-10
25- 50  1.509e-08   2.613e-09
50-150  5.432e-08   1.225e-08
15-150  7.227e-08   1.285e-08
Thermal bremsstrahlung (OTTB)

Spectral model: thermal bremsstrahlung
------------------------------------------------------------
Parameters  : value         Lower 90%    Upper 90%
kT [keV]    : 200.000       (-23.7947      -200)
Norm        : 9.89150       (-1.3107     1.3107)
------------------------------------------------------------
#Fit statistic : Chi-Squared =          85.91 using 59 PHA bins.
# Reduced chi-squared =          1.507 for     57 degrees of freedom
# Null hypothesis probability =   7.960060e-03

Energy  Fluence     90% Error
[keV]   [erg/cm2]   [erg/cm2]
15- 25  7.685e-09   4.343e-09
25- 50  1.478e-08   8.318e-09
50-150  3.242e-08   1.810e-08
15-150  5.489e-08   3.083e-08
Double BB

------------------------------------------------------------
Parameters  : value         Lower 90%    Upper 90%
kT1 [keV]   : 44.7857        (-45.3042      -45.3042)
R1^2/D10^2  : 6.83720E-03        (-0.00637631      0.113829)
kT2 [keV]   : 15.3733        (-15.5008      -15.5008)
R2^2/D10^2  : 0.195159    (-0.193487   -0.193487)
------------------------------------------------------------
#Fit statistic : Chi-Squared =          47.41 using 59 PHA bins.
#Fit statistic : Chi-Squared =          47.39 using 59 PHA bins.
# Reduced chi-squared =         0.8620 for     55 degrees of freedom
# Reduced chi-squared =         0.8617 for     55 degrees of freedom
# Null hypothesis probability =   7.565557e-01
# Null hypothesis probability =   7.572784e-01

Energy  Fluence     90% Error
[keV]   [erg/cm2]   [erg/cm2]
15- 25  3.526e-09   2.206e-09
25- 50  1.573e-08   1.066e-08
50-150  5.875e-08   3.677e-08
15-150  7.801e-08   6.572e-08
Peak spectrum fit
Power-law model

Time interval is from   -0.378 sec. to    0.622 sec.

Spectral model in power-law:
------------------------------------------------------------
Parameters  : value       lower 90%   higher 90%
Photon index: 0.927100     ( -0.322195   0.303625 )
Norm@50keV  : 7.30736E-03    ( -0.00132434   0.0013133 )
------------------------------------------------------------
#Fit statistic : Chi-Squared =          58.09 using 59 PHA bins.
# Reduced chi-squared =          1.019 for     57 degrees of freedom
# Null hypothesis probability =   4.348806e-01

Photon flux (15-150 keV)    in 1 sec: 0.839045 ( -0.152114  0.152736 ) ph/cm2/s
Energy fluence (15-150 keV)             : 8.1169e-08 ( -1.55409e-08  1.57012e-08 ) ergs/cm2
Cutoff power-law model

Time interval is from   -0.378 sec. to    0.622 sec.
Spectral model in the cutoff power-law:
------------------------------------------------------------
Parameters  : value       lower 90%   higher 90%
Photon index: 0.322614     ( -1.50958   0.848305 )
Epeak [keV] : 159.557      ( -159.558 -159.558 )
Norm@50keV  : 1.35369E-02    ( -0.00727411   0.0430815 )
------------------------------------------------------------
#Fit statistic : Chi-Squared =          57.34 using 59 PHA bins.
# Reduced chi-squared =          1.024 for     56 degrees of freedom
# Null hypothesis probability =   4.251674e-01

Photon flux (15-150 keV)    in 1 sec: 0.818779 ( -0.157238  0.1577 ) ph/cm2/s
Energy fluence (15-150 keV)             : 7.86466e-08 ( -1.67182e-08  1.65848e-08 ) ergs/cm2
Band function

Time interval is from   -0.378 sec. to    0.622 sec.

Spectral model in the Band function:
------------------------------------------------------------
Parameters  : value       lower 90%   higher 90%
alpha       : -0.319568   ( 0.571831   1.59004 )
beta        : -10.0000    ( 10   10 )
Epeak [keV] : 159.724      ( -61.9125 194.491 )
Norm@50keV   : 1.35514E-02    ( -0.00727438   0.0431835 )
------------------------------------------------------------
#Fit statistic : Chi-Squared =          57.34 using 59 PHA bins.
# Reduced chi-squared =          1.043 for     55 degrees of freedom
# Null hypothesis probability =   3.883635e-01

Photon flux (15-150 keV)    in 1 sec:  (    ) ph/cm2/s
Energy fluence (15-150 keV)             : 0 ( 0  0 ) ergs/cm2
Single BB

Spectral model blackbody:
------------------------------------------------------------
Parameters  : value    Lower 90%  Upper 90%
kT [keV]    : 23.0472  (-4.96033  7.05738)
R^2/D10^2   : 2.65581E-02  (-0.0147598   0.0301615)
(R is the radius in km and D10 is the distance to the source in units of 10 kpc)
------------------------------------------------------------
#Fit statistic : Chi-Squared =          60.62 using 59 PHA bins.
# Reduced chi-squared =          1.064 for     57 degrees of freedom
# Null hypothesis probability =   3.465991e-01

Energy  Fluence     90% Error
[keV]   [erg/cm2]   [erg/cm2]
15- 25  2.554e-09   1.093e-09
25- 50  1.387e-08   4.612e-09
50-150  5.504e-08   1.820e-08
15-150  7.146e-08   2.562e-08
Thermal bremsstrahlung (OTTB)

Spectral model: thermal bremsstrahlung
------------------------------------------------------------
Parameters  : value         Lower 90%    Upper 90%
kT [keV]    : 200.000       (-47.5863      -200)
Norm        : 3.36055       (-0.631339     0.631339)
------------------------------------------------------------
#Fit statistic : Chi-Squared =          68.62 using 59 PHA bins.
# Reduced chi-squared =          1.204 for     57 degrees of freedom
# Null hypothesis probability =   1.393679e-01

Energy  Fluence     90% Error
[keV]   [erg/cm2]   [erg/cm2]
15- 25  8.367e-09   4.848e-09
25- 50  1.610e-08   9.380e-09
50-150  3.530e-08   2.032e-08
15-150  5.976e-08   3.491e-08
Double BB

Spectral model: bbodyrad<1> + bbodyrad<2>
------------------------------------------------------------
Parameters  : value         Lower 90%    Upper 90%
kT1 [keV]   : 9.09915        (-4.94668      -9.12233)
R1^2/D10^2  : 0.229498        (-0.196721      2.17741)
kT2 [keV]   : 34.2602        (-32.3434      -34.3304)
R2^2/D10^2  : 6.65912E-03    (-0.00599473   0.0135683)
------------------------------------------------------------
#Fit statistic : Chi-Squared =          56.52 using 59 PHA bins.
# Reduced chi-squared =          1.028 for     55 degrees of freedom
# Null hypothesis probability =   4.178253e-01

Energy  Fluence     90% Error
[keV]   [erg/cm2]   [erg/cm2]
15- 25  4.843e-09   2.880e-09
25- 50  1.533e-08   8.255e-09
50-150  5.985e-08   3.185e-08
15-150  8.003e-08   3.941e-08
Pre-slew spectrum (Pre-slew PHA with pre-slew DRM)
Power-law model
Spectral model in power-law:
------------------------------------------------------------
Parameters  : value       lower 90%   higher 90%
Photon index: 0.824371     ( -0.203026   0.196566 )
Norm@50keV  : 2.31150E-02    ( -0.00284636   0.00283681 )
------------------------------------------------------------
#Fit statistic : Chi-Squared =          54.96 using 59 PHA bins.
# Reduced chi-squared =         0.9642 for     57 degrees of freedom
# Null hypothesis probability =   5.519268e-01

Photon flux (15-150 keV)    in 0.312 sec: 2.65471 ( -0.32399  0.324301 ) ph/cm2/s
Energy fluence (15-150 keV)             : 8.34254e-08 ( -1.11876e-08  1.12996e-08 ) ergs/cm2
Cutoff power-law model

Spectral model in the cutoff power-law:
------------------------------------------------------------
Parameters  : value       lower 90%   higher 90%
Photon index: -0.584016     ( -1.23273   0.968556 )
Epeak [keV] : 101.965      ( -25.0874 99.3819 )
Norm@50keV  : 0.101312    ( -0.0637021   0.250547 )
------------------------------------------------------------
#Fit statistic : Chi-Squared =          48.27 using 59 PHA bins.
# Reduced chi-squared =         0.8619 for     56 degrees of freedom
# Null hypothesis probability =   7.591867e-01

Photon flux (15-150 keV)    in 0.312 sec: 2.53317 ( -0.33594  0.33578 ) ph/cm2/s
Energy fluence (15-150 keV)             : 7.66094e-08 ( -1.26132e-08  1.26238e-08 ) ergs/cm2
Band function

Spectral model in the Band function:
------------------------------------------------------------
Parameters  : value       lower 90%   higher 90%
alpha       : 4.99999   ( -14.9998   -4.99999 )
beta        : -1.33626    ( -0.518707   0.339035 )
Epeak [keV] : 46.9547      ( -10.4656 7.98883 )
Norm@50keV   : 45.7123    ( -5.4008   132.179 )
------------------------------------------------------------
#Fit statistic : Chi-Squared =          46.28 using 59 PHA bins.
# Reduced chi-squared =         0.8414 for     55 degrees of freedom
# Null hypothesis probability =   7.926765e-01

Photon flux (15-150 keV)    in 0.312 sec:  (    ) ph/cm2/s
Energy fluence (15-150 keV)             : 0 ( 0  0 ) ergs/cm2
S(25-50 keV) vs. S(50-100 keV) plot

S(25-50 keV)  = 1.37e-08
S(50-100 keV) = 3.09e-08
T90 vs. Hardness ratio plot

T90                                   = 0.275999963283539 sec.
Hardness ratio (energy fluence ratio) = 2.25547
Color vs. Color plot

Count Ratio  (25-50 keV) / (15-25 keV) = 3.28897
Count Ratio (50-100 keV) / (15-25 keV) = 3.52619
Mask shadow pattern

IMX = -2.471490745748556E-01, IMY = 5.634636703088051E-02
TIME vs. PHA plot around the trigger time

Blue+Cyan dotted lines: Time interval of the scaled map
From 0.000000 to 0.256000
TIME vs. DetID plot around the trigger time

Blue+Cyan dotted lines: Time interval of the scaled map
From 0.000000 to 0.256000
100 us light curve (15-350 keV)

Blue+Cyan dotted lines: Time interval of the scaled map
From 0.000000 to 0.256000
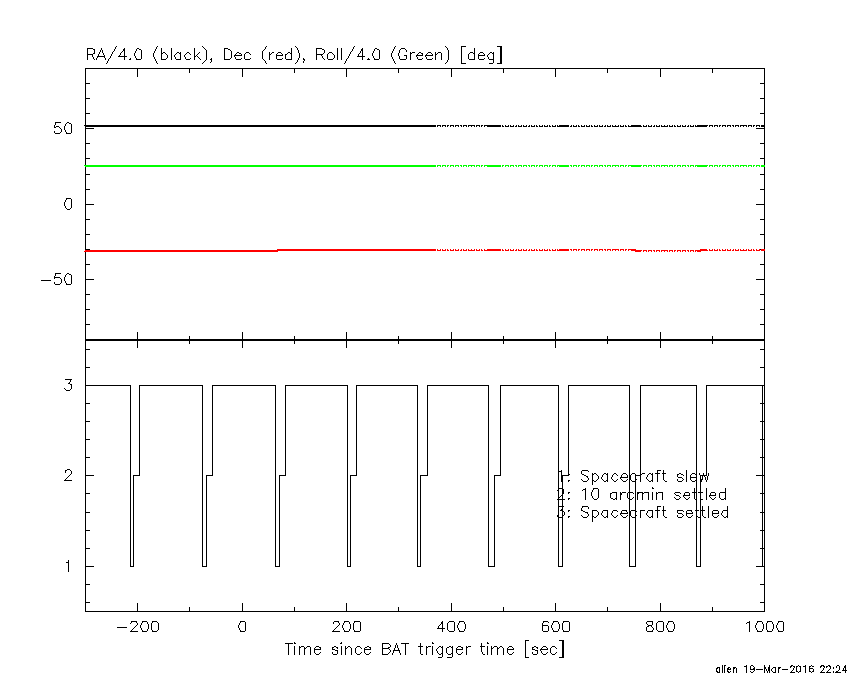
Spacecraft aspect plot
Bright source in the pre-burst/pre-slew/post-slew images
Pre-burst image of 15-350 keV band
Time interval of the image:
-67.499400 -0.036000

# RAcent  DECcent POSerr Theta    Phi  PeakCts   SNR AngSep     Name
#  [deg]    [deg]    ['] [deg]  [deg]                   [']
170.3029 -60.6036    2.7  38.8   17.4   0.7207   4.3    1.2	Cen X-3
186.6402 -62.7296    3.6  34.8    5.8   0.4339   3.2    2.5	GX 301-2
244.9837 -15.6536    1.1  37.0 -116.8   2.1989  11.0    0.8	Sco X-1
255.9403 -37.8528    2.8  39.8  -77.6   1.6206   4.1    2.3	4U 1700-377
256.4871 -36.4958   64.3  40.4  -79.7   0.0728   0.2    5.0	GX 349+2
127.5362 -84.6796    2.7  58.5   -5.1   2.8525   4.3 ------	UNKNOWN
245.4680  -7.6297    2.5  42.0 -126.8   1.1349   4.6 ------	UNKNOWN
Pre-slew background subtracted image of 15-350 keV band
Time interval of the image:
-0.036000 0.276000

# RAcent  DECcent POSerr Theta    Phi  PeakCts   SNR AngSep     Name
#  [deg]    [deg]    ['] [deg]  [deg]                   [']
170.3492 -60.8083    6.5  38.9   17.1   0.0253   1.8   11.2	Cen X-3
186.3370 -62.7874   13.1  34.9    5.9   0.0103   0.9    8.8	GX 301-2
245.0687 -15.5783    9.5  37.1 -116.9   0.0222   1.2    6.4	Sco X-1
255.9342 -37.7347    7.6  39.8  -77.8   0.0525   1.5    7.0	4U 1700-377
256.4194 -36.5033    7.5  40.3  -79.7  -0.0586  -1.5    4.9	GX 349+2
213.0662  11.1716    2.3  42.2  176.2   0.0752   4.9 ------	UNKNOWN
214.0198 -17.6664    0.9  14.2 -167.2   0.1175  13.3 ------	UNKNOWN
232.9542   7.5313    2.2  45.2 -155.1   0.0828   5.3 ------	UNKNOWN
Post-slew image of 15-350 keV band
Time interval of the image:
71.700600 201.100600

# RAcent  DECcent POSerr Theta    Phi  PeakCts   SNR AngSep     Name
#  [deg]    [deg]    ['] [deg]  [deg]                   [']
170.4564 -60.6016    3.6  39.1   16.8   0.7298   3.2    4.3	Cen X-3
186.5787 -62.7509    1.9  35.2    5.3   1.1885   6.0    2.4	GX 301-2
244.9642 -15.6200    0.7  37.2 -115.8   4.5009  15.8    1.5	Sco X-1
255.9791 -37.8289    1.5  40.4  -76.9   4.5343   7.8    1.0	4U 1700-377
256.4380 -36.3765    4.1  40.9  -79.1   1.8266   2.9    2.8	GX 349+2
201.5287  12.8337    2.7  43.4  160.2   1.4430   4.3 ------	UNKNOWN
155.2941 -82.7835    2.7  55.6   -4.3   2.3078   4.3 ------	UNKNOWN
241.9469 -56.8839    2.5  35.8  -43.0   1.0169   4.6 ------	UNKNOWN
Plot creation:
Sat Mar 19 22:25:28 EDT 2016