Special notes of this burst
Image
Pre-slew 15.0-350.0 keV image (Event data)
#   RAcent    DECcent   POSerr    Theta     Phi              Peak Cts       SNR   Name
  344.4256     8.0869   0.0054     1.5943   -86.0699         2.4307202     35.617 TRIG_00668641

Foreground time interval of the image:
-15.560  12.741 (delta_t =  28.301 [sec])
Background time interval of the image:
-239.560 -15.560 (delta_t = 224.000 [sec])
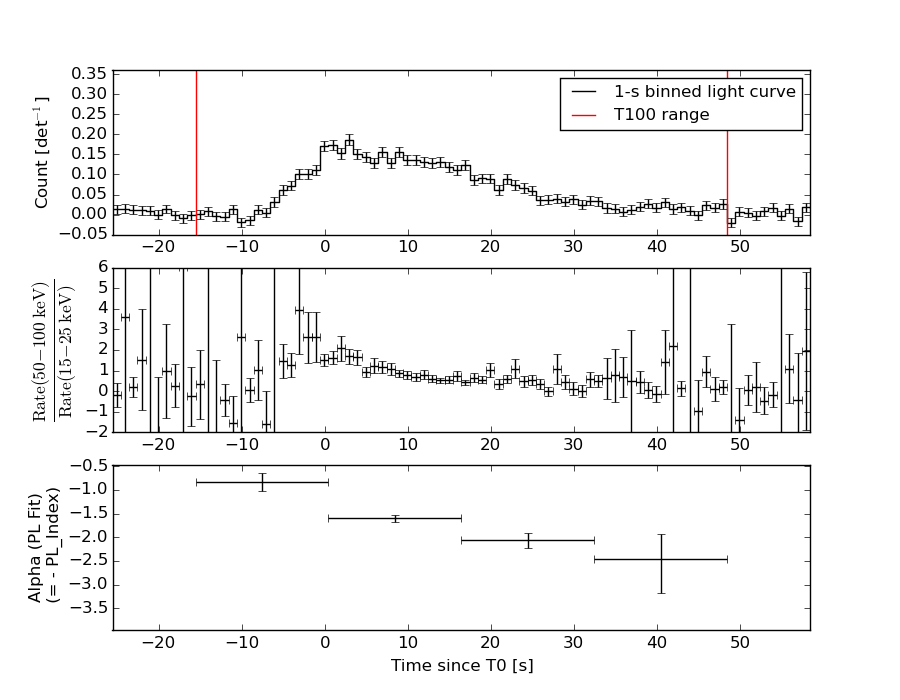
Lightcurves
Notes:
- 1) The mask-weighted light curves are using the flight position.
- 2) Multiple plots of different time binning/intervals are shown to cover all scenarios of short/long GRBs, rate/image triggers, and real/false positives.
- 3) For all the mask-weighted lightcurves, the y-axis units are counts/sec/det where a det is 0.4 x 0.4 = 0.16 sq cm.
- 4) The verticle lines correspond to following: green dotted lines are T50 interval, black dotted lines are T90 interval, blue solid line(s) is a spacecraft slew start time, and orange solid line(s) is a spacecraft slew end time.
- 5) Time of each bin is in the middle of the bin.
1 s binning
From T0-310 s to T0+310 s

From T100_start - 20 s to T100_end + 30 s

Full time interval
64 ms binning
Full time interval
From T100_start to T100_end
From T0-5 sec to T0+5 sec

16 ms binning
From T100_start-5 s to T100_start+5 s
Blue+Cyan dotted lines: Time interval of the scaled map
From 0.000000 to 1.024000
8 ms binning
From T100_start-3 s to T100_start+3 s

Blue+Cyan dotted lines: Time interval of the scaled map
From 0.000000 to 1.024000
2 ms binning
From T100_start-1 s to T100_start+1 s
Blue+Cyan dotted lines: Time interval of the scaled map
From 0.000000 to 1.024000
SN=5 or 10 sec. binning (whichever binning is satisfied first)
SN=5 or 10 sec. binning (T < 200 sec)
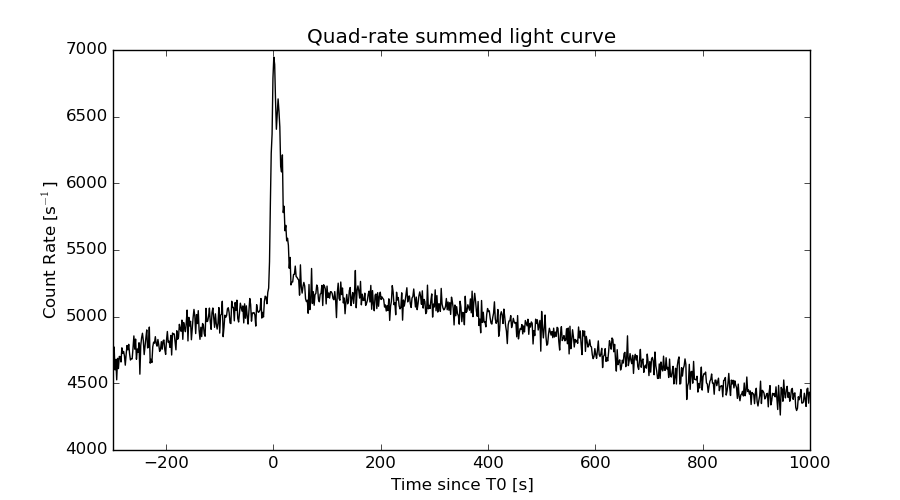
Quad-rate summed light curves (from T0-300s to T0+1000s)
Spectral Evolution
Spectra
Notes:
- 1) The fitting includes the systematic errors.
- 2) When the burst includes telescope slew time periods, the fitting uses an average response file made from multiple 5-s response files through out the slew time plus single time preiod for the non-slew times, and weighted by the total counts in the corresponding time period using addrmf. An average response file is needed becuase a spectral fit using the pre-slew DRM will introduce some errors in both a spectral shape and a normalization if the PHA file contains a lot of the slew/post-slew time interval.
- 3) For fits to more complicated models (e.g. a power-law over a cutoff power-law), the BAT team has decided to require a chi-square improvement of more than 6 for each extra dof.
Time averaged spectrum fit using the average DRM
Power-law model

Time interval is from  -15.560 sec. to   48.440 sec.

Spectral model in power-law:
------------------------------------------------------------
Parameters  : value       lower 90%   higher 90%
Photon index: 1.63856     ( -0.0726004   0.073149 )
Norm@50keV  : 4.09069E-03    ( -0.000168469   0.000167933 )
------------------------------------------------------------
#Fit statistic : Chi-Squared =          62.70 using 59 PHA bins.
# Reduced chi-squared =          1.100 for     57 degrees of freedom
# Null hypothesis probability =   2.811764e-01

Photon flux (15-150 keV)    in 64 sec: 0.532166 ( -0.021703  0.021737 ) ph/cm2/s
Energy fluence (15-150 keV)             : 2.43809e-06 ( -1.07052e-07  1.07565e-07 ) ergs/cm2
Cutoff power-law model

Time interval is from  -15.560 sec. to   48.440 sec.
Spectral model in the cutoff power-law:
------------------------------------------------------------
Parameters  : value       lower 90%   higher 90%
Photon index: 1.10105     ( -0.327265   0.304657 )
Epeak [keV] : 81.9709      ( -14.5737 43.0021 )
Norm@50keV  : 7.65284E-03    ( -0.00224014   0.00346824 )
------------------------------------------------------------
#Fit statistic : Chi-Squared =          53.17 using 59 PHA bins.
# Reduced chi-squared =         0.9494 for     56 degrees of freedom
# Null hypothesis probability =   5.828383e-01

Photon flux (15-150 keV)    in 64 sec: 0.514680 ( -0.023643  0.023691 ) ph/cm2/s
Energy fluence (15-150 keV)             : 2.32327e-06 ( -1.2374e-07  1.24383e-07 ) ergs/cm2
Band function

Time interval is from  -15.560 sec. to   48.440 sec.

Spectral model in the Band function:
------------------------------------------------------------
Parameters  : value       lower 90%   higher 90%
alpha       : -1.08173   ( -0.31638   0.45393 )
beta        : -2.32044    ( 2.32067   0.533157 )
Epeak [keV] : 80.1930      ( -25.0952 43.0098 )
Norm@50keV   : 7.84930E-03    ( -0.00239125   0.0069498 )
------------------------------------------------------------
#Fit statistic : Chi-Squared =          53.07 using 59 PHA bins.
# Reduced chi-squared =         0.9649 for     55 degrees of freedom
# Null hypothesis probability =   5.486459e-01

Photon flux (15-150 keV)    in 64 sec:  (    ) ph/cm2/s
Energy fluence (15-150 keV)             : 0 ( 0  0 ) ergs/cm2
Single BB

Spectral model blackbody:
------------------------------------------------------------
Parameters  : value    Lower 90%  Upper 90%
kT [keV]    : 13.9386  (  )
R^2/D10^2   : 7.44038E-02  (   )
(R is the radius in km and D10 is the distance to the source in units of 10 kpc)
------------------------------------------------------------
#Fit statistic : Chi-Squared =         158.41 using 59 PHA bins.
# Reduced chi-squared =         2.7792 for     57 degrees of freedom
# Null hypothesis probability =   1.734319e-11

Energy  Fluence     90% Error
[keV]   [erg/cm2]   [erg/cm2]
15- 25  1.955e-07   1.450e-08
25- 50  7.240e-07   3.552e-08
50-150  9.240e-07   8.128e-08
15-150  1.844e-06   8.512e-08
Thermal bremsstrahlung (OTTB)

Spectral model: thermal bremsstrahlung
------------------------------------------------------------
Parameters  : value         Lower 90%    Upper 90%
kT [keV]    : 158.516       (-30.8598      36.7146)
Norm        : 2.16872       (-0.0968334     0.117287)
------------------------------------------------------------
#Fit statistic : Chi-Squared =          54.10 using 59 PHA bins.
# Reduced chi-squared =         0.9491 for     57 degrees of freedom
# Null hypothesis probability =   5.846491e-01

Energy  Fluence     90% Error
[keV]   [erg/cm2]   [erg/cm2]
15- 25  3.547e-07   2.294e-08
25- 50  6.627e-07   5.997e-08
50-150  1.338e-06   3.837e-07
15-150  2.355e-06   4.378e-07
Double BB

Spectral model: bbodyrad<1> + bbodyrad<2>
------------------------------------------------------------
Parameters  : value         Lower 90%    Upper 90%
kT1 [keV]   : 6.09197        (-0.97357      1.13912)
R1^2/D10^2  : 0.831678        (-0.366662      0.761989)
kT2 [keV]   : 20.7289        (-2.21689      3.18115)
R2^2/D10^2  : 1.44609E-02    (-0.00628755   0.00827655)
------------------------------------------------------------
#Fit statistic : Chi-Squared =          55.03 using 59 PHA bins.
# Reduced chi-squared =          1.001 for     55 degrees of freedom
# Null hypothesis probability =   4.734631e-01

Energy  Fluence     90% Error
[keV]   [erg/cm2]   [erg/cm2]
15- 25  3.437e-07   5.728e-08
25- 50  6.616e-07   7.597e-08
50-150  1.259e-06   1.744e-07
15-150  2.264e-06   2.429e-07
Peak spectrum fit
Power-law model

Time interval is from    7.940 sec. to    8.940 sec.

Spectral model in power-law:
------------------------------------------------------------
Parameters  : value       lower 90%   higher 90%
Photon index: 1.64093     ( -0.21401   0.223109 )
Norm@50keV  : 9.56377E-03    ( -0.00139553   0.00136925 )
------------------------------------------------------------
#Fit statistic : Chi-Squared =          38.87 using 59 PHA bins.
# Reduced chi-squared =         0.6819 for     57 degrees of freedom
# Null hypothesis probability =   9.683306e-01

Photon flux (15-150 keV)    in 1 sec: 1.24513 ( -0.16035  0.16037 ) ph/cm2/s
Energy fluence (15-150 keV)             : 8.9041e-08 ( -1.37297e-08  1.39976e-08 ) ergs/cm2
Cutoff power-law model

Time interval is from    7.940 sec. to    8.940 sec.
Spectral model in the cutoff power-law:
------------------------------------------------------------
Parameters  : value       lower 90%   higher 90%
Photon index: 0.807836     ( -1.21445   0.909584 )
Epeak [keV] : 63.6620      ( -17.6093 -63.6615 )
Norm@50keV  : 2.78213E-02    ( -0.027822   0.104274 )
------------------------------------------------------------
#Fit statistic : Chi-Squared =          36.60 using 59 PHA bins.
# Reduced chi-squared =         0.6535 for     56 degrees of freedom
# Null hypothesis probability =   9.791694e-01

Photon flux (15-150 keV)    in 1 sec: 1.21431 ( -0.16491  0.16435 ) ph/cm2/s
Energy fluence (15-150 keV)             : 8.241e-08 ( -1.50922e-08  1.58439e-08 ) ergs/cm2
Band function

Time interval is from    7.940 sec. to    8.940 sec.

Spectral model in the Band function:
------------------------------------------------------------
Parameters  : value       lower 90%   higher 90%
alpha       : -0.701287   ( 0.643117   0.643117 )
beta        : -2.32160    ( 2.32629   0.763906 )
Epeak [keV] : 59.1731      ( -57.5958 128.587 )
Norm@50keV   : 3.26246E-02    ( -0.0219688   613.948 )
------------------------------------------------------------
#Fit statistic : Chi-Squared =          36.39 using 59 PHA bins.
# Reduced chi-squared =         0.6616 for     55 degrees of freedom
# Null hypothesis probability =   9.750864e-01

Photon flux (15-150 keV)    in 1 sec:  (    ) ph/cm2/s
Energy fluence (15-150 keV)             : 0 ( 0  0 ) ergs/cm2
Single BB
Spectral model blackbody:
------------------------------------------------------------
Parameters  : value    Lower 90%  Upper 90%
kT [keV]    : 12.2443  (-1.66787  1.98205)
R^2/D10^2   : 0.294149  (-0.123686   0.204381)
(R is the radius in km and D10 is the distance to the source in units of 10 kpc)
------------------------------------------------------------
#Fit statistic : Chi-Squared =          44.35 using 59 PHA bins.
# Reduced chi-squared =         0.7781 for     57 degrees of freedom
# Null hypothesis probability =   8.891423e-01

Energy  Fluence     90% Error
[keV]   [erg/cm2]   [erg/cm2]
15- 25  9.341e-09   2.031e-09
25- 50  3.009e-08   5.565e-09
50-150  2.749e-08   7.990e-09
15-150  6.692e-08   1.183e-08
Thermal bremsstrahlung (OTTB)

Spectral model: thermal bremsstrahlung
------------------------------------------------------------
Parameters  : value         Lower 90%    Upper 90%
kT [keV]    : 140.869       (-59.1685      -139.19)
Norm        : 5.21592       (-0.731501     0.922823)
------------------------------------------------------------
#Fit statistic : Chi-Squared =          37.21 using 59 PHA bins.
# Reduced chi-squared =         0.6528 for     57 degrees of freedom
# Null hypothesis probability =   9.803696e-01

Energy  Fluence     90% Error
[keV]   [erg/cm2]   [erg/cm2]
15- 25  1.346e-08   5.466e-09
25- 50  2.472e-08   1.259e-08
50-150  4.752e-08   2.786e-08
15-150  8.570e-08   4.638e-08
Double BB

Spectral model: bbodyrad<1> + bbodyrad<2>
------------------------------------------------------------
Parameters  : value         Lower 90%    Upper 90%
kT1 [keV]   : 6.01768        (-3.76085      5.71426)
R1^2/D10^2  : 1.90192        (-1.53755      134.552)
kT2 [keV]   : 18.0958        (-5.60406      -18.2275)
R2^2/D10^2  : 5.51046E-02    (-0.0527633   0.193717)
------------------------------------------------------------
#Fit statistic : Chi-Squared =          37.35 using 59 PHA bins.
# Reduced chi-squared =         0.6790 for     55 degrees of freedom
# Null hypothesis probability =   9.672317e-01

Energy  Fluence     90% Error
[keV]   [erg/cm2]   [erg/cm2]
15- 25  1.280e-08   7.070e-09
25- 50  2.597e-08   1.347e-08
50-150  4.071e-08   2.358e-08
15-150  7.948e-08   4.099e-08
Pre-slew spectrum (Pre-slew PHA with pre-slew DRM)
Power-law model

Spectral model in power-law:
------------------------------------------------------------
Parameters  : value       lower 90%   higher 90%
Photon index: 1.33300     ( -0.0732835   0.0731351 )
Norm@50keV  : 5.70294E-03    ( -0.000247609   0.000247508 )
------------------------------------------------------------
#Fit statistic : Chi-Squared =          72.46 using 59 PHA bins.
# Reduced chi-squared =          1.271 for     57 degrees of freedom
# Null hypothesis probability =   8.137328e-02

Photon flux (15-150 keV)    in 28.3 sec: 0.684685 ( -0.0303508  0.0303773 ) ph/cm2/s
Energy fluence (15-150 keV)             : 1.58238e-06 ( -7.60237e-08  7.6367e-08 ) ergs/cm2
Cutoff power-law model

Spectral model in the cutoff power-law:
------------------------------------------------------------
Parameters  : value       lower 90%   higher 90%
Photon index: 0.491769     ( -0.358719   0.33087 )
Epeak [keV] : 91.1128      ( -13.6077 26.9702 )
Norm@50keV  : 1.48879E-02    ( -0.004583   0.00729986 )
------------------------------------------------------------
#Fit statistic : Chi-Squared =          51.33 using 59 PHA bins.
# Reduced chi-squared =         0.9166 for     56 degrees of freedom
# Null hypothesis probability =   6.520359e-01

Photon flux (15-150 keV)    in 28.3 sec: 0.658938 ( -0.031908  0.031903 ) ph/cm2/s
Energy fluence (15-150 keV)             : 1.48303e-06 ( -8.55566e-08  8.5783e-08 ) ergs/cm2
Band function

Spectral model in the Band function:
------------------------------------------------------------
Parameters  : value       lower 90%   higher 90%
alpha       : -8.58412E-02   ( -0.589376   3.12622 )
beta        : -1.81528    ( 1.8086   0.31296 )
Epeak [keV] : 69.9600      ( -31.7946 31.2487 )
Norm@50keV   : 2.59472E-02    ( -0.0147004   4.10867 )
------------------------------------------------------------
#Fit statistic : Chi-Squared =          48.98 using 59 PHA bins.
# Reduced chi-squared =         0.8906 for     55 degrees of freedom
# Null hypothesis probability =   7.025873e-01

Photon flux (15-150 keV)    in 28.3 sec:  (    ) ph/cm2/s
Energy fluence (15-150 keV)             : 0 ( 0  0 ) ergs/cm2
S(25-50 keV) vs. S(50-100 keV) plot
S(25-50 keV)  = 6.40e-07
S(50-100 keV) = 8.26e-07
T90 vs. Hardness ratio plot
T90                                   = 48 sec.
Hardness ratio (energy fluence ratio) = 1.29062
Color vs. Color plot
Count Ratio  (25-50 keV) / (15-25 keV) = 1.28033
Count Ratio (50-100 keV) / (15-25 keV) = 0.903866
Mask shadow pattern

IMX = 1.907673413937355E-03, IMY = 2.776758531718286E-02
TIME vs. PHA plot around the trigger time

Blue+Cyan dotted lines: Time interval of the scaled map
From 0.000000 to 1.024000
TIME vs. DetID plot around the trigger time

Blue+Cyan dotted lines: Time interval of the scaled map
From 0.000000 to 1.024000
100 us light curve (15-350 keV)

Blue+Cyan dotted lines: Time interval of the scaled map
From 0.000000 to 1.024000
Spacecraft aspect plot

Bright source in the pre-burst/pre-slew/post-slew images
Pre-burst image of 15-350 keV band
Time interval of the image:
-239.560000 -15.560000

# RAcent  DECcent POSerr Theta    Phi  PeakCts   SNR AngSep     Name
#  [deg]    [deg]    ['] [deg]  [deg]                   [']
299.5689  35.2196    0.9  49.6  -15.5   6.1785  12.5    1.5	Cyg X-1
308.0290  40.9723    4.3  46.3   -4.6   1.1447   2.7    3.9	Cyg X-3
326.2129  38.4652    9.9  34.4    7.5  -0.3165  -1.2    8.8	Cyg X-2
 27.5113   1.2528    3.0  42.2  133.3   2.6371   3.9 ------	UNKNOWN
333.1723  51.5352    2.3  43.9   23.9   2.3180   5.1 ------	UNKNOWN
 25.4189 -34.1043    3.2  57.1  176.3   5.1717   3.6 ------	UNKNOWN
 14.6873 -32.0209    2.7  49.4 -177.4   2.3405   4.2 ------	UNKNOWN
296.8932  27.0539    2.6  49.6  -26.7   2.2700   4.5 ------	UNKNOWN
Pre-slew background subtracted image of 15-350 keV band
Time interval of the image:
-15.560000 12.740590

# RAcent  DECcent POSerr Theta    Phi  PeakCts   SNR AngSep     Name
#  [deg]    [deg]    ['] [deg]  [deg]                   [']
299.7021  35.2535    4.0  49.5  -15.4   0.4219   2.9    6.3	Cyg X-1
308.3450  40.9406    0.0  46.1   -4.4  -0.1433  -1.1   10.7	Cyg X-3
326.1761  38.4265   33.3  34.4    7.5   0.0317   0.3    6.3	Cyg X-2
  0.0834   0.8462    2.6  16.3  154.0   0.2904   4.4   51.0	UNKNOWN
344.4255   8.0869    0.3   1.6  -86.1   2.4307  35.6 ------	UNKNOWN
Post-slew image of 15-350 keV band
Time interval of the image:
35.540600 962.496500

# RAcent  DECcent POSerr Theta    Phi  PeakCts   SNR AngSep     Name
#  [deg]    [deg]    ['] [deg]  [deg]                   [']
299.5942  35.2039    0.6  49.1  -21.9  29.4232  20.4    0.2	Cyg X-1
308.0681  40.9113    2.6  46.0  -10.8   5.4707   4.4    3.1	Cyg X-3
326.1816  38.3158   40.4  34.4    2.0   0.2459   0.3    0.6	Cyg X-2
 22.0488 -17.7855    2.4  45.3  152.9   9.9853   4.8 ------	UNKNOWN
  5.4677  -6.3874    2.5  25.5  151.8   3.6891   4.7  504.0	UNKNOWN
347.8903  16.7448    2.4   9.3   48.7   2.8883   4.8 ------	UNKNOWN
353.7632 -50.1293    4.6  58.8 -159.2  15.1374   2.5 ------	UNKNOWN
314.1496  -7.1001    3.1  33.8  -88.1   5.5049   3.8 ------	UNKNOWN
Plot creation:
Fri Mar 18 13:41:12 EDT 2016