Special notes of this burst
Image
Pre-slew 15.0-350.0 keV image (Event data)
#   RAcent    DECcent   POSerr    Theta     Phi              Peak Cts       SNR   Name
  329.3641   -20.7320   0.0066    32.4304  -125.2401         1.0129360     29.106 TRIG_00668689

Foreground time interval of the image:
 -0.112   2.344 (delta_t =   2.456 [sec])
Background time interval of the image:
-239.584  -0.112 (delta_t = 239.472 [sec])
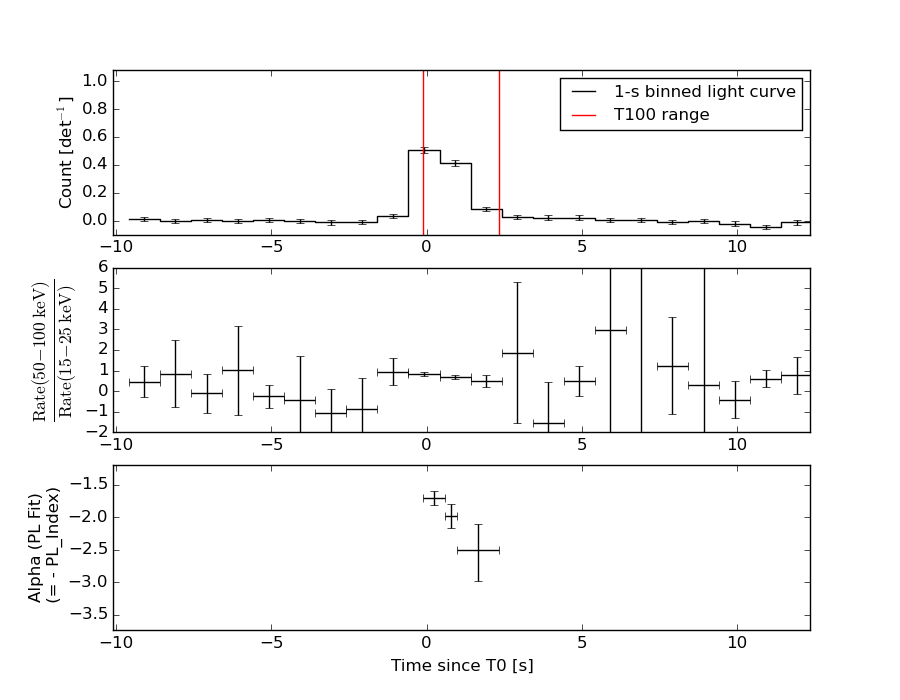
Lightcurves
Notes:
- 1) The mask-weighted light curves are using the flight position.
- 2) Multiple plots of different time binning/intervals are shown to cover all scenarios of short/long GRBs, rate/image triggers, and real/false positives.
- 3) For all the mask-weighted lightcurves, the y-axis units are counts/sec/det where a det is 0.4 x 0.4 = 0.16 sq cm.
- 4) The verticle lines correspond to following: green dotted lines are T50 interval, black dotted lines are T90 interval, blue solid line(s) is a spacecraft slew start time, and orange solid line(s) is a spacecraft slew end time.
- 5) Time of each bin is in the middle of the bin.
1 s binning
From T0-310 s to T0+310 s

From T100_start - 20 s to T100_end + 30 s

Full time interval

64 ms binning
Full time interval
From T100_start to T100_end
From T0-5 sec to T0+5 sec

16 ms binning
From T100_start-5 s to T100_start+5 s
Blue+Cyan dotted lines: Time interval of the scaled map
From 0.000000 to 0.512000
8 ms binning
From T100_start-3 s to T100_start+3 s
Blue+Cyan dotted lines: Time interval of the scaled map
From 0.000000 to 0.512000
2 ms binning
From T100_start-1 s to T100_start+1 s
Blue+Cyan dotted lines: Time interval of the scaled map
From 0.000000 to 0.512000
SN=5 or 10 sec. binning (whichever binning is satisfied first)
SN=5 or 10 sec. binning (T < 200 sec)
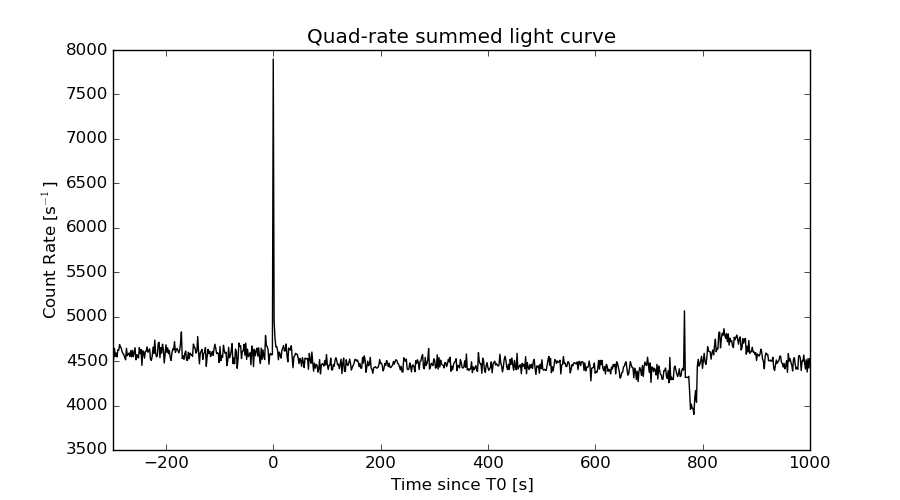
Quad-rate summed light curves (from T0-300s to T0+1000s)
Spectral Evolution
Spectra
Notes:
- 1) The fitting includes the systematic errors.
- 2) When the burst includes telescope slew time periods, the fitting uses an average response file made from multiple 5-s response files through out the slew time plus single time preiod for the non-slew times, and weighted by the total counts in the corresponding time period using addrmf. An average response file is needed becuase a spectral fit using the pre-slew DRM will introduce some errors in both a spectral shape and a normalization if the PHA file contains a lot of the slew/post-slew time interval.
- 3) For fits to more complicated models (e.g. a power-law over a cutoff power-law), the BAT team has decided to require a chi-square improvement of more than 6 for each extra dof.
Time averaged spectrum fit using the average DRM
Power-law model

Time interval is from   -0.112 sec. to    2.344 sec.

Spectral model in power-law:
------------------------------------------------------------
Parameters  : value       lower 90%   higher 90%
Photon index: 1.84350     ( -0.101262   0.103269 )
Norm@50keV  : 2.59169E-02    ( -0.00161851   0.00160506 )
------------------------------------------------------------
#Fit statistic : Chi-Squared =          48.28 using 59 PHA bins.
# Reduced chi-squared =         0.8471 for     57 degrees of freedom
# Null hypothesis probability =   7.878170e-01

Photon flux (15-150 keV)    in 2.456 sec: 3.63351 ( -0.21256  0.21287 ) ph/cm2/s
Energy fluence (15-150 keV)             : 5.85422e-07 ( -3.66924e-08  3.68903e-08 ) ergs/cm2
Cutoff power-law model

Time interval is from   -0.112 sec. to    2.344 sec.
Spectral model in the cutoff power-law:
------------------------------------------------------------
Parameters  : value       lower 90%   higher 90%
Photon index: 1.44228     ( -0.433588   0.392709 )
Epeak [keV] : 65.8784      ( -15.0478 318.777 )
Norm@50keV  : 4.21836E-02    ( -0.015645   0.0285589 )
------------------------------------------------------------
#Fit statistic : Chi-Squared =          45.22 using 59 PHA bins.
# Reduced chi-squared =         0.8076 for     56 degrees of freedom
# Null hypothesis probability =   8.480057e-01

Photon flux (15-150 keV)    in 2.456 sec: 3.56548 ( -0.22258  0.22262 ) ph/cm2/s
Energy fluence (15-150 keV)             : 0 ( 0  0 ) ergs/cm2
Band function

Time interval is from   -0.112 sec. to    2.344 sec.

Spectral model in the Band function:
------------------------------------------------------------
Parameters  : value       lower 90%   higher 90%
alpha       : -1.24147   ( -0.299497   1.42012 )
beta        : -2.08349    ( 2.09203   0.27683 )
Epeak [keV] : 52.7515      ( -28.8665 265.543 )
Norm@50keV   : 5.65996E-02    ( -0.022332   3617.4 )
------------------------------------------------------------
#Fit statistic : Chi-Squared =          45.14 using 59 PHA bins.
# Reduced chi-squared =         0.8208 for     55 degrees of freedom
# Null hypothesis probability =   8.258831e-01

Photon flux (15-150 keV)    in 2.456 sec: 3.63351 ( -0.21256  0.21287 ) ph/cm2/s
Energy fluence (15-150 keV)             : 5.67881e-07 ( -3.22345e-08  4.06156e-08 ) ergs/cm2
Single BB

Spectral model blackbody:
------------------------------------------------------------
Parameters  : value    Lower 90%  Upper 90%
kT [keV]    : 12.0307  (  )
R^2/D10^2   : 0.843786  (   )
(R is the radius in km and D10 is the distance to the source in units of 10 kpc)
------------------------------------------------------------
#Fit statistic : Chi-Squared =         115.93 using 59 PHA bins.
# Reduced chi-squared =         2.0339 for     57 degrees of freedom
# Null hypothesis probability =   6.643594e-06

Energy  Fluence     90% Error
[keV]   [erg/cm2]   [erg/cm2]
15- 25  6.345e-08   6.017e-09
25- 50  2.003e-07   1.300e-08
50-150  1.746e-07   2.327e-08
15-150  4.384e-07   2.972e-08
Thermal bremsstrahlung (OTTB)

Spectral model: thermal bremsstrahlung
------------------------------------------------------------
Parameters  : value         Lower 90%    Upper 90%
kT [keV]    : 97.1376       (-17.9389      25.112)
Norm        : 16.0637       (-1.31805     1.47176)
------------------------------------------------------------
#Fit statistic : Chi-Squared =          45.53 using 59 PHA bins.
# Reduced chi-squared =         0.7987 for     57 degrees of freedom
# Null hypothesis probability =   8.628003e-01

Energy  Fluence     90% Error
[keV]   [erg/cm2]   [erg/cm2]
15- 25  1.031e-07   1.013e-08
25- 50  1.772e-07   1.227e-08
50-150  2.825e-07   8.427e-08
15-150  5.628e-07   9.050e-08
Double BB

Spectral model: bbodyrad<1> + bbodyrad<2>
------------------------------------------------------------
Parameters  : value         Lower 90%    Upper 90%
kT1 [keV]   : 6.35788        (-1.19167      1.29273)
R1^2/D10^2  : 6.11280        (-2.83452      6.92268)
kT2 [keV]   : 21.7766        (-3.71611      6.00026)
R2^2/D10^2  : 6.76702E-02    (-0.0415646   0.0779567)
------------------------------------------------------------
#Fit statistic : Chi-Squared =          47.52 using 59 PHA bins.
# Reduced chi-squared =         0.8640 for     55 degrees of freedom
# Null hypothesis probability =   7.529410e-01

Energy  Fluence     90% Error
[keV]   [erg/cm2]   [erg/cm2]
15- 25  1.019e-07   1.938e-08
25- 50  1.754e-07   2.569e-08
50-150  2.842e-07   7.440e-08
15-150  5.615e-07   1.217e-07
Peak spectrum fit
Power-law model

Time interval is from   -0.112 sec. to    0.888 sec.

Spectral model in power-law:
------------------------------------------------------------
Parameters  : value       lower 90%   higher 90%
Photon index: 1.73897     ( -0.0942726   0.0956826 )
Norm@50keV  : 5.32515E-02    ( -0.00304953   0.00303204 )
------------------------------------------------------------
#Fit statistic : Chi-Squared =          60.32 using 59 PHA bins.
# Reduced chi-squared =          1.058 for     57 degrees of freedom
# Null hypothesis probability =   3.565723e-01

Photon flux (15-150 keV)    in 1 sec: 7.17176 ( -0.39926  0.39981 ) ph/cm2/s
Energy fluence (15-150 keV)             : 4.91768e-07 ( -2.91101e-08  2.92467e-08 ) ergs/cm2
Cutoff power-law model

Time interval is from   -0.112 sec. to    0.888 sec.
Spectral model in the cutoff power-law:
------------------------------------------------------------
Parameters  : value       lower 90%   higher 90%
Photon index: 1.44246     ( -0.383196   0.334804 )
Epeak [keV] : 92.3781      ( -28.2381 -92.3782 )
Norm@50keV  : 7.56999E-02    ( -0.0238594   0.0423383 )
------------------------------------------------------------
#Fit statistic : Chi-Squared =          58.25 using 59 PHA bins.
# Reduced chi-squared =          1.040 for     56 degrees of freedom
# Null hypothesis probability =   3.925411e-01

Photon flux (15-150 keV)    in 1 sec: 7.07773 ( -0.41435  0.41445 ) ph/cm2/s
Energy fluence (15-150 keV)             : 4.82225e-07 ( -3.15328e-08  3.14164e-08 ) ergs/cm2
Band function

Time interval is from   -0.112 sec. to    0.888 sec.

Spectral model in the Band function:
------------------------------------------------------------
Parameters  : value       lower 90%   higher 90%
alpha       : 4.95950   ( -7.47981   -4.9595 )
beta        : -1.79342    ( -0.107425   0.103862 )
Epeak [keV] : 22.2492      ( -4.60897 3.31685 )
Norm@50keV   : 1.33611E+04    ( -715.6   108629 )
------------------------------------------------------------
#Fit statistic : Chi-Squared =          57.36 using 59 PHA bins.
# Reduced chi-squared =          1.043 for     55 degrees of freedom
# Null hypothesis probability =   3.878038e-01

Photon flux (15-150 keV)    in 1 sec:  (    ) ph/cm2/s
Energy fluence (15-150 keV)             : 0 ( 0  0 ) ergs/cm2
Single BB

Spectral model blackbody:
------------------------------------------------------------
Parameters  : value    Lower 90%  Upper 90%
kT [keV]    : 12.9979  (  )
R^2/D10^2   : 1.27880  (   )
(R is the radius in km and D10 is the distance to the source in units of 10 kpc)
------------------------------------------------------------
#Fit statistic : Chi-Squared =         145.07 using 59 PHA bins.
# Reduced chi-squared =         2.5451 for     57 degrees of freedom
# Null hypothesis probability =   1.277969e-09

Energy  Fluence     90% Error
[keV]   [erg/cm2]   [erg/cm2]
15- 25  4.582e-08   4.630e-09
25- 50  1.578e-07   1.065e-08
50-150  1.685e-07   2.160e-08
15-150  3.721e-07   2.450e-08
Thermal bremsstrahlung (OTTB)

Spectral model: thermal bremsstrahlung
------------------------------------------------------------
Parameters  : value         Lower 90%    Upper 90%
kT [keV]    : 129.461       (-27.9959      34.5274)
Norm        : 29.8048       (-1.98949     2.33859)
------------------------------------------------------------
#Fit statistic : Chi-Squared =          58.79 using 59 PHA bins.
# Reduced chi-squared =          1.031 for     57 degrees of freedom
# Null hypothesis probability =   4.096360e-01

Energy  Fluence     90% Error
[keV]   [erg/cm2]   [erg/cm2]
15- 25  7.735e-08   7.025e-09
25- 50  1.402e-07   1.105e-08
50-150  2.594e-07   7.970e-08
15-150  4.769e-07   8.820e-08
Double BB

Spectral model: bbodyrad<1> + bbodyrad<2>
------------------------------------------------------------
Parameters  : value         Lower 90%    Upper 90%
kT1 [keV]   : 6.48220        (-1.09222      1.2456)
R1^2/D10^2  : 10.9941        (-4.95315      10.5816)
kT2 [keV]   : 23.6558        (-3.71023      5.80815)
R2^2/D10^2  : 0.108851    (-0.0615663   0.104022)
------------------------------------------------------------
#Fit statistic : Chi-Squared =          60.21 using 59 PHA bins.
# Reduced chi-squared =          1.095 for     55 degrees of freedom
# Null hypothesis probability =   2.929187e-01

Energy  Fluence     90% Error
[keV]   [erg/cm2]   [erg/cm2]
15- 25  7.892e-08   1.582e-08
25- 50  1.399e-07   2.160e-08
50-150  2.604e-07   5.815e-08
15-150  4.792e-07   8.215e-08
Pre-slew spectrum (Pre-slew PHA with pre-slew DRM)
Power-law model

Spectral model in power-law:
------------------------------------------------------------
Parameters  : value       lower 90%   higher 90%
Photon index: 1.84350     ( -0.101262   0.103269 )
Norm@50keV  : 2.59169E-02    ( -0.00161851   0.00160506 )
------------------------------------------------------------
#Fit statistic : Chi-Squared =          48.28 using 59 PHA bins.
# Reduced chi-squared =         0.8471 for     57 degrees of freedom
# Null hypothesis probability =   7.878170e-01

Photon flux (15-150 keV)    in 2.456 sec: 3.63337 ( -0.212602  0.212783 ) ph/cm2/s
Energy fluence (15-150 keV)             : 5.85326e-07 ( -3.67093e-08  3.68965e-08 ) ergs/cm2
Cutoff power-law model

Spectral model in the cutoff power-law:
------------------------------------------------------------
Parameters  : value       lower 90%   higher 90%
Photon index: 1.44228     ( -0.433588   0.392709 )
Epeak [keV] : 65.8783      ( -15.0478 318.777 )
Norm@50keV  : 4.21836E-02    ( -0.015645   0.0285589 )
------------------------------------------------------------
#Fit statistic : Chi-Squared =          45.22 using 59 PHA bins.
# Reduced chi-squared =         0.8076 for     56 degrees of freedom
# Null hypothesis probability =   8.480057e-01

Photon flux (15-150 keV)    in 2.456 sec: 3.56481 ( -0.22247  0.22253 ) ph/cm2/s
Energy fluence (15-150 keV)             : 5.68365e-07 ( -4.06026e-08  4.05707e-08 ) ergs/cm2
Band function

Spectral model in the Band function:
------------------------------------------------------------
Parameters  : value       lower 90%   higher 90%
alpha       : -1.24147   ( -0.299497   1.42012 )
beta        : -2.08349    ( 2.09203   0.27683 )
Epeak [keV] : 52.7515      ( -28.8692 265.544 )
Norm@50keV   : 5.65996E-02    ( -0.022332   3617.68 )
------------------------------------------------------------
#Fit statistic : Chi-Squared =          45.14 using 59 PHA bins.
# Reduced chi-squared =         0.8208 for     55 degrees of freedom
# Null hypothesis probability =   8.258831e-01

Photon flux (15-150 keV)    in 2.456 sec:  (    ) ph/cm2/s
Energy fluence (15-150 keV)             : 0 ( 0  0 ) ergs/cm2
S(25-50 keV) vs. S(50-100 keV) plot

S(25-50 keV)  = 1.67e-07
S(50-100 keV) = 1.87e-07
T90 vs. Hardness ratio plot

T90                                   = 1.43999993801117 sec.
Hardness ratio (energy fluence ratio) = 1.11976
Color vs. Color plot

Count Ratio  (25-50 keV) / (15-25 keV) = 1.25828
Count Ratio (50-100 keV) / (15-25 keV) = 0.75675
Mask shadow pattern

IMX = -3.666079264543144E-01, IMY = 5.189278748372695E-01
TIME vs. PHA plot around the trigger time

Blue+Cyan dotted lines: Time interval of the scaled map
From 0.000000 to 0.512000
TIME vs. DetID plot around the trigger time

Blue+Cyan dotted lines: Time interval of the scaled map
From 0.000000 to 0.512000
100 us light curve (15-350 keV)

Blue+Cyan dotted lines: Time interval of the scaled map
From 0.000000 to 0.512000
Spacecraft aspect plot

Bright source in the pre-burst/pre-slew/post-slew images
Pre-burst image of 15-350 keV band
Time interval of the image:
-239.584000 -0.112000

# RAcent  DECcent POSerr Theta    Phi  PeakCts   SNR AngSep     Name
#  [deg]    [deg]    ['] [deg]  [deg]                   [']
299.5925  35.2126    0.7  49.1  -21.9   7.6840  16.6    0.7	Cyg X-1
308.1028  40.9470    2.3  46.0  -10.7   1.8895   4.9    0.5	Cyg X-3
326.1727  38.3045   21.7  34.4    1.9   0.1464   0.5    1.0	Cyg X-2
Pre-slew background subtracted image of 15-350 keV band
Time interval of the image:
-0.112000 2.344000

# RAcent  DECcent POSerr Theta    Phi  PeakCts   SNR AngSep     Name
#  [deg]    [deg]    ['] [deg]  [deg]                   [']
299.6065  35.1644   10.7  49.1  -22.0  -0.0596  -1.1    2.4	Cyg X-1
308.0387  40.9510    6.4  46.0  -10.8  -0.0753  -1.8    3.2	Cyg X-3
325.9309  38.3725    0.0  34.6    1.7   0.0299   1.1   11.7	Cyg X-2
 28.8798 -18.7627    2.7  51.4  149.7   0.4575   4.2 ------	UNKNOWN
306.2178  23.1665    2.4  39.6  -35.4   0.1855   4.9 ------	UNKNOWN
329.3641 -20.7320    0.4  32.4 -125.2   1.0127  29.1 ------	UNKNOWN
Post-slew image of 15-350 keV band
Time interval of the image:
70.716590 768.116600

# RAcent  DECcent POSerr Theta    Phi  PeakCts   SNR AngSep     Name
#  [deg]    [deg]    ['] [deg]  [deg]                   [']
288.9179  10.8547    0.0  50.8  -42.1   1.1380   0.4    8.9	GRS 1915+105
291.6169  -9.9788    4.0  37.9  -66.1   3.4149   2.9 ------	UNKNOWN
284.1919 -58.4621    4.0  49.8 -137.6   6.2010   2.9 ------	UNKNOWN
287.8379   9.4193    3.3  50.8  -44.4   9.9568   3.5 ------	UNKNOWN
Plot creation:
Fri Mar 18 13:39:07 EDT 2016