Click here for the BAT GCN circular template
Image
Pre-slew 15.0-350.0 keV image (Event data)
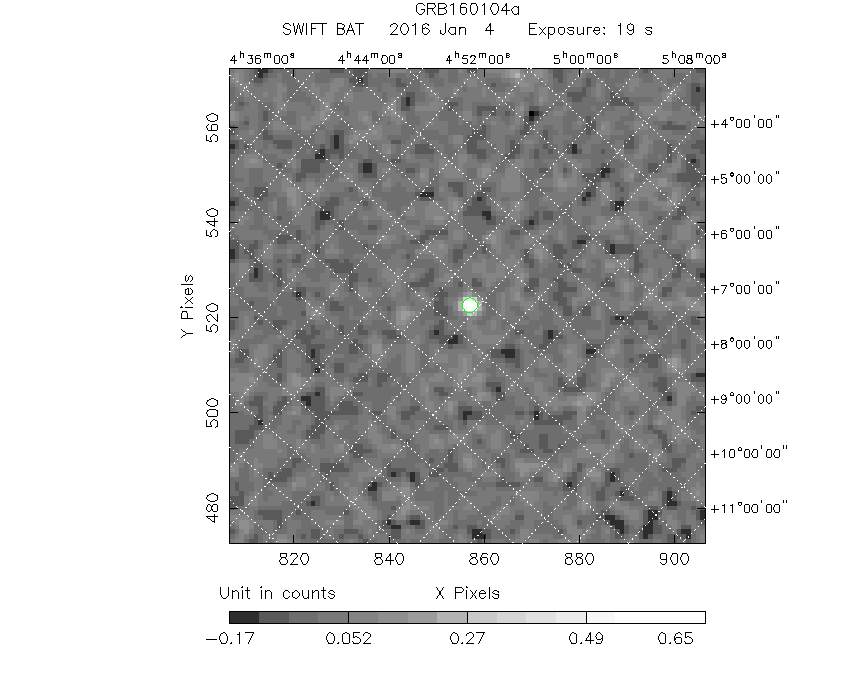
# RAcent DECcent POSerr Theta Phi Peak Cts SNR Name
76.8105 11.3326 0.0130 6.1507 -63.7919 0.7572659 14.809 TRIG_00669319
Foreground time interval of the image:
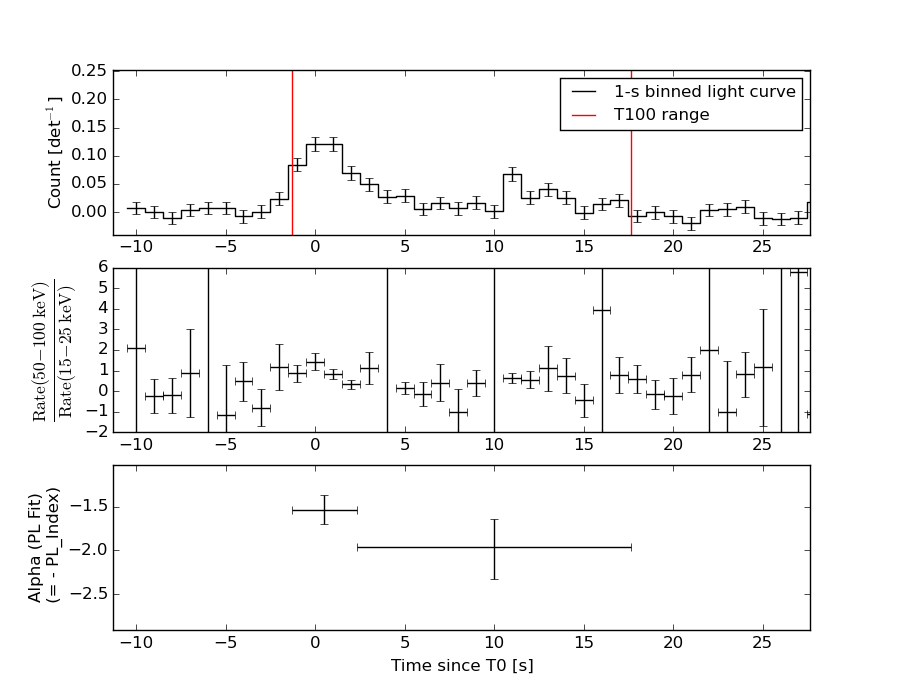
-1.312 17.648 (delta_t = 18.960 [sec])
Background time interval of the image:
-441.395 -423.506 (delta_t = 17.889 [sec])
-239.496 -1.312 (delta_t = 238.184 [sec])
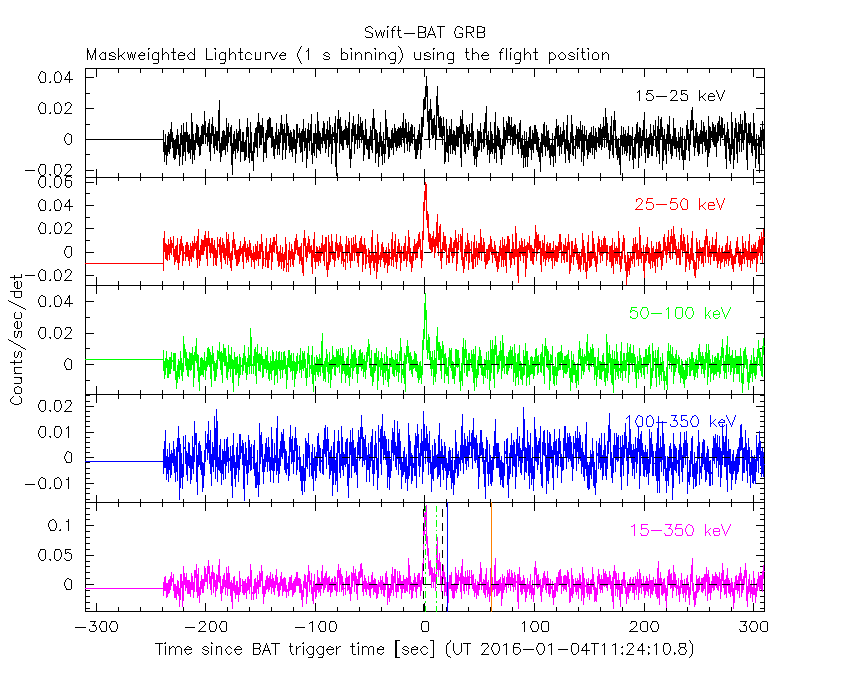
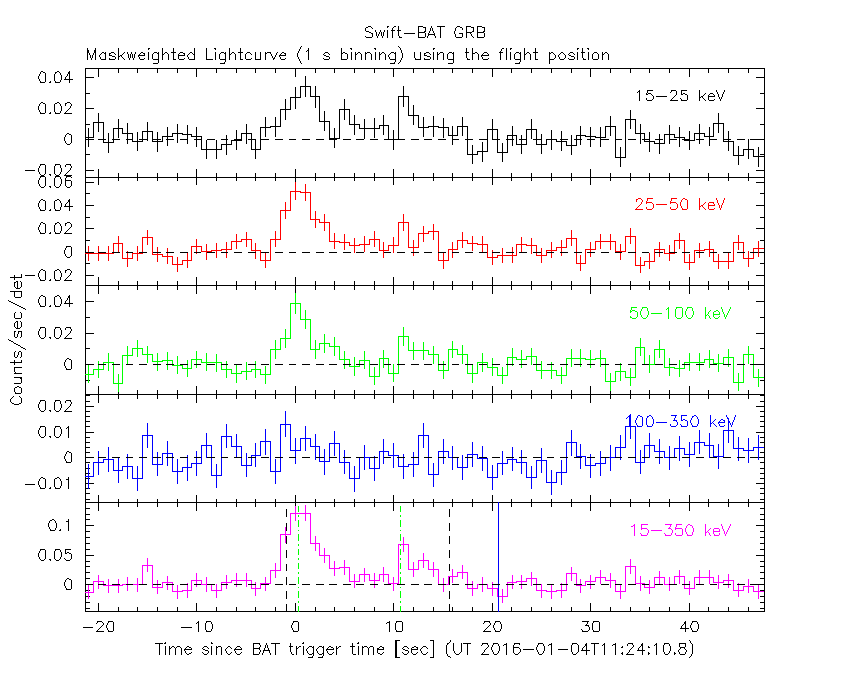
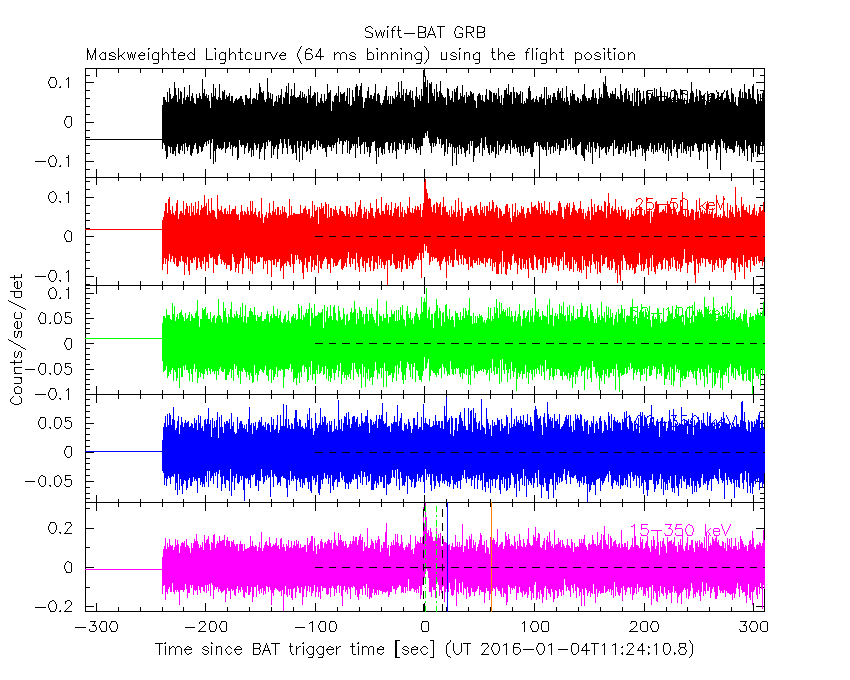
Lightcurves
Notes:
- 1) The mask-weighted light curves are using the flight position.
- 2) Multiple plots of different time binning/intervals are shown to cover all scenarios of short/long GRBs, rate/image triggers, and real/false positives.
- 3) For all the mask-weighted lightcurves, the y-axis units are counts/sec/det where a det is 0.4 x 0.4 = 0.16 sq cm.
- 4) The verticle lines correspond to following: green dotted lines are T50 interval, black dotted lines are T90 interval, blue solid line(s) is a spacecraft slew start time, and orange solid line(s) is a spacecraft slew end time.
- 5) Time of each bin is in the middle of the bin.
1 s binning
From T0-310 s to T0+310 s
From T100_start - 20 s to T100_end + 30 s
Full time interval

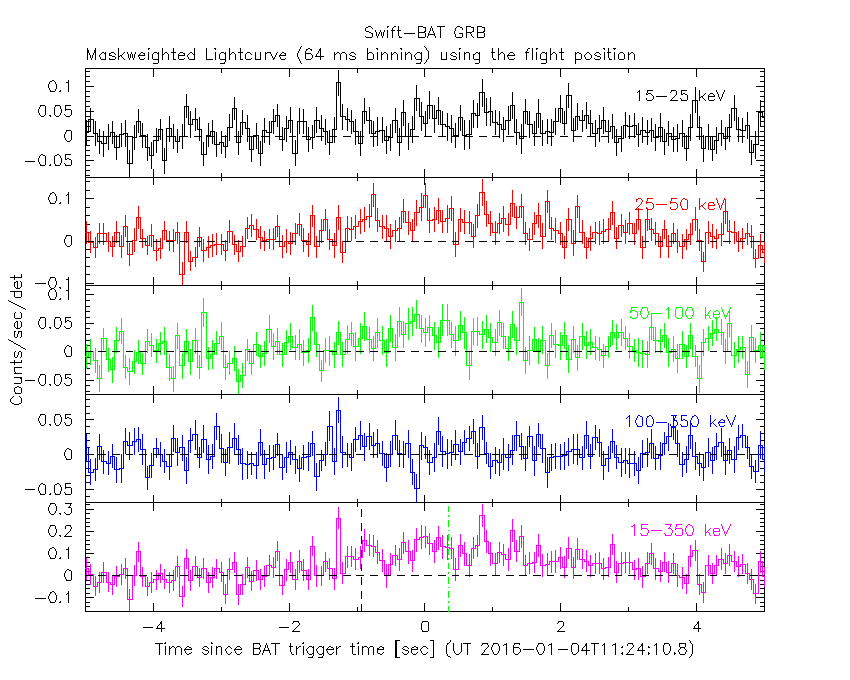
64 ms binning
Full time interval
From T100_start to T100_end
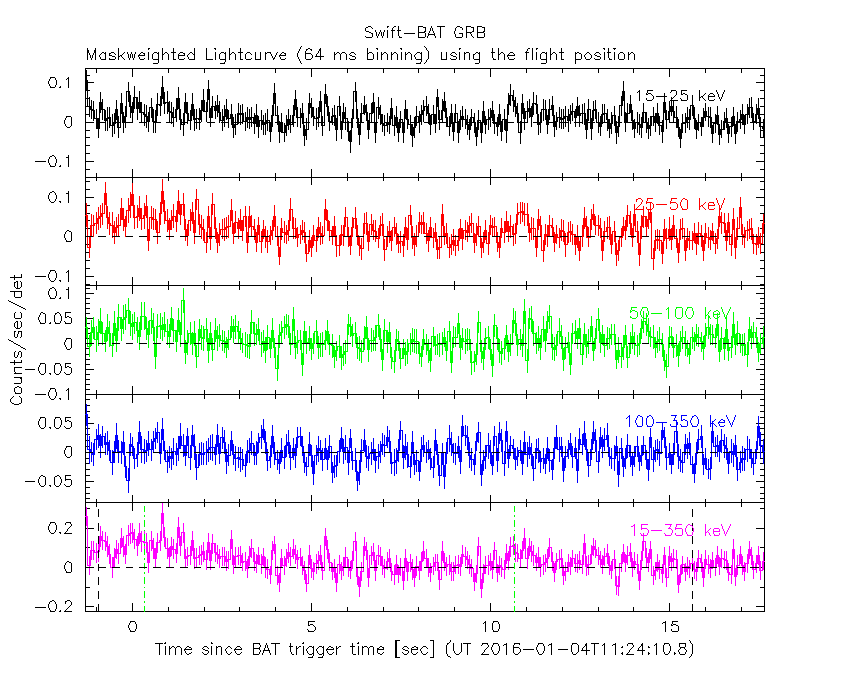
From T0-5 sec to T0+5 sec
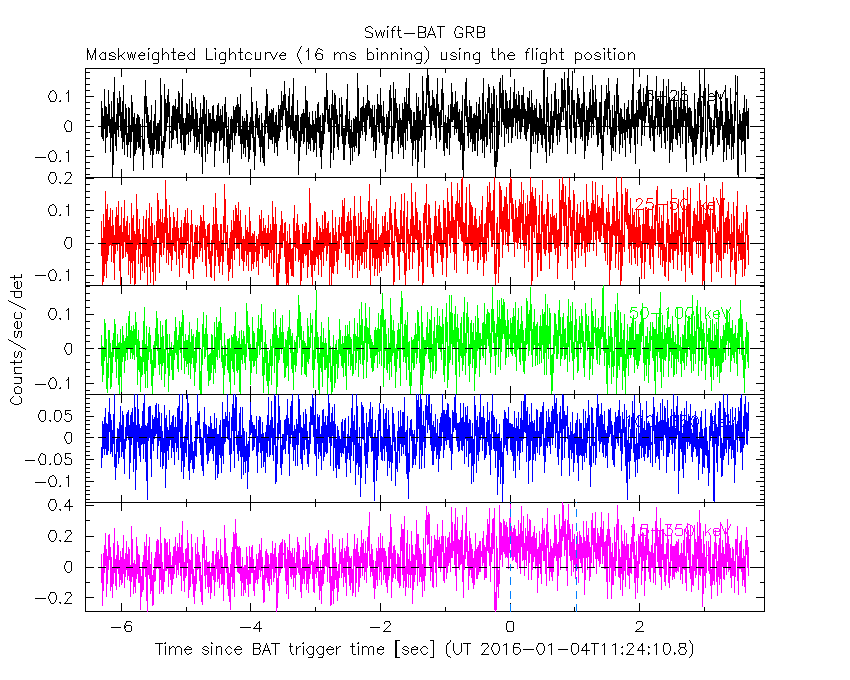
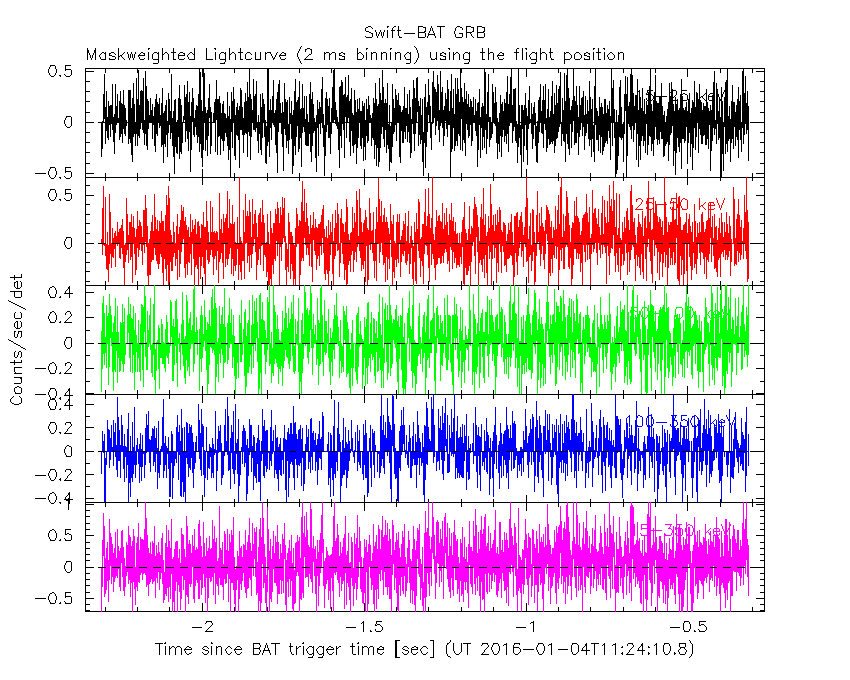
16 ms binning
From T100_start-5 s to T100_start+5 s
Blue+Cyan dotted lines: Time interval of the scaled map
From 0.000000 to 1.024000
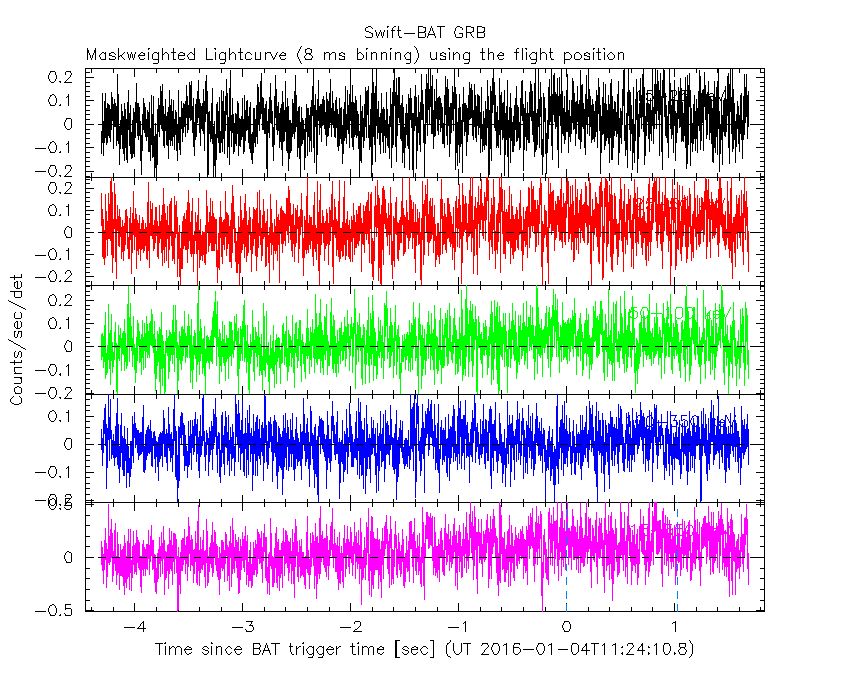
8 ms binning
From T100_start-3 s to T100_start+3 s
Blue+Cyan dotted lines: Time interval of the scaled map
From 0.000000 to 1.024000
2 ms binning
From T100_start-1 s to T100_start+1 s
Blue+Cyan dotted lines: Time interval of the scaled map
From 0.000000 to 1.024000
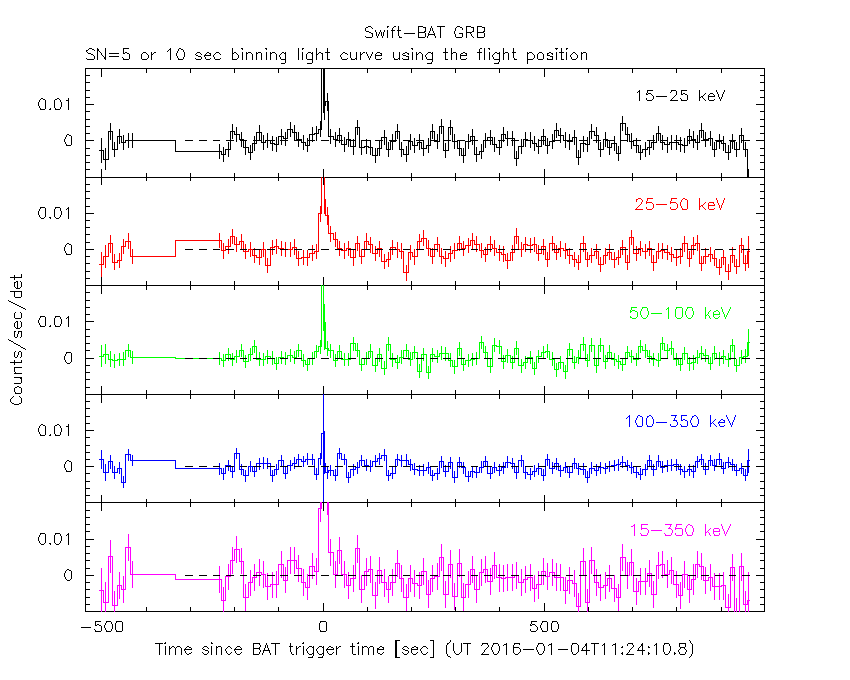
SN=5 or 10 sec. binning (whichever binning is satisfied first)
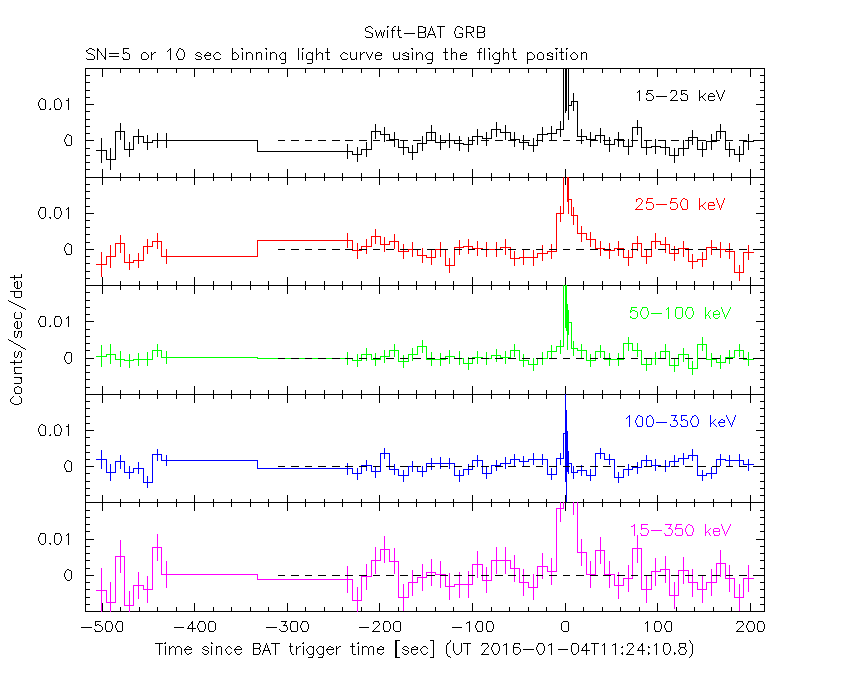
SN=5 or 10 sec. binning (T < 200 sec)
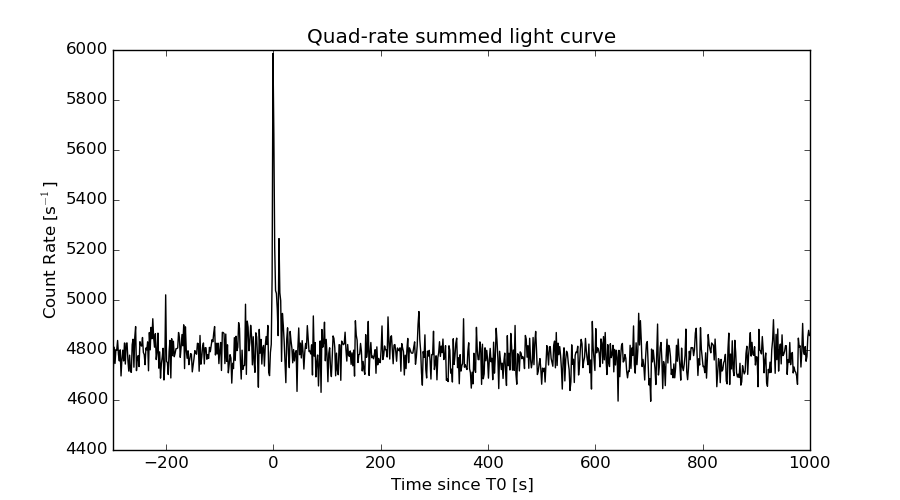
Quad-rate summed light curves (from T0-300s to T0+1000s)
Spectral Evolution
Spectra
Notes:
- 1) The fitting includes the systematic errors.
- 2) When the burst includes telescope slew time periods, the fitting uses an average response file made from multiple 5-s response files through out the slew time plus single time preiod for the non-slew times, and weighted by the total counts in the corresponding time period using addrmf. An average response file is needed becuase a spectral fit using the pre-slew DRM will introduce some errors in both a spectral shape and a normalization if the PHA file contains a lot of the slew/post-slew time interval.
- 3) For fits to more complicated models (e.g. a power-law over a cutoff power-law), the BAT team has decided to require a chi-square improvement of more than 6 for each extra dof.
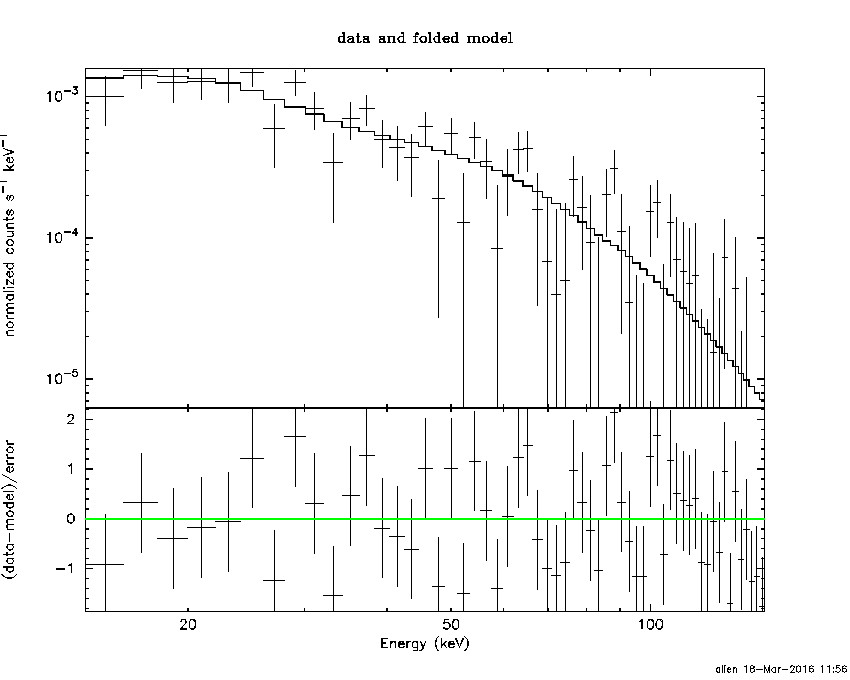
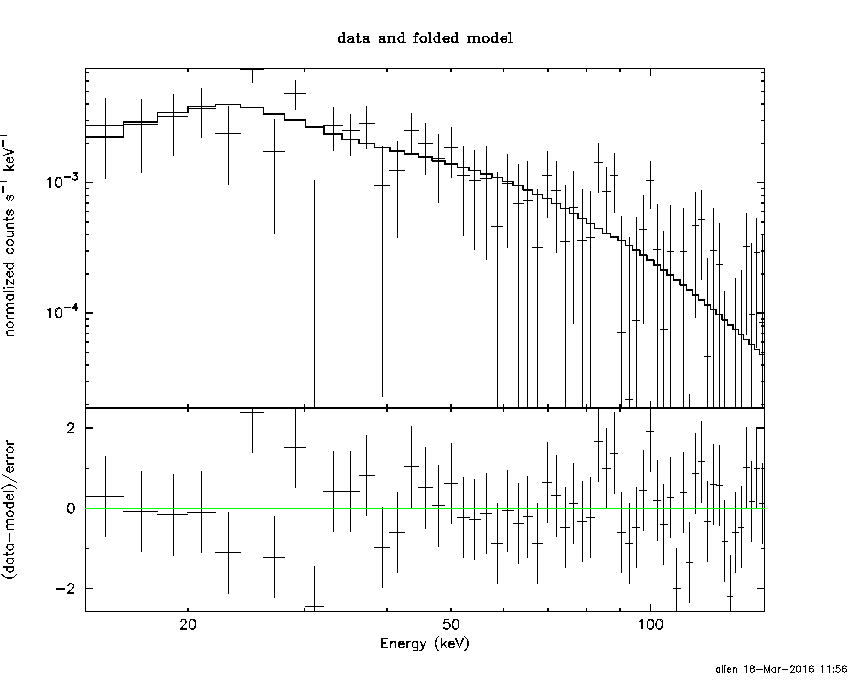
Time averaged spectrum fit using the average DRM
Power-law model
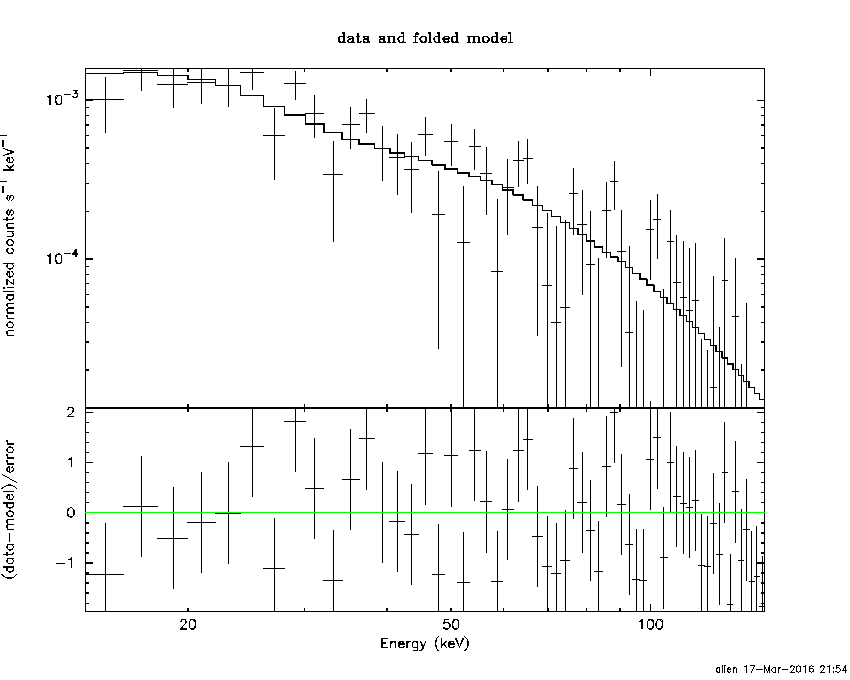
Time interval is from   -1.312 sec. to   17.648 sec.

Spectral model in power-law:
------------------------------------------------------------
Parameters  : value       lower 90%   higher 90%
Photon index: 1.75506     ( -0.186115   0.193375 )
Norm@50keV  : 2.31946E-03    ( -0.00029207   0.000286854 )
------------------------------------------------------------
#Fit statistic : Chi-Squared =          61.54 using 59 PHA bins.
# Reduced chi-squared =          1.080 for     57 degrees of freedom
# Null hypothesis probability =   3.167058e-01

Photon flux (15-150 keV)    in 18.96 sec: 0.314232 ( -0.033755  0.033761 ) ph/cm2/s
Energy fluence (15-150 keV)             : 4.0574e-07 ( -5.22981e-08  5.33398e-08 ) ergs/cm2
Cutoff power-law model
Time interval is from   -1.312 sec. to   17.648 sec.
Spectral model in the cutoff power-law:
------------------------------------------------------------
Parameters  : value       lower 90%   higher 90%
Photon index: 1.01715     ( -0.896727   0.726132 )
Epeak [keV] : 57.9984      ( -14.705 281.262 )
Norm@50keV  : 6.03707E-03    ( -0.00362276   0.0133475 )
------------------------------------------------------------
#Fit statistic : Chi-Squared =          58.50 using 59 PHA bins.
# Reduced chi-squared =          1.045 for     56 degrees of freedom
# Null hypothesis probability =   3.837142e-01

Photon flux (15-150 keV)    in 18.96 sec: 0.306195 ( -0.034584  0.034612 ) ph/cm2/s
Energy fluence (15-150 keV)             : 3.77171e-07 ( -5.70398e-08  5.95943e-08 ) ergs/cm2
Band function

Time interval is from   -1.312 sec. to   17.648 sec.

Spectral model in the Band function:
------------------------------------------------------------
Parameters  : value       lower 90%   higher 90%
alpha       : -1.01704   ( -0.430987   1.0504 )
beta        : -10.0000    ( 10   0 )
Epeak [keV] : 57.9866      ( -14.594 276.491 )
Norm@50keV   : 6.03740E-03    ( -0.00362364   0.0133503 )
------------------------------------------------------------
#Fit statistic : Chi-Squared =          58.50 using 59 PHA bins.
# Reduced chi-squared =          1.064 for     55 degrees of freedom
# Null hypothesis probability =   3.481590e-01

Photon flux (15-150 keV)    in 18.96 sec:  (    ) ph/cm2/s
Energy fluence (15-150 keV)             : 0 ( 0  0 ) ergs/cm2
Single BB
Spectral model blackbody:
------------------------------------------------------------
Parameters  : value    Lower 90%  Upper 90%
kT [keV]    : 11.2639  (-1.40806  1.65996)
R^2/D10^2   : 9.70009E-02  (-0.0385926   0.0620238)
(R is the radius in km and D10 is the distance to the source in units of 10 kpc)
------------------------------------------------------------
#Fit statistic : Chi-Squared =          73.27 using 59 PHA bins.
# Reduced chi-squared =          1.285 for     57 degrees of freedom
# Null hypothesis probability =   7.210352e-02

Energy  Fluence     90% Error
[keV]   [erg/cm2]   [erg/cm2]
15- 25  4.897e-08   9.110e-09
25- 50  1.427e-07   1.992e-08
50-150  1.041e-07   3.016e-08
15-150  2.958e-07   4.076e-08
Thermal bremsstrahlung (OTTB)
Spectral model: thermal bremsstrahlung
------------------------------------------------------------
Parameters  : value         Lower 90%    Upper 90%
kT [keV]    : 99.9578       (-30.883      71.6686)
Norm        : 1.39959       (-0.197717     0.220725)
------------------------------------------------------------
#Fit statistic : Chi-Squared =          58.84 using 59 PHA bins.
# Reduced chi-squared =          1.032 for     57 degrees of freedom
# Null hypothesis probability =   4.078649e-01

Energy  Fluence     90% Error
[keV]   [erg/cm2]   [erg/cm2]
15- 25  6.936e-08   1.114e-08
25- 50  1.199e-07   1.579e-08
50-150  1.943e-07   8.586e-08
15-150  3.836e-07   1.004e-07
Double BB
Spectral model: bbodyrad<1> + bbodyrad<2>
------------------------------------------------------------
Parameters  : value         Lower 90%    Upper 90%
kT1 [keV]   : 6.49963        (-2.00726      2.16078)
R1^2/D10^2  : 0.475558        (-0.285173      1.20827)
kT2 [keV]   : 21.0629        (-6.01444      13.0401)
R2^2/D10^2  : 6.83780E-03    (-0.00573067   0.0115622)
------------------------------------------------------------
#Fit statistic : Chi-Squared =          57.46 using 59 PHA bins.
# Reduced chi-squared =          1.045 for     55 degrees of freedom
# Null hypothesis probability =   3.841755e-01

Energy  Fluence     90% Error
[keV]   [erg/cm2]   [erg/cm2]
15- 25  6.713e-08   3.630e-08
25- 50  1.224e-07   6.054e-08
50-150  1.932e-07   1.088e-07
15-150  3.827e-07   1.872e-07
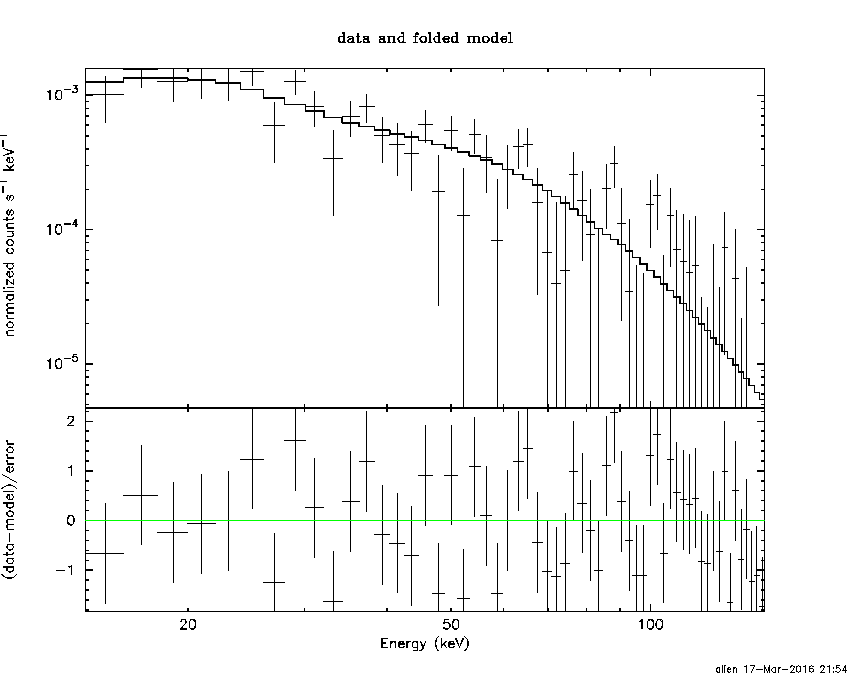
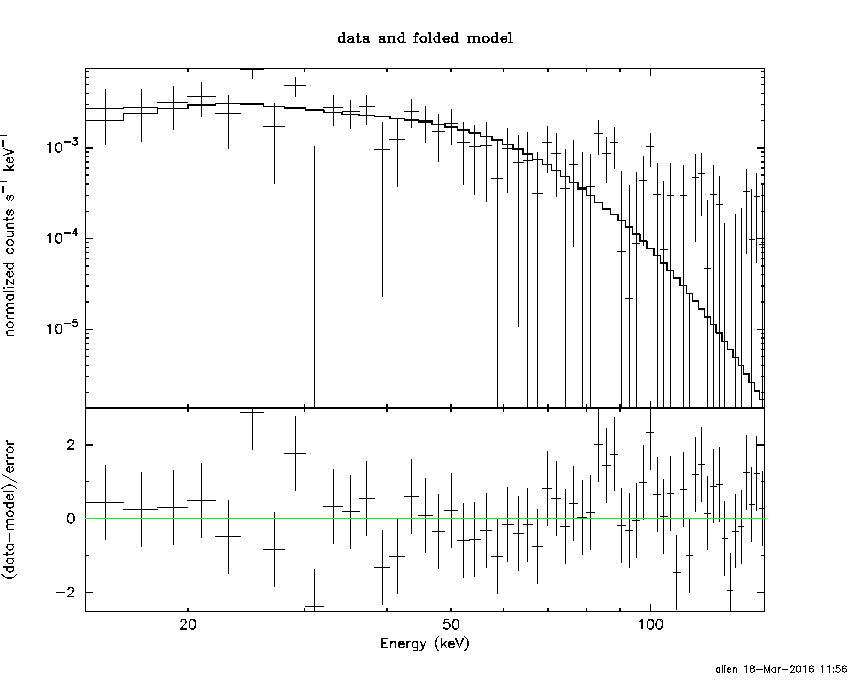
Peak spectrum fit
Power-law model
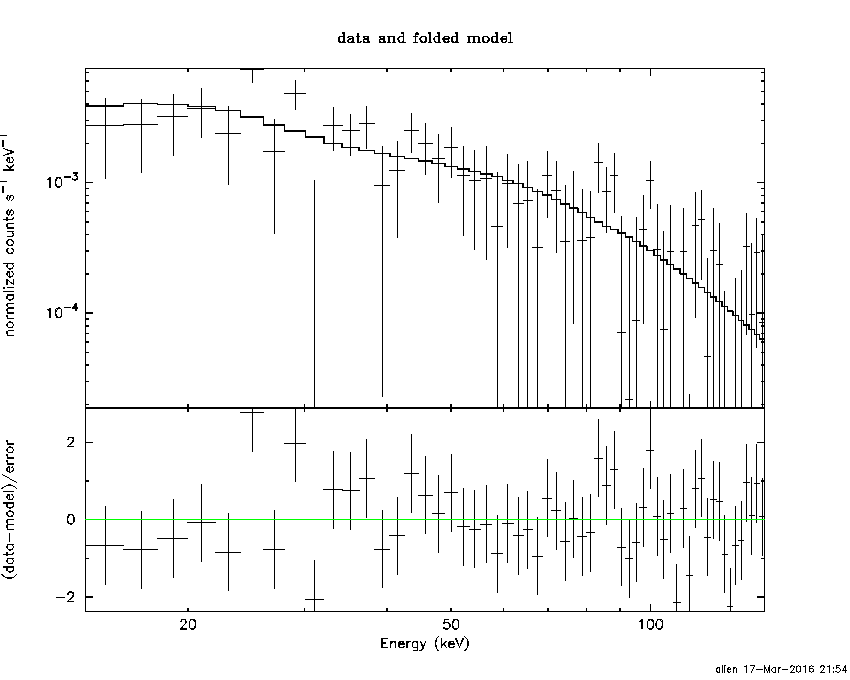
Time interval is from   -0.164 sec. to    0.836 sec.

Spectral model in power-law:
------------------------------------------------------------
Parameters  : value       lower 90%   higher 90%
Photon index: 1.48142     ( -0.252201   0.25787 )
Norm@50keV  : 8.23338E-03    ( -0.00133271   0.0013162 )
------------------------------------------------------------
#Fit statistic : Chi-Squared =          54.81 using 59 PHA bins.
# Reduced chi-squared =         0.9616 for     57 degrees of freedom
# Null hypothesis probability =   5.576729e-01

Photon flux (15-150 keV)    in 1 sec: 1.02282 ( -0.156266  0.15633 ) ph/cm2/s
Energy fluence (15-150 keV)             : 7.83592e-08 ( -1.38889e-08  1.41596e-08 ) ergs/cm2
Cutoff power-law model
Time interval is from   -0.164 sec. to    0.836 sec.
Spectral model in the cutoff power-law:
------------------------------------------------------------
Parameters  : value       lower 90%   higher 90%
Photon index: 0.723957     ( -1.36073   0.877379 )
Epeak [keV] : 77.8484      ( -25.7313 -77.8485 )
Norm@50keV  : 2.11819E-02    ( -0.0211818   0.0962996 )
------------------------------------------------------------
#Fit statistic : Chi-Squared =          53.27 using 59 PHA bins.
# Reduced chi-squared =         0.9513 for     56 degrees of freedom
# Null hypothesis probability =   5.788264e-01

Photon flux (15-150 keV)    in 1 sec: 0.998123 ( -0.160412  0.160177 ) ph/cm2/s
Energy fluence (15-150 keV)             : 7.29995e-08 ( -1.56367e-08  1.59739e-08 ) ergs/cm2
Band function
Time interval is from   -0.164 sec. to    0.836 sec.

Spectral model in the Band function:
------------------------------------------------------------
Parameters  : value       lower 90%   higher 90%
alpha       : 4.34025   ( -12.6491   -4.34025 )
beta        : -1.76458    ( -0.557725   0.348632 )
Epeak [keV] : 30.4045      ( -12.1157 20.6404 )
Norm@50keV   : 102.515    ( -102.511   38.597 )
------------------------------------------------------------
#Fit statistic : Chi-Squared =          51.81 using 59 PHA bins.
# Reduced chi-squared =         0.9420 for     55 degrees of freedom
# Null hypothesis probability =   5.972307e-01

Photon flux (15-150 keV)    in 1 sec:  (    ) ph/cm2/s
Energy fluence (15-150 keV)             : 0 ( 0  0 ) ergs/cm2
Single BB
Spectral model blackbody:
------------------------------------------------------------
Parameters  : value    Lower 90%  Upper 90%
kT [keV]    : 13.2563  (-2.29406  2.92945)
R^2/D10^2   : 0.184051  (-0.0930297   0.1758)
(R is the radius in km and D10 is the distance to the source in units of 10 kpc)
------------------------------------------------------------
#Fit statistic : Chi-Squared =          59.37 using 59 PHA bins.
# Reduced chi-squared =          1.042 for     57 degrees of freedom
# Null hypothesis probability =   3.893823e-01

Energy  Fluence     90% Error
[keV]   [erg/cm2]   [erg/cm2]
15- 25  6.856e-09   2.078e-09
25- 50  2.411e-08   5.910e-09
50-150  2.709e-08   1.008e-08
15-150  5.806e-08   1.460e-08
Thermal bremsstrahlung (OTTB)

Spectral model: thermal bremsstrahlung
------------------------------------------------------------
Parameters  : value         Lower 90%    Upper 90%
kT [keV]    : 199.344       (-96.5965      -199.356)
Norm        : 4.20343       (-0.637072     0.63746)
------------------------------------------------------------
#Fit statistic : Chi-Squared =          53.95 using 59 PHA bins.
# Reduced chi-squared =         0.9464 for     57 degrees of freedom
# Null hypothesis probability =   5.903953e-01

Energy  Fluence     90% Error
[keV]   [erg/cm2]   [erg/cm2]
15- 25  1.047e-08   5.950e-09
25- 50  2.014e-08   1.153e-08
50-150  4.416e-08   2.491e-08
15-150  7.476e-08   4.234e-08
Double BB
Spectral model: bbodyrad<1> + bbodyrad<2>
------------------------------------------------------------
Parameters  : value         Lower 90%    Upper 90%
kT1 [keV]   : 8.67864        (-3.29054      3.57961)
R1^2/D10^2  : 0.579429        (-0.365195      1.69313)
kT2 [keV]   : 31.1909        (-14.2741      -31.1909)
R2^2/D10^2  : 6.11602E-03    (-0.0057598   0.0564293)
------------------------------------------------------------
#Fit statistic : Chi-Squared =          51.84 using 59 PHA bins.
# Reduced chi-squared =         0.9425 for     55 degrees of freedom
# Null hypothesis probability =   5.962483e-01

Energy  Fluence     90% Error
[keV]   [erg/cm2]   [erg/cm2]
15- 25  9.237e-09   5.350e-09
25- 50  2.240e-08   1.279e-08
50-150  4.419e-08   2.557e-08
15-150  7.583e-08   3.850e-08
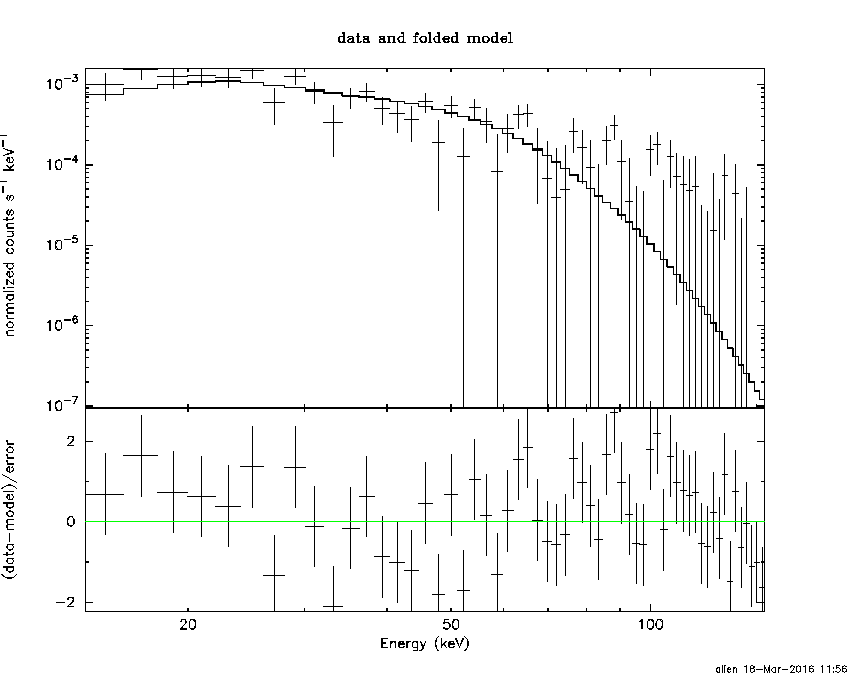
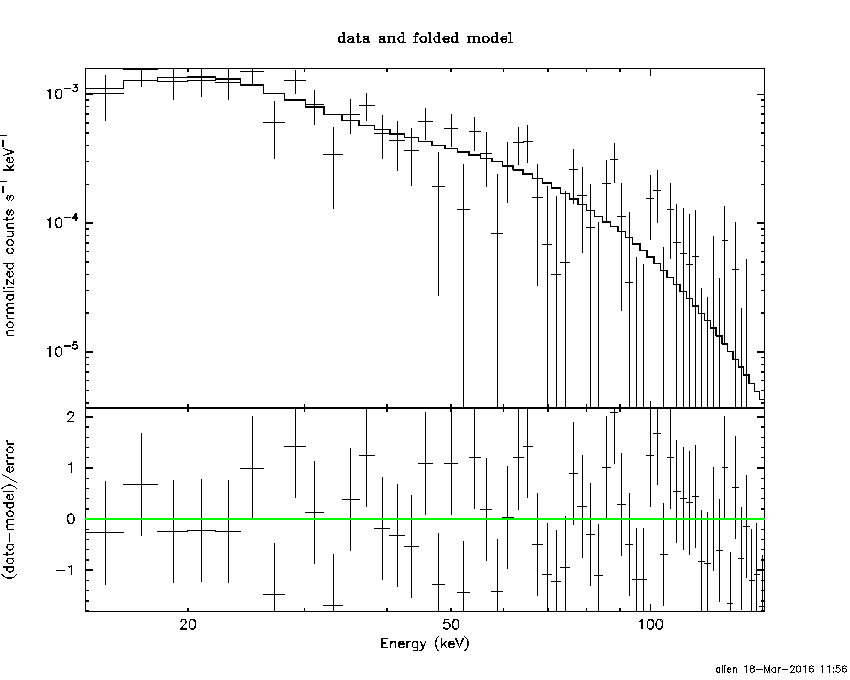
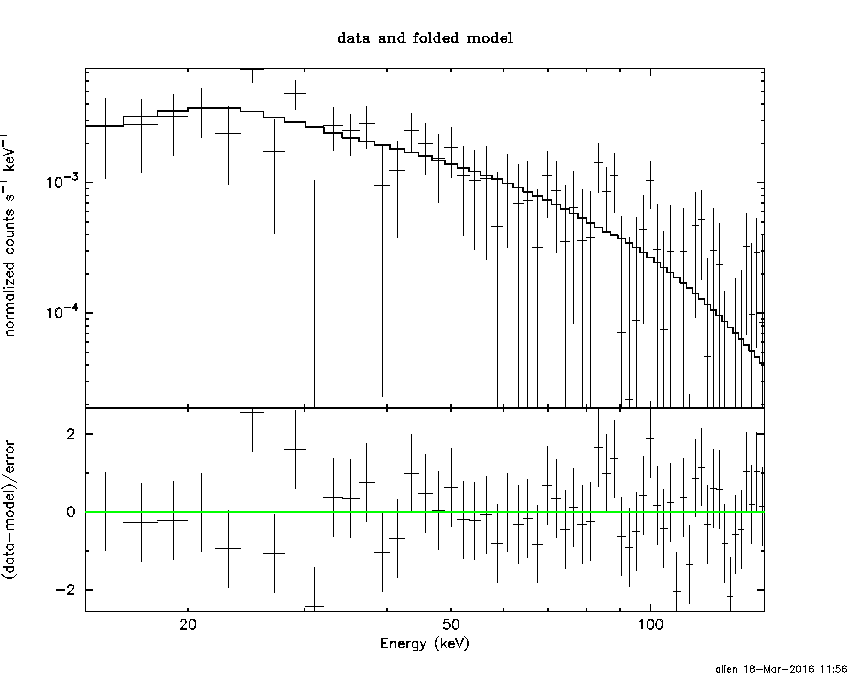
Pre-slew spectrum (Pre-slew PHA with pre-slew DRM)
Power-law model

Spectral model in power-law:
------------------------------------------------------------
Parameters  : value       lower 90%   higher 90%
Photon index: 1.75506     ( -0.186115   0.193375 )
Norm@50keV  : 2.31946E-03    ( -0.00029207   0.000286854 )
------------------------------------------------------------
#Fit statistic : Chi-Squared =          61.54 using 59 PHA bins.
# Reduced chi-squared =          1.080 for     57 degrees of freedom
# Null hypothesis probability =   3.167058e-01

Photon flux (15-150 keV)    in 18.96 sec: 0.314217 ( -0.0337533  0.0337582 ) ph/cm2/s
Energy fluence (15-150 keV)             : 4.0568e-07 ( -5.2274e-08  5.33508e-08 ) ergs/cm2
Cutoff power-law model

Spectral model in the cutoff power-law:
------------------------------------------------------------
Parameters  : value       lower 90%   higher 90%
Photon index: 1.01715     ( -0.896727   0.726132 )
Epeak [keV] : 57.9984      ( -14.705 281.262 )
Norm@50keV  : 6.03707E-03    ( -0.00362276   0.0133475 )
------------------------------------------------------------
#Fit statistic : Chi-Squared =          58.50 using 59 PHA bins.
# Reduced chi-squared =          1.045 for     56 degrees of freedom
# Null hypothesis probability =   3.837142e-01

Photon flux (15-150 keV)    in 18.96 sec: 0.306149 ( -0.034575  0.0346 ) ph/cm2/s
Energy fluence (15-150 keV)             : 3.77283e-07 ( -5.70563e-08  5.96576e-08 ) ergs/cm2
Band function

Spectral model in the Band function:
------------------------------------------------------------
Parameters  : value       lower 90%   higher 90%
alpha       : -1.01704   ( -0.430987   1.0504 )
beta        : -10.0000    ( 10   3.55271e-15 )
Epeak [keV] : 57.9866      ( -14.594 276.491 )
Norm@50keV   : 6.03740E-03    ( -0.00362364   0.0133503 )
------------------------------------------------------------
#Fit statistic : Chi-Squared =          58.50 using 59 PHA bins.
# Reduced chi-squared =          1.064 for     55 degrees of freedom
# Null hypothesis probability =   3.481590e-01

Photon flux (15-150 keV)    in 18.96 sec:  (    ) ph/cm2/s
Energy fluence (15-150 keV)             : 0 ( 0  0 ) ergs/cm2
S(25-50 keV) vs. S(50-100 keV) plot
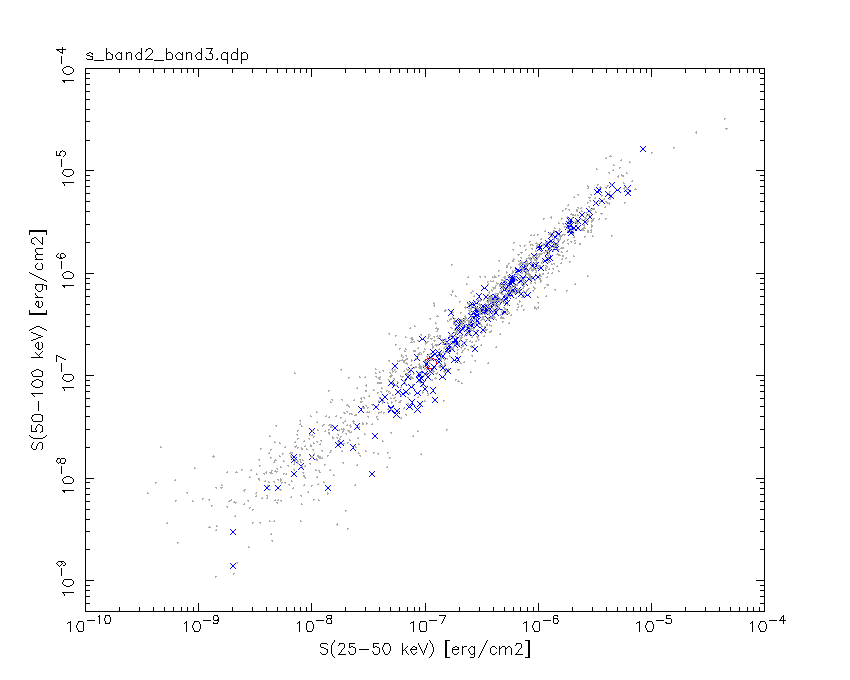
S(25-50 keV)  = 1.12e-07
S(50-100 keV) = 1.33e-07
T90 vs. Hardness ratio plot

T90                                   = 16.5639999508858 sec.
Hardness ratio (energy fluence ratio) = 1.1875
Color vs. Color plot
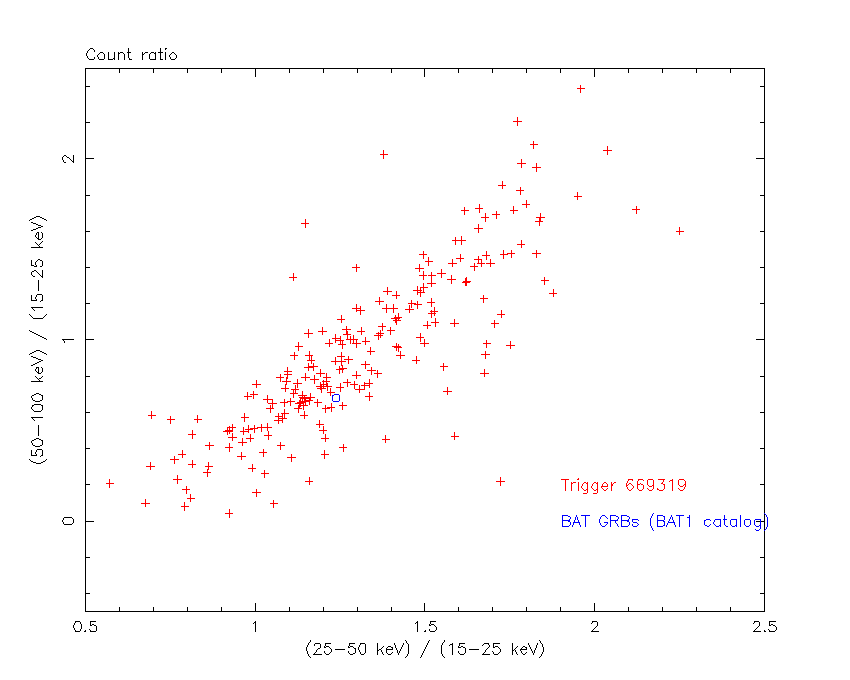
Count Ratio  (25-50 keV) / (15-25 keV) = 1.23819
Count Ratio (50-100 keV) / (15-25 keV) = 0.679424
Mask shadow pattern
IMX = 4.759261233783420E-02, IMY = 9.668638485343777E-02
TIME vs. PHA plot around the trigger time
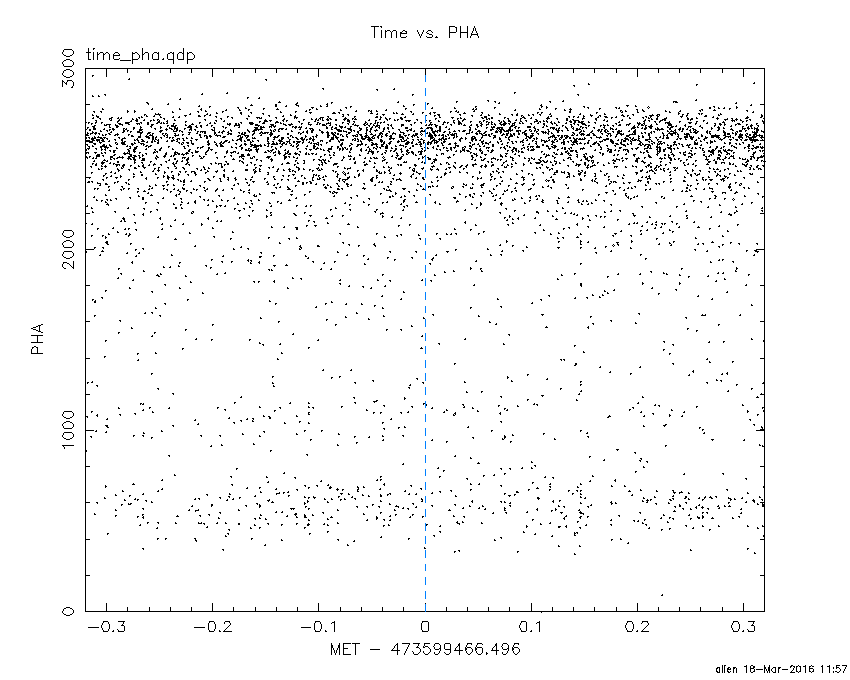
Blue+Cyan dotted lines: Time interval of the scaled map
From 0.000000 to 1.024000
TIME vs. DetID plot around the trigger time
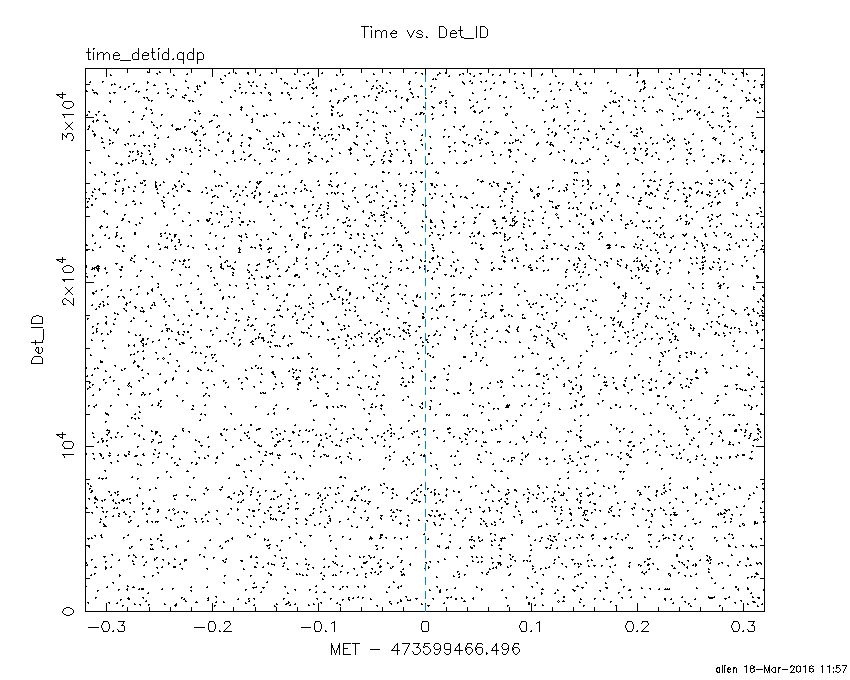
Blue+Cyan dotted lines: Time interval of the scaled map
From 0.000000 to 1.024000
100 us light curve (15-350 keV)
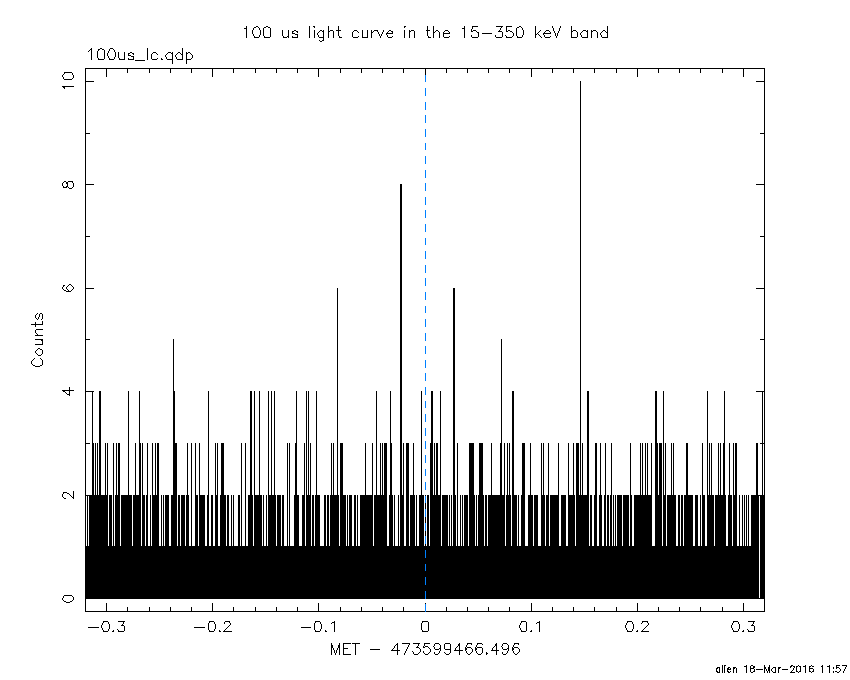
Blue+Cyan dotted lines: Time interval of the scaled map
From 0.000000 to 1.024000
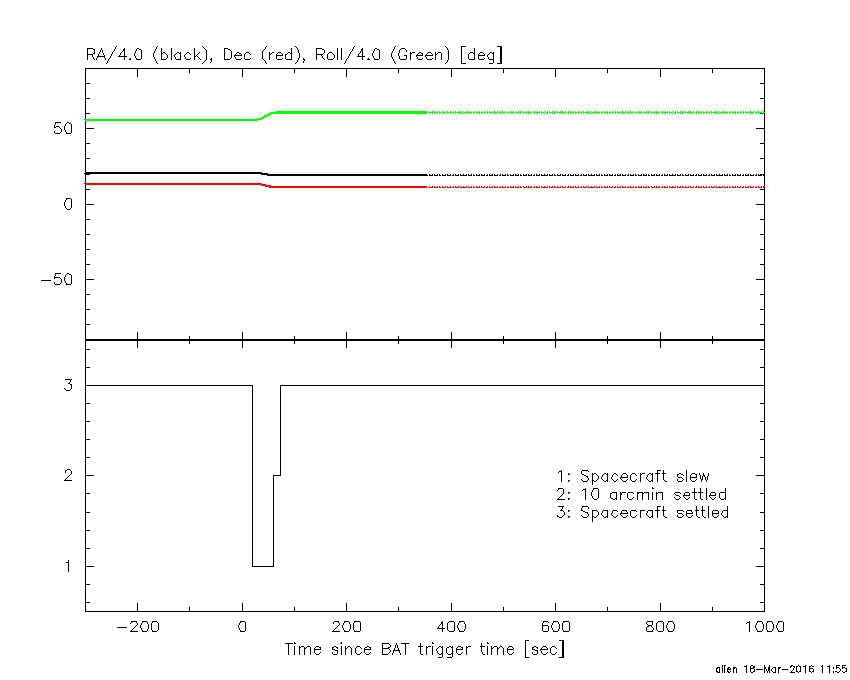
Spacecraft aspect plot
Bright source in the pre-burst/pre-slew/post-slew images
Pre-burst image of 15-350 keV band
Time interval of the image:
-441.395410 -423.506000
-239.496000 -1.312000

# RAcent  DECcent POSerr Theta    Phi  PeakCts   SNR AngSep     Name
#  [deg]    [deg]    ['] [deg]  [deg]                   [']
 83.6310  22.0164    0.3   8.5   52.5  10.9065  44.5    0.2	Crab
125.6737  -1.7056    2.4  45.3  152.9   3.4296   4.9 ------	UNKNOWN
 24.6960  42.3113    2.7  57.4   -1.5   6.2363   4.4 ------	UNKNOWN
 84.6440 -33.5671    3.1  47.1 -135.6   2.8443   3.8 ------	UNKNOWN
Pre-slew background subtracted image of 15-350 keV band
Time interval of the image:
-1.312000 17.648000

# RAcent  DECcent POSerr Theta    Phi  PeakCts   SNR AngSep     Name
#  [deg]    [deg]    ['] [deg]  [deg]                   [']
 83.6400  22.0172  605.0   8.5   52.5   0.0010   0.0    0.4	Crab
 76.8105  11.3326    0.8   6.2  -63.8   0.7573  14.8 ------	UNKNOWN
108.5411 -38.2945    2.5  57.2 -157.4   1.1765   4.5 ------	UNKNOWN
 39.7305   7.5833    2.2  42.6  -46.9   0.5913   5.2 ------	UNKNOWN
 45.0414  -1.9440    2.3  40.4  -63.1   0.6504   5.0 ------	UNKNOWN
Post-slew image of 15-350 keV band
Time interval of the image:
60.804600 840.264000
840.504000 962.598600

# RAcent  DECcent POSerr Theta    Phi  PeakCts   SNR AngSep     Name
#  [deg]    [deg]    ['] [deg]  [deg]                   [']
 83.6364  22.0159    0.2  12.5   57.7  38.8349  60.3    0.2	Crab
113.2743  13.1835    3.3  35.7  110.2   5.4131   3.5 ------	UNKNOWN
 98.5182 -39.2773    2.9  54.5 -173.5  10.3499   3.9 ------	UNKNOWN
 29.4864  50.7475    3.9  55.0   -7.5   6.1475   3.0 ------	UNKNOWN
 84.7337 -39.2377    3.4  51.1 -160.8   6.3081   3.4 ------	UNKNOWN
 65.5559 -40.7484    3.5  53.1 -142.3  15.9527   3.3 ------	UNKNOWN
Plot creation:
Fri Mar 18 11:57:38 EDT 2016