Special notes of this burst
Image
Pre-slew 15.0-350.0 keV image (Event data)
#   RAcent    DECcent   POSerr    Theta     Phi              Peak Cts       SNR   Name
  211.9171    20.4524   0.0176    30.3117  -177.9633         1.3874610     10.894 TRIG_00671014

Foreground time interval of the image:
 32.584  96.701 (delta_t =  64.117 [sec])
Background time interval of the image:
-239.000  32.584 (delta_t = 271.584 [sec])
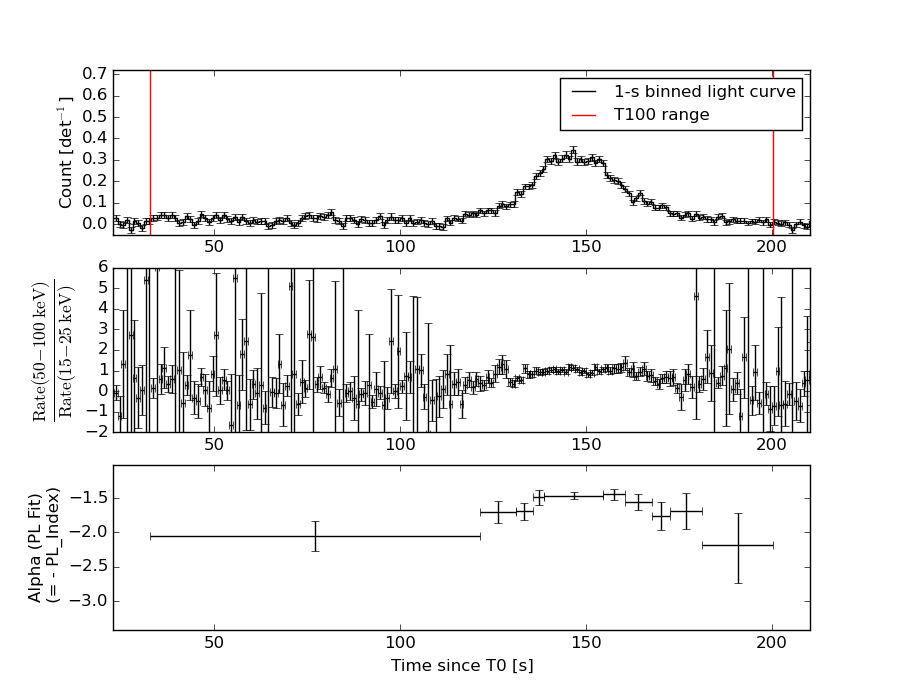
Lightcurves
Notes:
- 1) The mask-weighted light curves are using the flight position.
- 2) Multiple plots of different time binning/intervals are shown to cover all scenarios of short/long GRBs, rate/image triggers, and real/false positives.
- 3) For all the mask-weighted lightcurves, the y-axis units are counts/sec/det where a det is 0.4 x 0.4 = 0.16 sq cm.
- 4) The verticle lines correspond to following: green dotted lines are T50 interval, black dotted lines are T90 interval, blue solid line(s) is a spacecraft slew start time, and orange solid line(s) is a spacecraft slew end time.
- 5) Time of each bin is in the middle of the bin.
1 s binning
From T0-310 s to T0+310 s

From T100_start - 20 s to T100_end + 30 s

Full time interval

64 ms binning
Full time interval

From T100_start to T100_end
From T0-5 sec to T0+5 sec
16 ms binning
From T100_start-5 s to T100_start+5 s
8 ms binning
From T100_start-3 s to T100_start+3 s
2 ms binning
From T100_start-1 s to T100_start+1 s
SN=5 or 10 sec. binning (whichever binning is satisfied first)
SN=5 or 10 sec. binning (T < 200 sec)

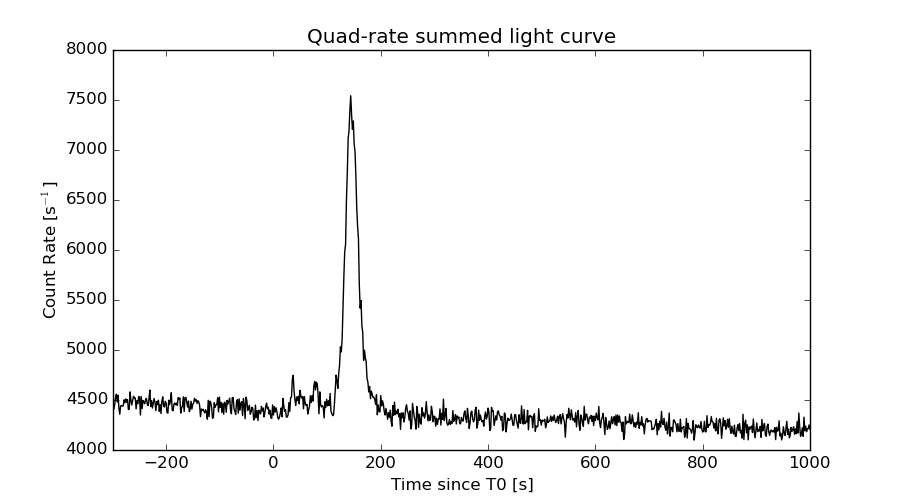
Quad-rate summed light curves (from T0-300s to T0+1000s)
Spectral Evolution
Spectra
Notes:
- 1) The fitting includes the systematic errors.
- 2) When the burst includes telescope slew time periods, the fitting uses an average response file made from multiple 5-s response files through out the slew time plus single time preiod for the non-slew times, and weighted by the total counts in the corresponding time period using addrmf. An average response file is needed becuase a spectral fit using the pre-slew DRM will introduce some errors in both a spectral shape and a normalization if the PHA file contains a lot of the slew/post-slew time interval.
- 3) For fits to more complicated models (e.g. a power-law over a cutoff power-law), the BAT team has decided to require a chi-square improvement of more than 6 for each extra dof.
Time averaged spectrum fit using the average DRM
Power-law model
Time interval is from   32.584 sec. to  200.228 sec.

Spectral model in power-law:
------------------------------------------------------------
Parameters  : value       lower 90%   higher 90%
Photon index: 1.62789     ( -0.0562322   0.0564148 )
Norm@50keV  : 4.41652E-03    ( -0.000123623   0.000123473 )
------------------------------------------------------------
#Fit statistic : Chi-Squared =          48.04 using 59 PHA bins.
# Reduced chi-squared =         0.8428 for     57 degrees of freedom
# Null hypothesis probability =   7.950532e-01

Photon flux (15-150 keV)    in 167.6 sec: 0.572576 ( -0.017639  0.017707 ) ph/cm2/s
Energy fluence (15-150 keV)             : 6.9012e-06 ( -2.03678e-07  2.04128e-07 ) ergs/cm2
Cutoff power-law model

Time interval is from   32.584 sec. to  200.228 sec.
Spectral model in the cutoff power-law:
------------------------------------------------------------
Parameters  : value       lower 90%   higher 90%
Photon index: 1.62550     ( -0.104876   0.0572048 )
Epeak [keV] : 9999.36      ( -9999.36 -9999.36 )
Norm@50keV  : 4.42202E-03    ( -0.000124114   0.000505835 )
------------------------------------------------------------
#Fit statistic : Chi-Squared =          48.09 using 59 PHA bins.
# Reduced chi-squared =         0.8587 for     56 degrees of freedom
# Null hypothesis probability =   7.649038e-01

Photon flux (15-150 keV)    in 167.6 sec: 0.572492 ( -0.017642  0.017712 ) ph/cm2/s
Energy fluence (15-150 keV)             : 6.97516e-06 ( -2.78873e-07  1.28857e-07 ) ergs/cm2
Band function
Time interval is from   32.584 sec. to  200.228 sec.

Spectral model in the Band function:
------------------------------------------------------------
Parameters  : value       lower 90%   higher 90%
alpha       : 4.94814   ( -4.94814   -4.94814 )
beta        : -1.63334    ( -0.0575213   0.0570063 )
Epeak [keV] : 18.8581      ( -18.8581 4.14907 )
Norm@50keV   : 2790.82    ( -77.1127   2.43482e+06 )
------------------------------------------------------------
#Fit statistic : Chi-Squared =          47.86 using 59 PHA bins.
# Reduced chi-squared =         0.8701 for     55 degrees of freedom
# Null hypothesis probability =   7.416897e-01

Photon flux (15-150 keV)    in 167.6 sec:  (    ) ph/cm2/s
Energy fluence (15-150 keV)             : 0 ( 0  0 ) ergs/cm2
Single BB
Spectral model blackbody:
------------------------------------------------------------
Parameters  : value    Lower 90%  Upper 90%
kT [keV]    : 15.1736  (  )
R^2/D10^2   : 5.64448E-02  (   )
(R is the radius in km and D10 is the distance to the source in units of 10 kpc)
------------------------------------------------------------
#Fit statistic : Chi-Squared =         394.00 using 59 PHA bins.
# Reduced chi-squared =         6.9123 for     57 degrees of freedom
# Null hypothesis probability =   7.051440e-52

Energy  Fluence     90% Error
[keV]   [erg/cm2]   [erg/cm2]
15- 25  4.551e-07   2.623e-08
25- 50  1.828e-06   7.291e-08
50-150  2.878e-06   1.601e-07
15-150  5.161e-06   1.710e-07
Thermal bremsstrahlung (OTTB)
Spectral model: thermal bremsstrahlung
------------------------------------------------------------
Parameters  : value         Lower 90%    Upper 90%
kT [keV]    : 189.021       (-28.9332      -187.929)
Norm        : 2.27816       (-0.071666     0.0782343)
------------------------------------------------------------
#Fit statistic : Chi-Squared =          62.30 using 59 PHA bins.
# Reduced chi-squared =          1.093 for     57 degrees of freedom
# Null hypothesis probability =   2.933781e-01

Energy  Fluence     90% Error
[keV]   [erg/cm2]   [erg/cm2]
15- 25  9.572e-07   4.986e-08
25- 50  1.830e-06   1.203e-07
50-150  3.941e-06   9.461e-07
15-150  6.728e-06   1.047e-06
Double BB

Spectral model: bbodyrad<1> + bbodyrad<2>
------------------------------------------------------------
Parameters  : value         Lower 90%    Upper 90%
kT1 [keV]   : 6.96145        (-0.690639      0.734609)
R1^2/D10^2  : 0.666817        (-0.202175      0.321071)
kT2 [keV]   : 28.7890        (-3.07707      4.12596)
R2^2/D10^2  : 4.85757E-03    (-0.00177757   0.00239101)
------------------------------------------------------------
#Fit statistic : Chi-Squared =          61.95 using 59 PHA bins.
# Reduced chi-squared =          1.126 for     55 degrees of freedom
# Null hypothesis probability =   2.420600e-01

Energy  Fluence     90% Error
[keV]   [erg/cm2]   [erg/cm2]
15- 25  9.733e-07   8.556e-08
25- 50  1.828e-06   1.023e-07
50-150  4.090e-06   3.394e-07
15-150  6.891e-06   4.307e-07
Peak spectrum fit
Power-law model

Time interval is from  146.056 sec. to  147.056 sec.

Spectral model in power-law:
------------------------------------------------------------
Parameters  : value       lower 90%   higher 90%
Photon index: 1.45336     ( -0.117684   0.118749 )
Norm@50keV  : 2.24557E-02    ( -0.00160199   0.00159588 )
------------------------------------------------------------
#Fit statistic : Chi-Squared =          62.11 using 59 PHA bins.
# Reduced chi-squared =          1.090 for     57 degrees of freedom
# Null hypothesis probability =   2.990448e-01

Photon flux (15-150 keV)    in 1 sec: 2.76973 ( -0.194  0.19411 ) ph/cm2/s
Energy fluence (15-150 keV)             : 2.14778e-07 ( -1.69399e-08  1.70789e-08 ) ergs/cm2
Cutoff power-law model

Time interval is from  146.056 sec. to  147.056 sec.
Spectral model in the cutoff power-law:
------------------------------------------------------------
Parameters  : value       lower 90%   higher 90%
Photon index: 0.999132     ( -0.504644   0.451765 )
Epeak [keV] : 111.078      ( -34.8947 4691.82 )
Norm@50keV  : 3.80753E-02    ( -0.0151975   0.0292961 )
------------------------------------------------------------
#Fit statistic : Chi-Squared =          59.15 using 59 PHA bins.
# Reduced chi-squared =          1.056 for     56 degrees of freedom
# Null hypothesis probability =   3.612720e-01

Photon flux (15-150 keV)    in 1 sec: 2.72113 ( -0.2002  0.20002 ) ph/cm2/s
Energy fluence (15-150 keV)             : 2.08113e-07 ( -1.83245e-08  1.83723e-08 ) ergs/cm2
Band function

Time interval is from  146.056 sec. to  147.056 sec.

Spectral model in the Band function:
------------------------------------------------------------
Parameters  : value       lower 90%   higher 90%
alpha       : -0.999082   ( -0.342957   0.54863 )
beta        : -10.0000    ( 10   7.10543e-15 )
Epeak [keV] : 111.053      ( -26.5692 1468.53 )
Norm@50keV   : 3.80745E-02    ( -0.0152114   0.0292901 )
------------------------------------------------------------
#Fit statistic : Chi-Squared =          59.15 using 59 PHA bins.
# Reduced chi-squared =          1.075 for     55 degrees of freedom
# Null hypothesis probability =   3.265576e-01

Photon flux (15-150 keV)    in 1 sec:  (    ) ph/cm2/s
Energy fluence (15-150 keV)             : 0 ( 0  0 ) ergs/cm2
Single BB

Spectral model blackbody:
------------------------------------------------------------
Parameters  : value    Lower 90%  Upper 90%
kT [keV]    : 15.4023  (-1.31818  1.46586)
R^2/D10^2   : 0.292237  (-0.0790348   0.106549)
(R is the radius in km and D10 is the distance to the source in units of 10 kpc)
------------------------------------------------------------
#Fit statistic : Chi-Squared =         100.43 using 59 PHA bins.
# Reduced chi-squared =         1.7620 for     57 degrees of freedom
# Null hypothesis probability =   3.398014e-04

Energy  Fluence     90% Error
[keV]   [erg/cm2]   [erg/cm2]
15- 25  1.445e-08   1.930e-09
25- 50  5.880e-08   5.205e-09
50-150  9.603e-08   1.336e-08
15-150  1.693e-07   1.600e-08
Thermal bremsstrahlung (OTTB)

Spectral model: thermal bremsstrahlung
------------------------------------------------------------
Parameters  : value         Lower 90%    Upper 90%
kT [keV]    : 200.000       (-35.453      -200)
Norm        : 11.3487       (-0.78574     0.78574)
------------------------------------------------------------
#Fit statistic : Chi-Squared =          61.61 using 59 PHA bins.
# Reduced chi-squared =          1.081 for     57 degrees of freedom
# Null hypothesis probability =   3.147720e-01

Energy  Fluence     90% Error
[keV]   [erg/cm2]   [erg/cm2]
15- 25  2.836e-08   2.270e-09
25- 50  5.455e-08   5.610e-09
50-150  1.196e-07   3.096e-08
15-150  2.025e-07   3.565e-08
Double BB

Spectral model: bbodyrad<1> + bbodyrad<2>
------------------------------------------------------------
Parameters  : value         Lower 90%    Upper 90%
kT1 [keV]   : 6.49206        (-1.72583      2.09396)
R1^2/D10^2  : 3.24680        (-1.90119      6.68175)
kT2 [keV]   : 23.7799        (-4.11935      7.34796)
R2^2/D10^2  : 5.29916E-02    (-0.0334664   0.0332839)
------------------------------------------------------------
#Fit statistic : Chi-Squared =          59.64 using 59 PHA bins.
# Reduced chi-squared =          1.084 for     55 degrees of freedom
# Null hypothesis probability =   3.109026e-01

Energy  Fluence     90% Error
[keV]   [erg/cm2]   [erg/cm2]
15- 25  2.553e-08   7.625e-09
25- 50  5.331e-08   1.312e-08
50-150  1.274e-07   3.438e-08
15-150  2.063e-07   5.851e-08
Pre-slew spectrum (Pre-slew PHA with pre-slew DRM)
Power-law model
Spectral model in power-law:
------------------------------------------------------------
Parameters  : value       lower 90%   higher 90%
Photon index: 1.90855     ( -0.231154   0.244278 )
Norm@50keV  : 1.31474E-03    ( -0.000208284   0.000202267 )
------------------------------------------------------------
#Fit statistic : Chi-Squared =          48.34 using 59 PHA bins.
# Reduced chi-squared =         0.8481 for     57 degrees of freedom
# Null hypothesis probability =   7.859535e-01

Photon flux (15-150 keV)    in 64.12 sec: 0.189368 ( -0.0238393  0.0238426 ) ph/cm2/s
Energy fluence (15-150 keV)             : 7.75108e-07 ( -1.17973e-07  1.20856e-07 ) ergs/cm2
Cutoff power-law model

Spectral model in the cutoff power-law:
------------------------------------------------------------
Parameters  : value       lower 90%   higher 90%
Photon index: 1.85970     ( -1.00395   0.594569 )
Epeak [keV] : 119.279      (   )
Norm@50keV  : 1.40415E-03    (     )
------------------------------------------------------------
#Fit statistic : Chi-Squared =          48.33 using 59 PHA bins.
# Reduced chi-squared =         0.8631 for     56 degrees of freedom
# Null hypothesis probability =   7.569270e-01

Photon flux (15-150 keV)    in 64.12 sec: 0.189016 ( -0.024447  0.024091 ) ph/cm2/s
Energy fluence (15-150 keV)             : 7.71037e-07 ( -1.41589e-07  1.23758e-07 ) ergs/cm2
Band function
Spectral model in the Band function:
------------------------------------------------------------
Parameters  : value       lower 90%   higher 90%
alpha       : 4.89544   ( -4.89544   -4.89544 )
beta        : -2.03163    ( -0.362507   0.273548 )
Epeak [keV] : 21.9514      ( -21.9514 4.49703 )
Norm@50keV   : 388.520    ( -48.608   1.49291e+06 )
------------------------------------------------------------
#Fit statistic : Chi-Squared =          46.95 using 59 PHA bins.
# Reduced chi-squared =         0.8537 for     55 degrees of freedom
# Null hypothesis probability =   7.715036e-01

Photon flux (15-150 keV)    in 64.12 sec:  (    ) ph/cm2/s
Energy fluence (15-150 keV)             : 0 ( 0  0 ) ergs/cm2
S(25-50 keV) vs. S(50-100 keV) plot
S(25-50 keV)  = 1.81e-06
S(50-100 keV) = 2.35e-06
T90 vs. Hardness ratio plot

T90                                   = 120.13999992609 sec.
Hardness ratio (energy fluence ratio) = 1.29834
Color vs. Color plot

Count Ratio  (25-50 keV) / (15-25 keV) = 1.17094
Count Ratio (50-100 keV) / (15-25 keV) = 0.808427
Mask shadow pattern

IMX = -5.842577038141209E-01, IMY = 2.077777516912401E-02
TIME vs. PHA plot around the trigger time

TIME vs. DetID plot around the trigger time
100 us light curve (15-350 keV)

Spacecraft aspect plot

Bright source in the pre-burst/pre-slew/post-slew images
Pre-burst image of 15-350 keV band
Time interval of the image:
-239.000000 32.584000

# RAcent  DECcent POSerr Theta    Phi  PeakCts   SNR AngSep     Name
#  [deg]    [deg]    ['] [deg]  [deg]                   [']
170.1601 -60.5728    4.2  58.4  -13.9   3.4219   2.7    5.5	Cen X-3
186.4712 -62.8332    8.7  57.7  -23.3  -1.6601  -1.3    6.3	GX 301-2
200.3227  -6.5026    2.2   4.3 -105.5   1.1987   5.3 ------	UNKNOWN
173.0090 -58.9735    2.6  56.3  -14.4   3.9629   4.5 ------	UNKNOWN
228.5665 -27.7896    2.7  38.0  -78.9   2.9652   4.3 ------	UNKNOWN
Pre-slew background subtracted image of 15-350 keV band
Time interval of the image:
32.584000 96.700610

# RAcent  DECcent POSerr Theta    Phi  PeakCts   SNR AngSep     Name
#  [deg]    [deg]    ['] [deg]  [deg]                   [']
170.2543 -60.6351    7.9  58.4  -13.9  -0.7903  -1.4    1.9	Cen X-3
186.8441 -62.8221    7.6  57.7  -23.5  -0.8026  -1.5    6.0	GX 301-2
164.5144   0.1323    2.4  32.0   70.7   1.0129   4.9 ------	UNKNOWN
217.2233  30.3531    2.4  41.2  179.8   0.8372   4.8 ------	UNKNOWN
211.9171  20.4525    1.1  30.3 -178.0   1.3880  10.9 ------	UNKNOWN
Post-slew image of 15-350 keV band
Time interval of the image:
149.100590 963.076800

# RAcent  DECcent POSerr Theta    Phi  PeakCts   SNR AngSep     Name
#  [deg]    [deg]    ['] [deg]  [deg]                   [']
254.4576  35.3425  186.8  40.1 -140.5   0.0625   0.1    0.0	Her X-1
184.9403 -25.4085    3.2  52.8   11.4   6.7292   3.6 ------	UNKNOWN
222.5530  61.2440    3.5  41.5  168.2   3.1994   3.3 ------	UNKNOWN
241.6970  65.6912    3.1  49.2  176.2   5.7395   3.7 ------	UNKNOWN
211.9203  20.4739    1.3   0.0 -149.1   4.3234   8.6 ------	UNKNOWN
234.1636  26.2945    2.6  21.2 -129.7   2.6315   4.5 ------	UNKNOWN
258.2812  50.3852    3.7  47.0 -160.4   3.7112   3.1 ------	UNKNOWN
256.6353  15.5770    3.2  42.7 -110.6   9.8344   3.6 ------	UNKNOWN
Plot creation:
Fri Mar 18 11:51:50 EDT 2016