Special notes of this burst
Image
Pre-slew 15.0-350.0 keV image (Event data)

#   RAcent    DECcent   POSerr    Theta     Phi              Peak Cts       SNR   Name
  109.0798   -23.5894   0.0079    22.8322     7.7037         1.0218882     24.224 TRIG_00671231

Foreground time interval of the image:
 -0.028  11.061 (delta_t =  11.089 [sec])
Background time interval of the image:
-239.440  -0.028 (delta_t = 239.412 [sec])
Lightcurves
Notes:
- 1) The mask-weighted light curves are using the flight position.
- 2) Multiple plots of different time binning/intervals are shown to cover all scenarios of short/long GRBs, rate/image triggers, and real/false positives.
- 3) For all the mask-weighted lightcurves, the y-axis units are counts/sec/det where a det is 0.4 x 0.4 = 0.16 sq cm.
- 4) The verticle lines correspond to following: green dotted lines are T50 interval, black dotted lines are T90 interval, blue solid line(s) is a spacecraft slew start time, and orange solid line(s) is a spacecraft slew end time.
- 5) Time of each bin is in the middle of the bin.
1 s binning
From T0-310 s to T0+310 s

From T100_start - 20 s to T100_end + 30 s
Full time interval

64 ms binning
Full time interval

From T100_start to T100_end

From T0-5 sec to T0+5 sec
16 ms binning
From T100_start-5 s to T100_start+5 s

Blue+Cyan dotted lines: Time interval of the scaled map
From 0.000000 to 1.024000
8 ms binning
From T100_start-3 s to T100_start+3 s

Blue+Cyan dotted lines: Time interval of the scaled map
From 0.000000 to 1.024000
2 ms binning
From T100_start-1 s to T100_start+1 s

Blue+Cyan dotted lines: Time interval of the scaled map
From 0.000000 to 1.024000
SN=5 or 10 sec. binning (whichever binning is satisfied first)
SN=5 or 10 sec. binning (T < 200 sec)

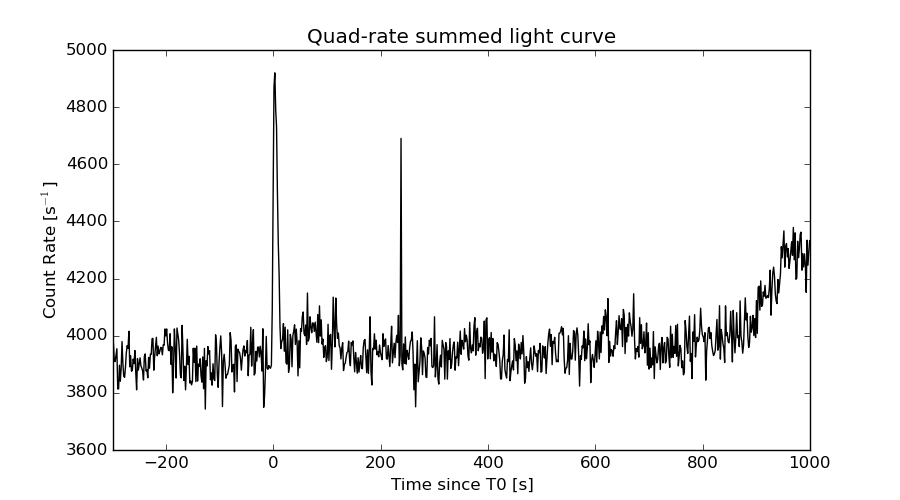
Quad-rate summed light curves (from T0-300s to T0+1000s)
Spectral Evolution

Spectra
Notes:
- 1) The fitting includes the systematic errors.
- 2) When the burst includes telescope slew time periods, the fitting uses an average response file made from multiple 5-s response files through out the slew time plus single time preiod for the non-slew times, and weighted by the total counts in the corresponding time period using addrmf. An average response file is needed becuase a spectral fit using the pre-slew DRM will introduce some errors in both a spectral shape and a normalization if the PHA file contains a lot of the slew/post-slew time interval.
- 3) For fits to more complicated models (e.g. a power-law over a cutoff power-law), the BAT team has decided to require a chi-square improvement of more than 6 for each extra dof.
Time averaged spectrum fit using the average DRM
Power-law model

Time interval is from   -0.028 sec. to   14.972 sec.

Spectral model in power-law:
------------------------------------------------------------
Parameters  : value       lower 90%   higher 90%
Photon index: 1.77266     ( -0.12854   0.131438 )
Norm@50keV  : 4.43238E-03    ( -0.000363907   0.000360102 )
------------------------------------------------------------
#Fit statistic : Chi-Squared =          46.64 using 59 PHA bins.
# Reduced chi-squared =         0.8183 for     57 degrees of freedom
# Null hypothesis probability =   8.345749e-01

Photon flux (15-150 keV)    in 15 sec: 0.604448 ( -0.045036  0.045072 ) ph/cm2/s
Energy fluence (15-150 keV)             : 6.1286e-07 ( -5.14609e-08  5.20174e-08 ) ergs/cm2
Cutoff power-law model

Time interval is from   -0.028 sec. to   14.972 sec.
Spectral model in the cutoff power-law:
------------------------------------------------------------
Parameters  : value       lower 90%   higher 90%
Photon index: 1.04567     ( -0.629082   0.549155 )
Epeak [keV] : 59.5825      ( -11.261 44.8546 )
Norm@50keV  : 1.10122E-02    ( -0.00538645   0.0129789 )
------------------------------------------------------------
#Fit statistic : Chi-Squared =          41.35 using 59 PHA bins.
# Reduced chi-squared =         0.7383 for     56 degrees of freedom
# Null hypothesis probability =   9.283549e-01

Photon flux (15-150 keV)    in 15 sec: 0.586432 ( -0.047017  0.047012 ) ph/cm2/s
Energy fluence (15-150 keV)             : 5.75124e-07 ( -5.71579e-08  5.85432e-08 ) ergs/cm2
Band function

Time interval is from   -0.028 sec. to   14.972 sec.

Spectral model in the Band function:
------------------------------------------------------------
Parameters  : value       lower 90%   higher 90%
alpha       : -1.03533   ( -0.564007   1.01834 )
beta        : -2.59436    ( 2.647   0.815139 )
Epeak [keV] : 59.1680      ( -31.2242 41.224 )
Norm@50keV   : 1.11611E-02    ( -0.00597402   0.946259 )
------------------------------------------------------------
#Fit statistic : Chi-Squared =          41.29 using 59 PHA bins.
# Reduced chi-squared =         0.7506 for     55 degrees of freedom
# Null hypothesis probability =   9.147355e-01

Photon flux (15-150 keV)    in 15 sec:  (    ) ph/cm2/s
Energy fluence (15-150 keV)             : 0 ( 0  0 ) ergs/cm2
Single BB

Spectral model blackbody:
------------------------------------------------------------
Parameters  : value    Lower 90%  Upper 90%
kT [keV]    : 12.0842  (-1.02059  1.12187)
R^2/D10^2   : 0.142996  (-0.040411   0.0556908)
(R is the radius in km and D10 is the distance to the source in units of 10 kpc)
------------------------------------------------------------
#Fit statistic : Chi-Squared =          71.39 using 59 PHA bins.
# Reduced chi-squared =          1.252 for     57 degrees of freedom
# Null hypothesis probability =   9.517257e-02

Energy  Fluence     90% Error
[keV]   [erg/cm2]   [erg/cm2]
15- 25  6.629e-08   8.618e-09
25- 50  2.103e-07   1.785e-08
50-150  1.855e-07   3.204e-08
15-150  4.621e-07   4.372e-08
Thermal bremsstrahlung (OTTB)

Spectral model: thermal bremsstrahlung
------------------------------------------------------------
Parameters  : value         Lower 90%    Upper 90%
kT [keV]    : 104.521       (-25.224      39.301)
Norm        : 2.65095       (-0.258457     0.302926)
------------------------------------------------------------
#Fit statistic : Chi-Squared =          41.83 using 59 PHA bins.
# Reduced chi-squared =         0.7339 for     57 degrees of freedom
# Null hypothesis probability =   9.340196e-01

Energy  Fluence     90% Error
[keV]   [erg/cm2]   [erg/cm2]
15- 25  1.039e-07   1.237e-08
25- 50  1.813e-07   1.523e-08
50-150  3.011e-07   1.050e-07
15-150  5.863e-07   1.154e-07
Double BB

Spectral model: bbodyrad<1> + bbodyrad<2>
------------------------------------------------------------
Parameters  : value         Lower 90%    Upper 90%
kT1 [keV]   : 5.93880        (-1.62225      2.0003)
R1^2/D10^2  : 1.12752        (-0.673297      2.52805)
kT2 [keV]   : 18.6949        (-3.49792      7.06278)
R2^2/D10^2  : 2.16165E-02    (-0.0158548   0.0170478)
------------------------------------------------------------
#Fit statistic : Chi-Squared =          41.78 using 59 PHA bins.
# Reduced chi-squared =         0.7597 for     55 degrees of freedom
# Null hypothesis probability =   9.054405e-01

Energy  Fluence     90% Error
[keV]   [erg/cm2]   [erg/cm2]
15- 25  1.005e-07   4.647e-08
25- 50  1.827e-07   6.251e-08
50-150  2.794e-07   1.375e-07
15-150  5.625e-07   1.876e-07
Peak spectrum fit
Power-law model

Time interval is from    2.760 sec. to    3.760 sec.

Spectral model in power-law:
------------------------------------------------------------
Parameters  : value       lower 90%   higher 90%
Photon index: 1.81961     ( -0.243769   0.258038 )
Norm@50keV  : 8.46667E-03    ( -0.00146777   0.00143137 )
------------------------------------------------------------
#Fit statistic : Chi-Squared =          56.25 using 59 PHA bins.
# Reduced chi-squared =         0.9868 for     57 degrees of freedom
# Null hypothesis probability =   5.032577e-01

Photon flux (15-150 keV)    in 1 sec: 1.17574 ( -0.17157  0.1716 ) ph/cm2/s
Energy fluence (15-150 keV)             : 7.79094e-08 ( -1.34316e-08  1.37211e-08 ) ergs/cm2
Cutoff power-law model

Time interval is from    2.760 sec. to    3.760 sec.
Spectral model in the cutoff power-law:
------------------------------------------------------------
Parameters  : value       lower 90%   higher 90%
Photon index: 0.929266     ( -1.36922   1.00837 )
Epeak [keV] : 51.4799      ( -15.3408 -51.48 )
Norm@50keV  : 2.73814E-02    ( -0.0273814   0.141013 )
------------------------------------------------------------
#Fit statistic : Chi-Squared =          54.16 using 59 PHA bins.
# Reduced chi-squared =         0.9672 for     56 degrees of freedom
# Null hypothesis probability =   5.446295e-01

Photon flux (15-150 keV)    in 1 sec: 1.15009 ( -0.174238  0.17429 ) ph/cm2/s
Energy fluence (15-150 keV)             : 7.2124e-08 ( -1.40636e-08  1.5145e-08 ) ergs/cm2
Band function

Time interval is from    2.760 sec. to    3.760 sec.

Spectral model in the Band function:
------------------------------------------------------------
Parameters  : value       lower 90%   higher 90%
alpha       : -0.929175   ( -0.829161   1.15564 )
beta        : -10.00000    ( 10   3.2905e-09 )
Epeak [keV] : 51.4693      ( -14.4518 -51.4693 )
Norm@50keV   : 2.73834E-02    ( -0.0163064   0.141482 )
------------------------------------------------------------
#Fit statistic : Chi-Squared =          54.16 using 59 PHA bins.
# Reduced chi-squared =         0.9848 for     55 degrees of freedom
# Null hypothesis probability =   5.065112e-01

Photon flux (15-150 keV)    in 1 sec:  (    ) ph/cm2/s
Energy fluence (15-150 keV)             : 0 ( 0  0 ) ergs/cm2
Single BB

Spectral model blackbody:
------------------------------------------------------------
Parameters  : value    Lower 90%  Upper 90%
kT [keV]    : 11.0591  (-1.69632  2.03683)
R^2/D10^2   : 0.396916  (-0.187253   0.341066)
(R is the radius in km and D10 is the distance to the source in units of 10 kpc)
------------------------------------------------------------
#Fit statistic : Chi-Squared =          61.19 using 59 PHA bins.
# Reduced chi-squared =          1.073 for     57 degrees of freedom
# Null hypothesis probability =   3.281163e-01

Energy  Fluence     90% Error
[keV]   [erg/cm2]   [erg/cm2]
15- 25  1.015e-08   2.919e-09
25- 50  2.891e-08   6.290e-09
50-150  2.005e-08   7.325e-09
15-150  5.912e-08   1.270e-08
Thermal bremsstrahlung (OTTB)

Spectral model: thermal bremsstrahlung
------------------------------------------------------------
Parameters  : value         Lower 90%    Upper 90%
kT [keV]    : 88.9924       (-33.1819      77.9068)
Norm        : 5.42403       (-1.02255     1.3012)
------------------------------------------------------------
#Fit statistic : Chi-Squared =          54.45 using 59 PHA bins.
# Reduced chi-squared =         0.9553 for     57 degrees of freedom
# Null hypothesis probability =   5.712800e-01

Energy  Fluence     90% Error
[keV]   [erg/cm2]   [erg/cm2]
15- 25  1.415e-08   2.595e-09
25- 50  2.387e-08   4.485e-09
50-150  3.609e-08   2.034e-08
15-150  7.411e-08   2.219e-08
Double BB

Spectral model: bbodyrad<1> + bbodyrad<2>
------------------------------------------------------------
Parameters  : value         Lower 90%    Upper 90%
kT1 [keV]   : 5.93347        (-3.30243      3.95209)
R1^2/D10^2  : 2.29931        (-1.75487      3.77408)
kT2 [keV]   : 17.6492        (-5.89044      44.0617)
R2^2/D10^2  : 4.96801E-02    (-0.0489202   0.238211)
------------------------------------------------------------
#Fit statistic : Chi-Squared =          54.32 using 59 PHA bins.
# Reduced chi-squared =         0.9877 for     55 degrees of freedom
# Null hypothesis probability =   5.004910e-01

Energy  Fluence     90% Error
[keV]   [erg/cm2]   [erg/cm2]
15- 25  1.370e-08   7.610e-09
25- 50  2.450e-08   1.287e-08
50-150  3.285e-08   1.990e-08
15-150  7.105e-08   3.761e-08
Pre-slew spectrum (Pre-slew PHA with pre-slew DRM)
Power-law model

Spectral model in power-law:
------------------------------------------------------------
Parameters  : value       lower 90%   higher 90%
Photon index: 1.71708     ( -0.12284   0.125093 )
Norm@50keV  : 5.55036E-03    ( -0.000428325   0.000424701 )
------------------------------------------------------------
#Fit statistic : Chi-Squared =          54.47 using 59 PHA bins.
# Reduced chi-squared =         0.9556 for     57 degrees of freedom
# Null hypothesis probability =   5.707080e-01

Photon flux (15-150 keV)    in 11.09 sec: 0.741603 ( -0.0533501  0.0533991 ) ph/cm2/s
Energy fluence (15-150 keV)             : 5.69182e-07 ( -4.57231e-08  4.61188e-08 ) ergs/cm2
Cutoff power-law model

Spectral model in the cutoff power-law:
------------------------------------------------------------
Parameters  : value       lower 90%   higher 90%
Photon index: 0.960362     ( -0.615732   0.539393 )
Epeak [keV] : 63.3835      ( -11.7481 44.071 )
Norm@50keV  : 1.41417E-02    ( -0.0067755   0.0158264 )
------------------------------------------------------------
#Fit statistic : Chi-Squared =          48.48 using 59 PHA bins.
# Reduced chi-squared =         0.8658 for     56 degrees of freedom
# Null hypothesis probability =   7.520591e-01

Photon flux (15-150 keV)    in 11.09 sec: 0.718035 ( -0.055866  0.055842 ) ph/cm2/s
Energy fluence (15-150 keV)             : 5.33644e-07 ( -5.11393e-08  5.21419e-08 ) ergs/cm2
Band function

Spectral model in the Band function:
------------------------------------------------------------
Parameters  : value       lower 90%   higher 90%
alpha       : -0.896407   ( -0.579709   2.86035 )
beta        : -2.50142    ( 2.49214   0.705009 )
Epeak [keV] : 60.9592      ( -30.0404 40.8511 )
Norm@50keV   : 1.54466E-02    ( -0.00686524   1.85163 )
------------------------------------------------------------
#Fit statistic : Chi-Squared =          48.25 using 59 PHA bins.
# Reduced chi-squared =         0.8772 for     55 degrees of freedom
# Null hypothesis probability =   7.283795e-01

Photon flux (15-150 keV)    in 11.09 sec:  (    ) ph/cm2/s
Energy fluence (15-150 keV)             : 0 ( 0  0 ) ergs/cm2
S(25-50 keV) vs. S(50-100 keV) plot

S(25-50 keV)  = 1.71e-07
S(50-100 keV) = 2.00e-07
T90 vs. Hardness ratio plot

T90                                   = 10.4999999403954 sec.
Hardness ratio (energy fluence ratio) = 1.16959
Color vs. Color plot

Count Ratio  (25-50 keV) / (15-25 keV) = 1.22756
Count Ratio (50-100 keV) / (15-25 keV) = 0.742429
Mask shadow pattern

IMX = 4.172220750241890E-01, IMY = -5.643792970956614E-02
TIME vs. PHA plot around the trigger time

Blue+Cyan dotted lines: Time interval of the scaled map
From 0.000000 to 1.024000
TIME vs. DetID plot around the trigger time

Blue+Cyan dotted lines: Time interval of the scaled map
From 0.000000 to 1.024000
100 us light curve (15-350 keV)

Blue+Cyan dotted lines: Time interval of the scaled map
From 0.000000 to 1.024000
Spacecraft aspect plot

Bright source in the pre-burst/pre-slew/post-slew images
Pre-burst image of 15-350 keV band
Time interval of the image:
-239.440000 -0.028000

# RAcent  DECcent POSerr Theta    Phi  PeakCts   SNR AngSep     Name
#  [deg]    [deg]    ['] [deg]  [deg]                   [']
135.5164 -40.5795    1.1  24.4  -66.3   2.6207  10.4    1.6	Vela X-1
162.5867  11.7878    2.4  41.2  168.7   1.7338   4.9 ------	UNKNOWN
 80.1889 -28.9283    2.7  49.2    5.5   1.9781   4.3 ------	UNKNOWN
Pre-slew background subtracted image of 15-350 keV band
Time interval of the image:
-0.028000 11.060590

# RAcent  DECcent POSerr Theta    Phi  PeakCts   SNR AngSep     Name
#  [deg]    [deg]    ['] [deg]  [deg]                   [']
135.3858 -40.4804    3.8  24.3  -66.1  -0.1515  -3.0    7.9	Vela X-1
109.0798 -23.5893    0.5  22.8    7.7   1.0218  24.2 ------	UNKNOWN
161.4984 -13.4709    2.0  28.5 -152.0   0.2617   5.7 ------	UNKNOWN
Post-slew image of 15-350 keV band
Time interval of the image:
73.460610 917.060590

# RAcent  DECcent POSerr Theta    Phi  PeakCts   SNR AngSep     Name
#  [deg]    [deg]    ['] [deg]  [deg]                   [']
135.5243 -40.5478    1.2  27.9 -154.7   5.6172   9.9    0.5	Vela X-1
139.9915   4.2927    3.3  41.0  122.8   7.3291   3.5 ------	UNKNOWN
149.9719  -0.7768    3.6  45.7  137.7   8.3539   3.2 ------	UNKNOWN
 67.1889  11.0802    3.1  53.6   17.1   9.0261   3.7 ------	UNKNOWN
123.0665 -14.4070    3.9  16.1  129.3   1.6720   2.9 ------	UNKNOWN
 55.0781 -23.4851    3.3  49.2  -29.9   4.6834   3.5 ------	UNKNOWN
 51.5758 -34.4127    3.7  50.8  -44.6  11.6018   3.1 ------	UNKNOWN
149.2957 -64.4272    4.9  48.5 -130.3   7.3791   2.4 ------	UNKNOWN
112.6749 -66.1815    2.9  42.7 -110.6  11.7687   4.0 ------	UNKNOWN
Plot creation:
Fri Mar 18 11:49:55 EDT 2016