Special notes of this burst
Image
Pre-slew 15.0-350.0 keV image (Event data)

#   RAcent    DECcent   POSerr    Theta     Phi              Peak Cts       SNR   Name
  150.2766   -33.7897   0.0120    23.8425  -107.2257         0.5670870     15.940 TRIG_00671447

Foreground time interval of the image:
 -2.048   3.000 (delta_t =   5.048 [sec])
Background time interval of the image:
-239.904  -2.048 (delta_t = 237.856 [sec])
Lightcurves
Notes:
- 1) The mask-weighted light curves are using the flight position.
- 2) Multiple plots of different time binning/intervals are shown to cover all scenarios of short/long GRBs, rate/image triggers, and real/false positives.
- 3) For all the mask-weighted lightcurves, the y-axis units are counts/sec/det where a det is 0.4 x 0.4 = 0.16 sq cm.
- 4) The verticle lines correspond to following: green dotted lines are T50 interval, black dotted lines are T90 interval, blue solid line(s) is a spacecraft slew start time, and orange solid line(s) is a spacecraft slew end time.
- 5) Time of each bin is in the middle of the bin.
1 s binning
From T0-310 s to T0+310 s

From T100_start - 20 s to T100_end + 30 s

Full time interval

64 ms binning
Full time interval

From T100_start to T100_end

From T0-5 sec to T0+5 sec

16 ms binning
From T100_start-5 s to T100_start+5 s

Blue+Cyan dotted lines: Time interval of the scaled map
From 0.000000 to 1.024000
8 ms binning
From T100_start-3 s to T100_start+3 s

Blue+Cyan dotted lines: Time interval of the scaled map
From 0.000000 to 1.024000
2 ms binning
From T100_start-1 s to T100_start+1 s

Blue+Cyan dotted lines: Time interval of the scaled map
From 0.000000 to 1.024000
SN=5 or 10 sec. binning (whichever binning is satisfied first)
SN=5 or 10 sec. binning (T < 200 sec)

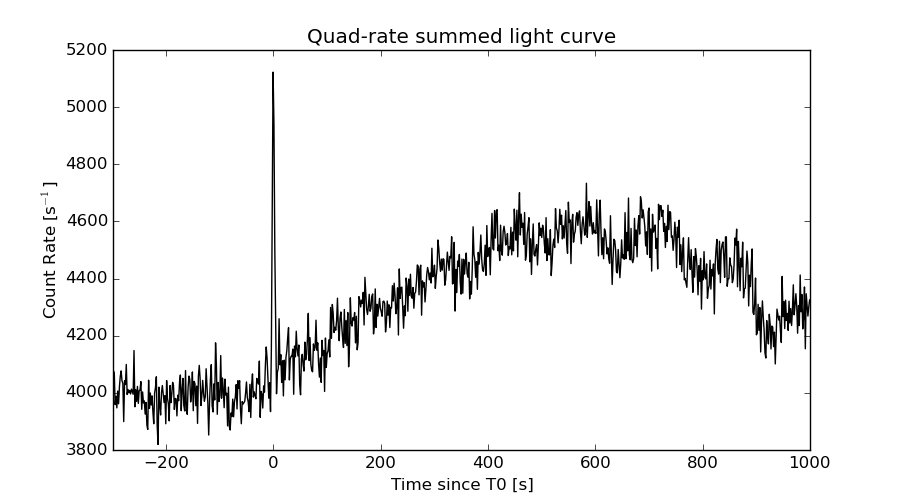
Quad-rate summed light curves (from T0-300s to T0+1000s)
Spectral Evolution

Spectra
Notes:
- 1) The fitting includes the systematic errors.
- 2) When the burst includes telescope slew time periods, the fitting uses an average response file made from multiple 5-s response files through out the slew time plus single time preiod for the non-slew times, and weighted by the total counts in the corresponding time period using addrmf. An average response file is needed becuase a spectral fit using the pre-slew DRM will introduce some errors in both a spectral shape and a normalization if the PHA file contains a lot of the slew/post-slew time interval.
- 3) For fits to more complicated models (e.g. a power-law over a cutoff power-law), the BAT team has decided to require a chi-square improvement of more than 6 for each extra dof.
Time averaged spectrum fit using the average DRM
Power-law model

Time interval is from   -2.048 sec. to    3.000 sec.

Spectral model in power-law:
------------------------------------------------------------
Parameters  : value       lower 90%   higher 90%
Photon index: 1.50898     ( -0.161363   0.162291 )
Norm@50keV  : 7.34386E-03    ( -0.00075043   0.000746272 )
------------------------------------------------------------
#Fit statistic : Chi-Squared =          47.72 using 59 PHA bins.
# Reduced chi-squared =         0.8371 for     57 degrees of freedom
# Null hypothesis probability =   8.046777e-01

Photon flux (15-150 keV)    in 5.048 sec: 0.919055 ( -0.091252  0.091325 ) ph/cm2/s
Energy fluence (15-150 keV)             : 3.5122e-07 ( -3.89868e-08  3.94042e-08 ) ergs/cm2
Cutoff power-law model

Time interval is from   -2.048 sec. to    3.000 sec.
Spectral model in the cutoff power-law:
------------------------------------------------------------
Parameters  : value       lower 90%   higher 90%
Photon index: 0.565751     ( -0.914924   0.731694 )
Epeak [keV] : 69.6151      ( -16.0464 80.8233 )
Norm@50keV  : 2.38976E-02    ( -0.0141581   0.0514935 )
------------------------------------------------------------
#Fit statistic : Chi-Squared =          42.64 using 59 PHA bins.
# Reduced chi-squared =         0.7614 for     56 degrees of freedom
# Null hypothesis probability =   9.057651e-01

Photon flux (15-150 keV)    in 5.048 sec: 0.890187 ( -0.094382  0.094252 ) ph/cm2/s
Energy fluence (15-150 keV)             : 3.21514e-07 ( -4.47499e-08  4.56328e-08 ) ergs/cm2
Band function

Time interval is from   -2.048 sec. to    3.000 sec.

Spectral model in the Band function:
------------------------------------------------------------
Parameters  : value       lower 90%   higher 90%
alpha       : 1.75884   ( -1.68541   -1.2079 )
beta        : -1.96985    ( -0.541547   0.347198 )
Epeak [keV] : 39.7829      ( -10.8507 20.2488 )
Norm@50keV   : 0.821888    ( -0.871051   69.2981 )
------------------------------------------------------------
#Fit statistic : Chi-Squared =          38.17 using 59 PHA bins.
# Reduced chi-squared =         0.6940 for     55 degrees of freedom
# Null hypothesis probability =   9.591018e-01

Photon flux (15-150 keV)    in 5.048 sec:  (    ) ph/cm2/s
Energy fluence (15-150 keV)             : 0 ( 0  0 ) ergs/cm2
Single BB

Spectral model blackbody:
------------------------------------------------------------
Parameters  : value    Lower 90%  Upper 90%
kT [keV]    : 13.0739  (-1.40723  1.64741)
R^2/D10^2   : 0.174303  (-0.0609968   0.0890136)
(R is the radius in km and D10 is the distance to the source in units of 10 kpc)
------------------------------------------------------------
#Fit statistic : Chi-Squared =          53.66 using 59 PHA bins.
# Reduced chi-squared =         0.9415 for     57 degrees of freedom
# Null hypothesis probability =   6.010310e-01

Energy  Fluence     90% Error
[keV]   [erg/cm2]   [erg/cm2]
15- 25  3.189e-08   5.772e-09
25- 50  1.105e-07   1.489e-08
50-150  1.198e-07   2.501e-08
15-150  2.622e-07   3.304e-08
Thermal bremsstrahlung (OTTB)

Spectral model: thermal bremsstrahlung
------------------------------------------------------------
Parameters  : value         Lower 90%    Upper 90%
kT [keV]    : 199.130       (-77.2379      -199.154)
Norm        : 3.78051       (-0.368202     0.402844)
------------------------------------------------------------
#Fit statistic : Chi-Squared =          44.92 using 59 PHA bins.
# Reduced chi-squared =         0.7881 for     57 degrees of freedom
# Null hypothesis probability =   8.768063e-01

Energy  Fluence     90% Error
[keV]   [erg/cm2]   [erg/cm2]
15- 25  4.753e-08   1.852e-08
25- 50  9.141e-08   3.390e-08
50-150  2.004e-07   1.083e-07
15-150  3.394e-07   1.717e-07
Double BB

Spectral model: bbodyrad<1> + bbodyrad<2>
------------------------------------------------------------
Parameters  : value         Lower 90%    Upper 90%
kT1 [keV]   : 9.57515        (-2.09466      2.11192)
R1^2/D10^2  : 0.412634        (-0.185722      0.403189)
kT2 [keV]   : 38.7296        (-31.4261      -38.9101)
R2^2/D10^2  : 2.43689E-03    (-0.00215266   0.0167677)
------------------------------------------------------------
#Fit statistic : Chi-Squared =          37.79 using 59 PHA bins.
# Reduced chi-squared =         0.6872 for     55 degrees of freedom
# Null hypothesis probability =   9.629693e-01

Energy  Fluence     90% Error
[keV]   [erg/cm2]   [erg/cm2]
15- 25  4.070e-08   1.342e-08
25- 50  1.058e-07   3.807e-08
50-150  1.922e-07   9.854e-08
15-150  3.387e-07   1.322e-07
Peak spectrum fit
Power-law model

Time interval is from    0.008 sec. to    1.008 sec.

Spectral model in power-law:
------------------------------------------------------------
Parameters  : value       lower 90%   higher 90%
Photon index: 1.54662     ( -0.25804   0.264181 )
Norm@50keV  : 1.03844E-02    ( -0.0017489   0.00172745 )
------------------------------------------------------------
#Fit statistic : Chi-Squared =          57.05 using 59 PHA bins.
# Reduced chi-squared =          1.001 for     57 degrees of freedom
# Null hypothesis probability =   4.733039e-01

Photon flux (15-150 keV)    in 1 sec: 1.31337 ( -0.20993  0.21009 ) ph/cm2/s
Energy fluence (15-150 keV)             : 9.78205e-08 ( -1.76675e-08  1.79639e-08 ) ergs/cm2
Cutoff power-law model

Time interval is from    0.008 sec. to    1.008 sec.
Spectral model in the cutoff power-law:
------------------------------------------------------------
Parameters  : value       lower 90%   higher 90%
Photon index: 0.530726     ( -1.50206   1.10159 )
Epeak [keV] : 66.8982      ( -19.0731 -66.8981 )
Norm@50keV  : 3.67180E-02    ( -0.0367181   0.198496 )
------------------------------------------------------------
#Fit statistic : Chi-Squared =          54.71 using 59 PHA bins.
# Reduced chi-squared =         0.9770 for     56 degrees of freedom
# Null hypothesis probability =   5.236351e-01

Photon flux (15-150 keV)    in 1 sec: 1.27434 ( -0.21528  0.21513 ) ph/cm2/s
Energy fluence (15-150 keV)             : 9.00596e-08 ( -1.89759e-08  1.99271e-08 ) ergs/cm2
Band function

Time interval is from    0.008 sec. to    1.008 sec.

Spectral model in the Band function:
------------------------------------------------------------
Parameters  : value       lower 90%   higher 90%
alpha       : 0.402733   ( -1.62399   -1.62399 )
beta        : -2.02837    ( 1.93419   0.513297 )
Epeak [keV] : 47.2102      ( -38.5398 65.1886 )
Norm@50keV   : 0.150676    ( -0.151755   290.311 )
------------------------------------------------------------
#Fit statistic : Chi-Squared =          54.33 using 59 PHA bins.
# Reduced chi-squared =         0.9878 for     55 degrees of freedom
# Null hypothesis probability =   5.001822e-01

Photon flux (15-150 keV)    in 1 sec:  (    ) ph/cm2/s
Energy fluence (15-150 keV)             : 0 ( 0  0 ) ergs/cm2
Single BB

Spectral model blackbody:
------------------------------------------------------------
Parameters  : value    Lower 90%  Upper 90%
kT [keV]    : 13.4002  (-2.27371  2.80603)
R^2/D10^2   : 0.229411  (-0.113848   0.216239)
(R is the radius in km and D10 is the distance to the source in units of 10 kpc)
------------------------------------------------------------
#Fit statistic : Chi-Squared =          59.28 using 59 PHA bins.
# Reduced chi-squared =          1.040 for     57 degrees of freedom
# Null hypothesis probability =   3.922787e-01

Energy  Fluence     90% Error
[keV]   [erg/cm2]   [erg/cm2]
15- 25  8.729e-09   2.532e-09
25- 50  3.105e-08   7.690e-09
50-150  3.586e-08   1.229e-08
15-150  7.564e-08   1.925e-08
Thermal bremsstrahlung (OTTB)

Spectral model: thermal bremsstrahlung
------------------------------------------------------------
Parameters  : value         Lower 90%    Upper 90%
kT [keV]    : 188.239       (-97.0755      -185.913)
Norm        : 5.40990       (-0.866581     1.05244)
------------------------------------------------------------
#Fit statistic : Chi-Squared =          55.77 using 59 PHA bins.
# Reduced chi-squared =         0.9784 for     57 degrees of freedom
# Null hypothesis probability =   5.214016e-01

Energy  Fluence     90% Error
[keV]   [erg/cm2]   [erg/cm2]
15- 25  1.357e-08   7.755e-09
25- 50  2.592e-08   1.424e-08
50-150  5.577e-08   3.118e-08
15-150  9.526e-08   5.310e-08
Double BB

Spectral model: bbodyrad<1> + bbodyrad<2>
------------------------------------------------------------
Parameters  : value         Lower 90%    Upper 90%
kT1 [keV]   : 8.22041        (-4.94963      -8.22067)
R1^2/D10^2  : 0.807703        (-0.572549      15.3608)
kT2 [keV]   : 24.0391        (-19.3366      -24.0424)
R2^2/D10^2  : 1.84980E-02    (-0.0180806   0.125807)
------------------------------------------------------------
#Fit statistic : Chi-Squared =          54.38 using 59 PHA bins.
# Reduced chi-squared =         0.9888 for     55 degrees of freedom
# Null hypothesis probability =   4.982164e-01

Energy  Fluence     90% Error
[keV]   [erg/cm2]   [erg/cm2]
15- 25  1.196e-08   6.955e-09
25- 50  2.899e-08   1.576e-08
50-150  5.064e-08   3.043e-08
15-150  9.159e-08   4.636e-08
Pre-slew spectrum (Pre-slew PHA with pre-slew DRM)
Power-law model

Spectral model in power-law:
------------------------------------------------------------
Parameters  : value       lower 90%   higher 90%
Photon index: 1.50898     ( -0.161363   0.162291 )
Norm@50keV  : 7.34386E-03    ( -0.00075043   0.000746272 )
------------------------------------------------------------
#Fit statistic : Chi-Squared =          47.72 using 59 PHA bins.
# Reduced chi-squared =         0.8371 for     57 degrees of freedom
# Null hypothesis probability =   8.046777e-01

Photon flux (15-150 keV)    in 5.048 sec: 0.919031 ( -0.0912474  0.0913214 ) ph/cm2/s
Energy fluence (15-150 keV)             : 3.51174e-07 ( -3.89783e-08  3.94078e-08 ) ergs/cm2
Cutoff power-law model

Spectral model in the cutoff power-law:
------------------------------------------------------------
Parameters  : value       lower 90%   higher 90%
Photon index: 0.565869     ( -0.91496   0.731658 )
Epeak [keV] : 69.6196      ( -16.0468 80.8248 )
Norm@50keV  : 2.38936E-02    ( -0.0141586   0.0514935 )
------------------------------------------------------------
#Fit statistic : Chi-Squared =          42.64 using 59 PHA bins.
# Reduced chi-squared =         0.7614 for     56 degrees of freedom
# Null hypothesis probability =   9.057651e-01

Photon flux (15-150 keV)    in 5.048 sec: 0.890094 ( -0.094358  0.094224 ) ph/cm2/s
Energy fluence (15-150 keV)             : 3.2162e-07 ( -4.47864e-08  4.56718e-08 ) ergs/cm2
Band function

Spectral model in the Band function:
------------------------------------------------------------
Parameters  : value       lower 90%   higher 90%
alpha       : 1.75884   ( -1.68541   -1.2079 )
beta        : -1.96985    ( -0.541547   0.347198 )
Epeak [keV] : 39.7829      ( -10.8507 20.2488 )
Norm@50keV   : 0.821888    ( -0.871051   69.2749 )
------------------------------------------------------------
#Fit statistic : Chi-Squared =          38.17 using 59 PHA bins.
# Reduced chi-squared =         0.6940 for     55 degrees of freedom
# Null hypothesis probability =   9.591018e-01

Photon flux (15-150 keV)    in 5.048 sec:  (    ) ph/cm2/s
Energy fluence (15-150 keV)             : 0 ( 0  0 ) ergs/cm2
S(25-50 keV) vs. S(50-100 keV) plot

S(25-50 keV)  = 8.73e-08
S(50-100 keV) = 1.23e-07
T90 vs. Hardness ratio plot
T90                                   = 3.95199990272522 sec.
Hardness ratio (energy fluence ratio) = 1.40893
Color vs. Color plot

Count Ratio  (25-50 keV) / (15-25 keV) = 1.83176
Count Ratio (50-100 keV) / (15-25 keV) = 1.01152
Mask shadow pattern

IMX = -1.308747690339830E-01, IMY = 4.221164039280391E-01
TIME vs. PHA plot around the trigger time

Blue+Cyan dotted lines: Time interval of the scaled map
From 0.000000 to 1.024000
TIME vs. DetID plot around the trigger time

Blue+Cyan dotted lines: Time interval of the scaled map
From 0.000000 to 1.024000
100 us light curve (15-350 keV)

Blue+Cyan dotted lines: Time interval of the scaled map
From 0.000000 to 1.024000
Spacecraft aspect plot

Bright source in the pre-burst/pre-slew/post-slew images
Pre-burst image of 15-350 keV band
Time interval of the image:
-239.904000 -2.048000

# RAcent  DECcent POSerr Theta    Phi  PeakCts   SNR AngSep     Name
#  [deg]    [deg]    ['] [deg]  [deg]                   [']
135.5351 -40.5329    1.7  24.3  -73.7   1.8387   6.7    1.3	Vela X-1
151.8719  25.1273    3.1  45.7  137.7   3.8587   3.7 ------	UNKNOWN
160.1718  25.3614    2.8  49.8  146.2   4.5450   4.1 ------	UNKNOWN
108.9571  -7.5885    2.5  24.3   40.9   1.1458   4.6 ------	UNKNOWN
155.9693   4.4414    2.8  31.4  163.0   1.2295   4.1 ------	UNKNOWN
114.2628 -53.3720    2.3  39.6  -50.8   2.2450   5.1 ------	UNKNOWN
170.8698 -43.6563    3.2  42.6 -109.5   3.7182   3.7 ------	UNKNOWN
Pre-slew background subtracted image of 15-350 keV band
Time interval of the image:
-2.048000 3.000000

# RAcent  DECcent POSerr Theta    Phi  PeakCts   SNR AngSep     Name
#  [deg]    [deg]    ['] [deg]  [deg]                   [']
135.6419 -40.6142   47.4  24.4  -73.9   0.0089   0.2    6.3	Vela X-1
143.5082  11.7155    2.3  30.2  134.9   0.2043   4.9 ------	UNKNOWN
171.6769 -15.1069    2.2  38.0 -153.8   0.2042   5.2 ------	UNKNOWN
150.2766 -33.7897    0.7  23.8 -107.2   0.5671  15.9 ------	UNKNOWN
Post-slew image of 15-350 keV band
Time interval of the image:
62.396640 962.194500

# RAcent  DECcent POSerr Theta    Phi  PeakCts   SNR AngSep     Name
#  [deg]    [deg]    ['] [deg]  [deg]                   [']
135.5434 -40.5346    0.8  13.5   -6.0   9.8239  14.2    1.4	Vela X-1
170.3475 -60.6191    4.9  29.9  -81.5  -2.4597  -2.4    1.0	Cen X-3
186.7574 -62.7994   14.1  36.9  -88.6   1.7076   0.8    3.3	GX 301-2
169.9998   5.1835    2.3  43.2  147.7   9.7034   5.0 ------	UNKNOWN
196.1837   1.2092    4.8  55.5  178.9   8.2241   2.4 ------	UNKNOWN
 69.7233 -67.0119    2.9  55.6  -33.9  17.7810   4.0 ------	UNKNOWN
 86.7206 -75.1989    3.8  50.8  -44.5  13.2501   3.1 ------	UNKNOWN
Plot creation:
Fri Mar 18 11:48:07 EDT 2016