Click here for the BAT GCN circular template
Image
Pre-slew 15.0-350.0 keV image (Event data)
#   RAcent    DECcent   POSerr    Theta     Phi              Peak Cts       SNR   Name
  225.9658     0.0795   0.0146    32.1552  -109.8064         0.7811506     13.193 TRIG_00671828

Foreground time interval of the image:
 -1.436   5.704 (delta_t =   7.140 [sec])
Background time interval of the image:
-239.072  -1.436 (delta_t = 237.636 [sec])
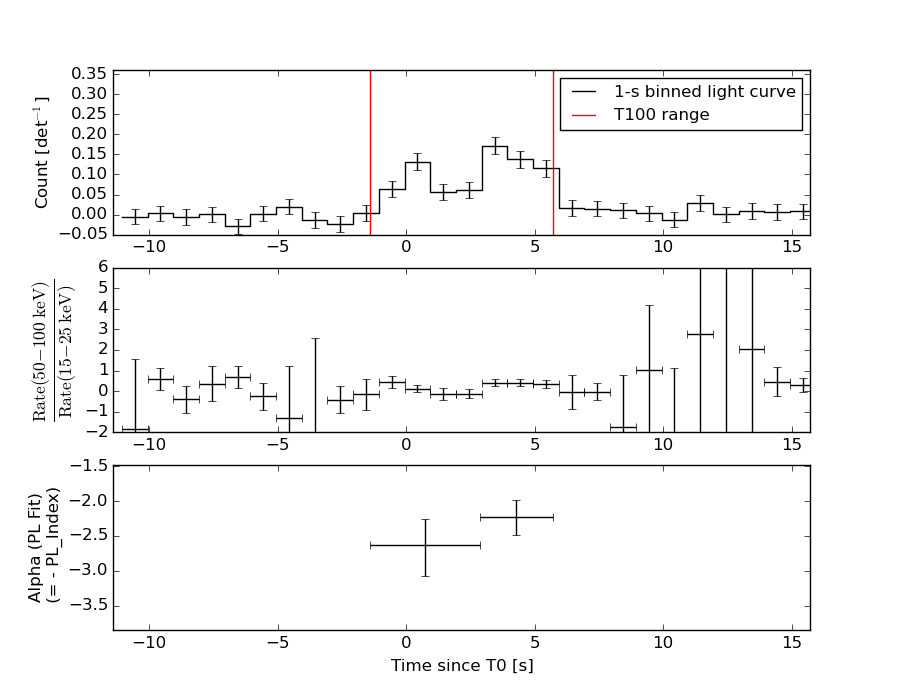
Lightcurves
Notes:
- 1) The mask-weighted light curves are using the flight position.
- 2) Multiple plots of different time binning/intervals are shown to cover all scenarios of short/long GRBs, rate/image triggers, and real/false positives.
- 3) For all the mask-weighted lightcurves, the y-axis units are counts/sec/det where a det is 0.4 x 0.4 = 0.16 sq cm.
- 4) The verticle lines correspond to following: green dotted lines are T50 interval, black dotted lines are T90 interval, blue solid line(s) is a spacecraft slew start time, and orange solid line(s) is a spacecraft slew end time.
- 5) Time of each bin is in the middle of the bin.
1 s binning
From T0-310 s to T0+310 s

From T100_start - 20 s to T100_end + 30 s
Full time interval

64 ms binning
Full time interval
From T100_start to T100_end
From T0-5 sec to T0+5 sec

16 ms binning
From T100_start-5 s to T100_start+5 s

Blue+Cyan dotted lines: Time interval of the scaled map
From 0.000000 to 1.024000
8 ms binning
From T100_start-3 s to T100_start+3 s

Blue+Cyan dotted lines: Time interval of the scaled map
From 0.000000 to 1.024000
2 ms binning
From T100_start-1 s to T100_start+1 s

Blue+Cyan dotted lines: Time interval of the scaled map
From 0.000000 to 1.024000
SN=5 or 10 sec. binning (whichever binning is satisfied first)
SN=5 or 10 sec. binning (T < 200 sec)
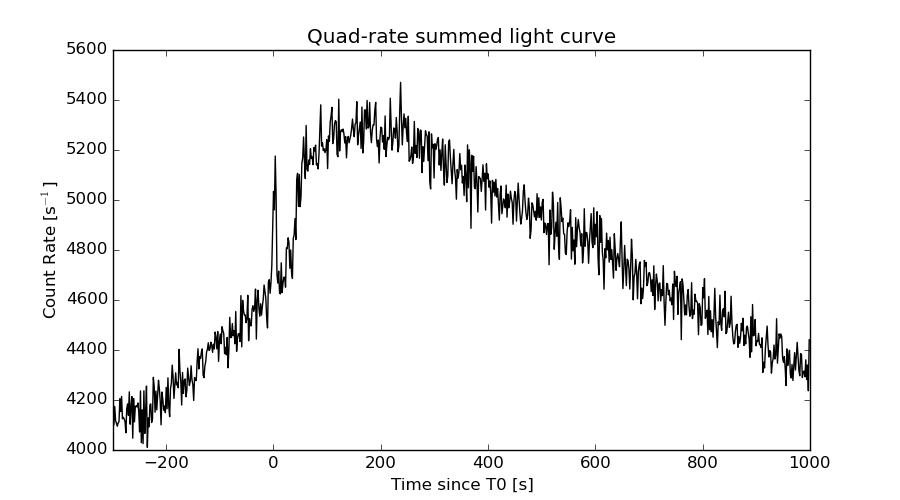
Quad-rate summed light curves (from T0-300s to T0+1000s)
Spectral Evolution
Spectra
Notes:
- 1) The fitting includes the systematic errors.
- 2) When the burst includes telescope slew time periods, the fitting uses an average response file made from multiple 5-s response files through out the slew time plus single time preiod for the non-slew times, and weighted by the total counts in the corresponding time period using addrmf. An average response file is needed becuase a spectral fit using the pre-slew DRM will introduce some errors in both a spectral shape and a normalization if the PHA file contains a lot of the slew/post-slew time interval.
- 3) For fits to more complicated models (e.g. a power-law over a cutoff power-law), the BAT team has decided to require a chi-square improvement of more than 6 for each extra dof.
Time averaged spectrum fit using the average DRM
Power-law model
Time interval is from   -1.436 sec. to    5.704 sec.

Spectral model in power-law:
------------------------------------------------------------
Parameters  : value       lower 90%   higher 90%
Photon index: 2.43252     ( -0.223304   0.243464 )
Norm@50keV  : 5.18734E-03    ( -0.000929417   0.000920944 )
------------------------------------------------------------
#Fit statistic : Chi-Squared =          50.22 using 59 PHA bins.
# Reduced chi-squared =         0.8810 for     57 degrees of freedom
# Null hypothesis probability =   7.254129e-01

Photon flux (15-150 keV)    in 7.14 sec: 0.978500 ( -0.112169  0.11217 ) ph/cm2/s
Energy fluence (15-150 keV)             : 3.6414e-07 ( -5.03651e-08  5.18551e-08 ) ergs/cm2
Cutoff power-law model

Time interval is from   -1.436 sec. to    5.704 sec.
Spectral model in the cutoff power-law:
------------------------------------------------------------
Parameters  : value       lower 90%   higher 90%
Photon index: 0.986438     ( -1.3295   0.898092 )
Epeak [keV] : 25.5934      (   )
Norm@50keV  : 4.15770E-02    (     )
------------------------------------------------------------
#Fit statistic : Chi-Squared =          44.14 using 59 PHA bins.
# Reduced chi-squared =         0.7882 for     56 degrees of freedom
# Null hypothesis probability =   8.742817e-01

Photon flux (15-150 keV)    in 7.14 sec:  (    ) ph/cm2/s
Energy fluence (15-150 keV)             : 0 ( 0  0 ) ergs/cm2
Band function

Time interval is from   -1.436 sec. to    5.704 sec.

Spectral model in the Band function:
------------------------------------------------------------
Parameters  : value       lower 90%   higher 90%
alpha       : -0.984904   ( -1.08673   1.39639 )
beta        : -10.0000    ( 10   3.55271e-15 )
Epeak [keV] : 25.5923      ( -9.09252 7.79651 )
Norm@50keV   : 4.16817E-02    ( -0.0416772   0.252833 )
------------------------------------------------------------
#Fit statistic : Chi-Squared =          44.14 using 59 PHA bins.
# Reduced chi-squared =         0.8026 for     55 degrees of freedom
# Null hypothesis probability =   8.526343e-01

Photon flux (15-150 keV)    in 7.14 sec:  (    ) ph/cm2/s
Energy fluence (15-150 keV)             : 0 ( 0  0 ) ergs/cm2
Single BB

Spectral model blackbody:
------------------------------------------------------------
Parameters  : value    Lower 90%  Upper 90%
kT [keV]    : 7.94002  (-0.982991  1.08076)
R^2/D10^2   : 1.11480  (-0.451905   0.798319)
(R is the radius in km and D10 is the distance to the source in units of 10 kpc)
------------------------------------------------------------
#Fit statistic : Chi-Squared =          52.57 using 59 PHA bins.
# Reduced chi-squared =         0.9223 for     57 degrees of freedom
# Null hypothesis probability =   6.416701e-01

Energy  Fluence     90% Error
[keV]   [erg/cm2]   [erg/cm2]
15- 25  9.024e-08   1.727e-08
25- 50  1.559e-07   2.492e-08
50-150  3.992e-08   1.480e-08
15-150  2.860e-07   4.591e-08
Thermal bremsstrahlung (OTTB)

Spectral model: thermal bremsstrahlung
------------------------------------------------------------
Parameters  : value         Lower 90%    Upper 90%
kT [keV]    : 34.8912       (-8.10902      11.4416)
Norm        : 7.03680       (-1.44536     1.91067)
------------------------------------------------------------
#Fit statistic : Chi-Squared =          44.43 using 59 PHA bins.
# Reduced chi-squared =         0.7794 for     57 degrees of freedom
# Null hypothesis probability =   8.875477e-01

Energy  Fluence     90% Error
[keV]   [erg/cm2]   [erg/cm2]
15- 25  1.096e-07   1.528e-08
25- 50  1.355e-07   1.839e-08
50-150  8.964e-08   3.559e-08
15-150  3.347e-07   5.330e-08
Double BB
Spectral model: bbodyrad<1> + bbodyrad<2>
------------------------------------------------------------
Parameters  : value         Lower 90%    Upper 90%
kT1 [keV]   : 3.89440        (-1.44055      1.95186)
R1^2/D10^2  : 12.0713        (-9.49783      102.62)
kT2 [keV]   : 10.9507        (-2.29227      4.42446)
R2^2/D10^2  : 0.227718    (-0.18714   0.464524)
------------------------------------------------------------
#Fit statistic : Chi-Squared =          43.01 using 59 PHA bins.
# Reduced chi-squared =         0.7819 for     55 degrees of freedom
# Null hypothesis probability =   8.798956e-01

Energy  Fluence     90% Error
[keV]   [erg/cm2]   [erg/cm2]
15- 25  1.095e-07   5.762e-08
25- 50  1.374e-07   7.194e-08
50-150  7.748e-08   4.398e-08
15-150  3.243e-07   1.652e-07
Peak spectrum fit
Power-law model

Time interval is from    3.344 sec. to    4.344 sec.

Spectral model in power-law:
------------------------------------------------------------
Parameters  : value       lower 90%   higher 90%
Photon index: 2.25497     ( -0.340579   0.392635 )
Norm@50keV  : 8.52384E-03    ( -0.0024608   0.00240409 )
------------------------------------------------------------
#Fit statistic : Chi-Squared =          64.42 using 59 PHA bins.
# Reduced chi-squared =          1.130 for     57 degrees of freedom
# Null hypothesis probability =   2.329904e-01

Photon flux (15-150 keV)    in 1 sec: 1.45337 ( -0.3045  0.30449 ) ph/cm2/s
Energy fluence (15-150 keV)             : 8.08202e-08 ( -1.97457e-08  2.04659e-08 ) ergs/cm2
Cutoff power-law model

Time interval is from    3.344 sec. to    4.344 sec.
Spectral model in the cutoff power-law:
------------------------------------------------------------
Parameters  : value       lower 90%   higher 90%
Photon index: 0.498128     ( -1.93017   1.45459 )
Epeak [keV] : 35.0120      (   )
Norm@50keV  : 9.26196E-02    (     )
------------------------------------------------------------
#Fit statistic : Chi-Squared =          59.97 using 59 PHA bins.
# Reduced chi-squared =          1.071 for     56 degrees of freedom
# Null hypothesis probability =   3.338199e-01

Photon flux (15-150 keV)    in 1 sec: 1.43701 ( -0.3007  0.30041 ) ph/cm2/s
Energy fluence (15-150 keV)             : 7.65086e-08 ( -1.84536e-08  1.92064e-08 ) ergs/cm2
Band function

Time interval is from    3.344 sec. to    4.344 sec.

Spectral model in the Band function:
------------------------------------------------------------
Parameters  : value       lower 90%   higher 90%
alpha       : -0.492562   ( -1.00342   2.15176 )
beta        : -10.0000    ( 10   1.77636e-15 )
Epeak [keV] : 35.0142      ( -21.6401 12.7267 )
Norm@50keV   : 9.33900E-02    ( -0.0933183   1.14212 )
------------------------------------------------------------
#Fit statistic : Chi-Squared =          59.97 using 59 PHA bins.
# Reduced chi-squared =          1.090 for     55 degrees of freedom
# Null hypothesis probability =   3.002815e-01

Photon flux (15-150 keV)    in 1 sec:  (    ) ph/cm2/s
Energy fluence (15-150 keV)             : 0 ( 0  0 ) ergs/cm2
Single BB
Spectral model blackbody:
------------------------------------------------------------
Parameters  : value    Lower 90%  Upper 90%
kT [keV]    : 9.88937  (-2.21597  2.37508)
R^2/D10^2   : 0.747934  (-0.426282   1.23075)
(R is the radius in km and D10 is the distance to the source in units of 10 kpc)
------------------------------------------------------------
#Fit statistic : Chi-Squared =          63.01 using 59 PHA bins.
# Reduced chi-squared =          1.105 for     57 degrees of freedom
# Null hypothesis probability =   2.722846e-01

Energy  Fluence     90% Error
[keV]   [erg/cm2]   [erg/cm2]
15- 25  1.484e-08   5.939e-09
25- 50  3.632e-08   1.181e-08
50-150  1.835e-08   1.011e-08
15-150  6.951e-08   2.503e-08
Thermal bremsstrahlung (OTTB)
Spectral model: thermal bremsstrahlung
------------------------------------------------------------
Parameters  : value         Lower 90%    Upper 90%
kT [keV]    : 45.2259       (-16.5116      30.3738)
Norm        : 9.05189       (-2.61902     3.85308)
------------------------------------------------------------
#Fit statistic : Chi-Squared =          60.78 using 59 PHA bins.
# Reduced chi-squared =          1.066 for     57 degrees of freedom
# Null hypothesis probability =   3.413044e-01

Energy  Fluence     90% Error
[keV]   [erg/cm2]   [erg/cm2]
15- 25  2.158e-08   6.470e-09
25- 50  2.986e-08   9.005e-09
50-150  2.628e-08   1.488e-08
15-150  7.772e-08   2.703e-08
Double BB

Spectral model: bbodyrad<1> + bbodyrad<2>
------------------------------------------------------------
Parameters  : value         Lower 90%    Upper 90%
kT1 [keV]   : 4.10004        (-1.63863      2.65071)
R1^2/D10^2  : 13.2469        (-11.8258      138.587)
kT2 [keV]   : 12.7352        (-3.12943      4.71302)
R2^2/D10^2  : 0.220778    (-0.172722   0.436409)
------------------------------------------------------------
#Fit statistic : Chi-Squared =          58.08 using 59 PHA bins.
# Reduced chi-squared =          1.056 for     55 degrees of freedom
# Null hypothesis probability =   3.626383e-01

Energy  Fluence     90% Error
[keV]   [erg/cm2]   [erg/cm2]
15- 25  2.116e-08   1.149e-08
25- 50  3.083e-08   1.663e-08
50-150  2.598e-08   1.678e-08
15-150  7.796e-08   4.101e-08
Pre-slew spectrum (Pre-slew PHA with pre-slew DRM)
Power-law model

Spectral model in power-law:
------------------------------------------------------------
Parameters  : value       lower 90%   higher 90%
Photon index: 2.43252     ( -0.223304   0.243464 )
Norm@50keV  : 5.18734E-03    ( -0.000929417   0.000920944 )
------------------------------------------------------------
#Fit statistic : Chi-Squared =          50.22 using 59 PHA bins.
# Reduced chi-squared =         0.8810 for     57 degrees of freedom
# Null hypothesis probability =   7.254129e-01

Photon flux (15-150 keV)    in 7.14 sec: 0.978371 ( -0.112154  0.112154 ) ph/cm2/s
Energy fluence (15-150 keV)             : 3.64053e-07 ( -5.03097e-08  5.18804e-08 ) ergs/cm2
Cutoff power-law model

Spectral model in the cutoff power-law:
------------------------------------------------------------
Parameters  : value       lower 90%   higher 90%
Photon index: 0.986623     ( -1.32955   0.89804 )
Epeak [keV] : 25.5919      (   )
Norm@50keV  : 4.15664E-02    (     )
------------------------------------------------------------
#Fit statistic : Chi-Squared =          44.14 using 59 PHA bins.
# Reduced chi-squared =         0.7882 for     56 degrees of freedom
# Null hypothesis probability =   8.742817e-01

Photon flux (15-150 keV)    in 7.14 sec: 0.946995 ( -0.112542  0.112995 ) ph/cm2/s
Energy fluence (15-150 keV)             : 3.28312e-07 ( -4.73739e-08  5.2716e-08 ) ergs/cm2
Band function
Spectral model in the Band function:
------------------------------------------------------------
Parameters  : value       lower 90%   higher 90%
alpha       : -0.984904   ( -1.08673   1.39639 )
beta        : -10.0000    ( 10   3.55271e-14 )
Epeak [keV] : 25.5923      ( -9.0925 7.79645 )
Norm@50keV   : 4.16817E-02    ( -0.0416772   0.252833 )
------------------------------------------------------------
#Fit statistic : Chi-Squared =          44.14 using 59 PHA bins.
# Reduced chi-squared =         0.8026 for     55 degrees of freedom
# Null hypothesis probability =   8.526343e-01

Photon flux (15-150 keV)    in 7.14 sec:  (    ) ph/cm2/s
Energy fluence (15-150 keV)             : 0 ( 0  0 ) ergs/cm2
S(25-50 keV) vs. S(50-100 keV) plot

S(25-50 keV)  = 1.20e-07
S(50-100 keV) = 8.85e-08
T90 vs. Hardness ratio plot
T90                                   = 6.15599989891052 sec.
Hardness ratio (energy fluence ratio) = 0.7375
Color vs. Color plot
Count Ratio  (25-50 keV) / (15-25 keV) = 0.857787
Count Ratio (50-100 keV) / (15-25 keV) = 0.255203
Mask shadow pattern

IMX = -2.130115013309690E-01, IMY = 5.914544981454837E-01
TIME vs. PHA plot around the trigger time

Blue+Cyan dotted lines: Time interval of the scaled map
From 0.000000 to 1.024000
TIME vs. DetID plot around the trigger time
Blue+Cyan dotted lines: Time interval of the scaled map
From 0.000000 to 1.024000
100 us light curve (15-350 keV)

Blue+Cyan dotted lines: Time interval of the scaled map
From 0.000000 to 1.024000
Spacecraft aspect plot

Bright source in the pre-burst/pre-slew/post-slew images
Pre-burst image of 15-350 keV band
Time interval of the image:
-239.072000 -1.436000

# RAcent  DECcent POSerr Theta    Phi  PeakCts   SNR AngSep     Name
#  [deg]    [deg]    ['] [deg]  [deg]                   [']
163.5627 -42.2802    2.4  50.4    9.1   2.8358   4.7 ------	UNKNOWN
216.7139 -33.0149    2.5  39.5  -50.7   2.1702   4.6 ------	UNKNOWN
225.7382 -11.7509    2.3  33.8  -88.2   2.3024   4.9 ------	UNKNOWN
Pre-slew background subtracted image of 15-350 keV band
Time interval of the image:
-1.436000 5.704000

# RAcent  DECcent POSerr Theta    Phi  PeakCts   SNR AngSep     Name
#  [deg]    [deg]    ['] [deg]  [deg]                   [']
154.5416   5.1872    2.6  39.5   78.3   0.6188   4.5 ------	UNKNOWN
159.3237 -28.5383    2.6  43.7   26.3   0.3211   4.5 ------	UNKNOWN
225.9658   0.0795    0.9  32.2 -109.8   0.7812  13.2 ------	UNKNOWN
Post-slew image of 15-350 keV band
Time interval of the image:
62.828600 962.998800

# RAcent  DECcent POSerr Theta    Phi  PeakCts   SNR AngSep     Name
#  [deg]    [deg]    ['] [deg]  [deg]                   [']
244.9793 -15.6311    0.2  24.5  -67.7  70.1824  60.1    0.5	Sco X-1
254.5696  35.4592    6.7  44.3 -164.5  -3.2289  -1.7    8.9	Her X-1
255.8578 -37.7256    0.0  46.8  -51.3  -5.2593  -1.2    9.4	4U 1700-377
256.5032 -36.4435    9.5  46.2  -53.0   5.3671   1.2    3.5	GX 349+2
241.8848  45.2197    4.7  47.3  176.8   6.2162   2.5 ------	UNKNOWN
244.6206  19.9070    2.3  27.0 -156.9   5.3522   5.0 ------	UNKNOWN
219.6895 -57.7941    3.0  58.1  -14.6  17.5143   3.9 ------	UNKNOWN
Plot creation:
Fri Mar 18 11:46:12 EDT 2016