Special notes of this burst
Image
Pre-slew 15.0-350.0 keV image (Event data)

#   RAcent    DECcent   POSerr    Theta     Phi              Peak Cts       SNR   Name
   78.1685    -7.0385   0.0071    23.7670   -92.9450         1.9697471     27.059 TRIG_00672236

Foreground time interval of the image:
 -1.492  13.557 (delta_t =  15.049 [sec])
Background time interval of the image:
-239.744  -1.492 (delta_t = 238.252 [sec])
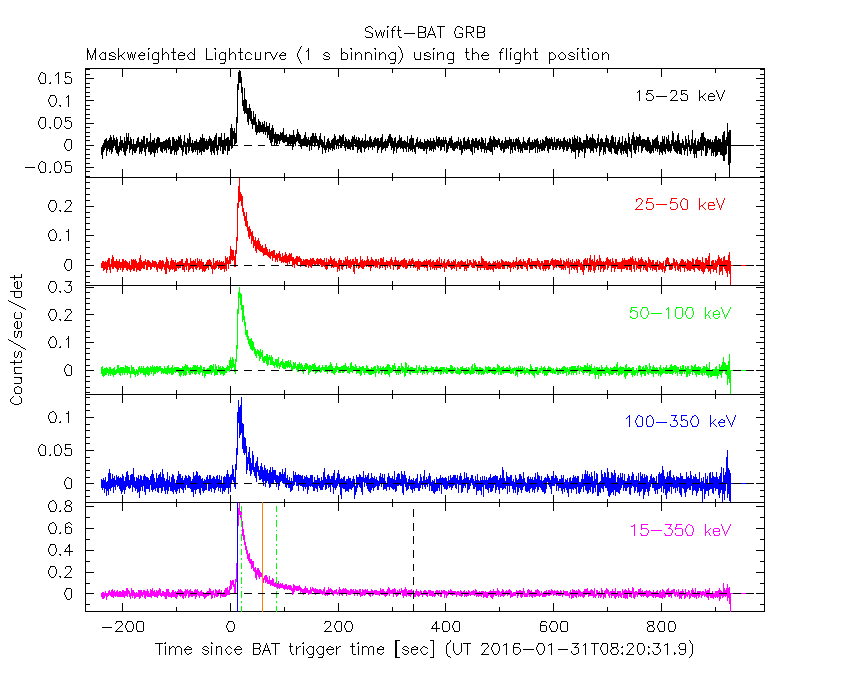
Lightcurves
Notes:
- 1) The mask-weighted light curves are using the flight position.
- 2) Multiple plots of different time binning/intervals are shown to cover all scenarios of short/long GRBs, rate/image triggers, and real/false positives.
- 3) For all the mask-weighted lightcurves, the y-axis units are counts/sec/det where a det is 0.4 x 0.4 = 0.16 sq cm.
- 4) The verticle lines correspond to following: green dotted lines are T50 interval, black dotted lines are T90 interval, blue solid line(s) is a spacecraft slew start time, and orange solid line(s) is a spacecraft slew end time.
- 5) Time of each bin is in the middle of the bin.
1 s binning
From T0-310 s to T0+310 s

From T100_start - 20 s to T100_end + 30 s

Full time interval
64 ms binning
Full time interval

From T100_start to T100_end

From T0-5 sec to T0+5 sec

16 ms binning
From T100_start-5 s to T100_start+5 s

Blue+Cyan dotted lines: Time interval of the scaled map
From 0.000000 to 1.024000
8 ms binning
From T100_start-3 s to T100_start+3 s

Blue+Cyan dotted lines: Time interval of the scaled map
From 0.000000 to 1.024000
2 ms binning
From T100_start-1 s to T100_start+1 s

Blue+Cyan dotted lines: Time interval of the scaled map
From 0.000000 to 1.024000
SN=5 or 10 sec. binning (whichever binning is satisfied first)

SN=5 or 10 sec. binning (T < 200 sec)

Quad-rate summed light curves (from T0-300s to T0+1000s)

Spectral Evolution

Spectra
Notes:
- 1) The fitting includes the systematic errors.
- 2) When the burst includes telescope slew time periods, the fitting uses an average response file made from multiple 5-s response files through out the slew time plus single time preiod for the non-slew times, and weighted by the total counts in the corresponding time period using addrmf. An average response file is needed becuase a spectral fit using the pre-slew DRM will introduce some errors in both a spectral shape and a normalization if the PHA file contains a lot of the slew/post-slew time interval.
- 3) For fits to more complicated models (e.g. a power-law over a cutoff power-law), the BAT team has decided to require a chi-square improvement of more than 6 for each extra dof.
Time averaged spectrum fit using the average DRM
Power-law model

Time interval is from   -1.492 sec. to  773.032 sec.

Spectral model in power-law:
------------------------------------------------------------
Parameters  : value       lower 90%   higher 90%
Photon index: 1.21193     ( -0.0455391   0.0453108 )
Norm@50keV  : 2.56990E-03    ( -6.08443e-05   6.07313e-05 )
------------------------------------------------------------
#Fit statistic : Chi-Squared =          54.43 using 59 PHA bins.
# Reduced chi-squared =         0.9549 for     57 degrees of freedom
# Null hypothesis probability =   5.721771e-01

Photon flux (15-150 keV)    in 774.5 sec: 0.302172 ( -0.007807  0.00784 ) ph/cm2/s
Energy fluence (15-150 keV)             : 2.0128e-05 ( -4.89376e-07  4.90216e-07 ) ergs/cm2
Cutoff power-law model

Time interval is from   -1.492 sec. to  773.032 sec.
Spectral model in the cutoff power-law:
------------------------------------------------------------
Parameters  : value       lower 90%   higher 90%
Photon index: 1.20944     ( -0.0478891   0.0437552 )
Epeak [keV] : 9999.36      ( -9999.36 -9999.36 )
Norm@50keV  : 2.58082E-03    ( -6.05887e-05   0.000235772 )
------------------------------------------------------------
#Fit statistic : Chi-Squared =          54.54 using 59 PHA bins.
# Reduced chi-squared =         0.9739 for     56 degrees of freedom
# Null hypothesis probability =   5.302476e-01

Photon flux (15-150 keV)    in 774.5 sec: 0.304470 ( -0.010203  0.005433 ) ph/cm2/s
Energy fluence (15-150 keV)             : 2.02279e-05 ( -5.95164e-07  3.8366e-07 ) ergs/cm2
Band function

Time interval is from   -1.492 sec. to  773.032 sec.

Spectral model in the Band function:
------------------------------------------------------------
Parameters  : value       lower 90%   higher 90%
alpha       : -0.830461   ( 0.828501   0.828501 )
beta        : -1.22099    ( -0.0608081   0.0523666 )
Epeak [keV] : 91.9356      ( -93.8195 477.325 )
Norm@50keV   : 4.61092E-03    ( -0.00205535   0 )
------------------------------------------------------------
#Fit statistic : Chi-Squared =          54.18 using 59 PHA bins.
# Reduced chi-squared =         0.9850 for     55 degrees of freedom
# Null hypothesis probability =   5.061111e-01

Photon flux (15-150 keV)    in 774.5 sec:  (    ) ph/cm2/s
Energy fluence (15-150 keV)             : 0 ( 0  0 ) ergs/cm2
Single BB

Spectral model blackbody:
------------------------------------------------------------
Parameters  : value    Lower 90%  Upper 90%
kT [keV]    : 20.8103  (  )
R^2/D10^2   : 1.17055E-02  (   )
(R is the radius in km and D10 is the distance to the source in units of 10 kpc)
------------------------------------------------------------
#Fit statistic : Chi-Squared =         450.55 using 59 PHA bins.
# Reduced chi-squared =         7.9044 for     57 degrees of freedom
# Null hypothesis probability =   1.450392e-62

Energy  Fluence     90% Error
[keV]   [erg/cm2]   [erg/cm2]
15- 25  7.446e-07   3.671e-08
25- 50  3.806e-06   1.375e-07
50-150  1.227e-05   4.453e-07
15-150  1.682e-05   4.724e-07
Thermal bremsstrahlung (OTTB)

Spectral model: thermal bremsstrahlung
------------------------------------------------------------
Parameters  : value         Lower 90%    Upper 90%
kT [keV]    : 199.363       (      )
Norm        : 1.29809       (     )
------------------------------------------------------------
#Fit statistic : Chi-Squared =         250.77 using 59 PHA bins.
# Reduced chi-squared =         4.3996 for     57 degrees of freedom
# Null hypothesis probability =   3.932136e-26

Energy  Fluence     90% Error
[keV]   [erg/cm2]   [erg/cm2]
15- 25  2.503e-06   6.428e-08
25- 50  4.816e-06   1.301e-07
50-150  1.056e-05   2.749e-07
15-150  1.788e-05   4.492e-07
Double BB

Spectral model: bbodyrad<1> + bbodyrad<2>
------------------------------------------------------------
Parameters  : value         Lower 90%    Upper 90%
kT1 [keV]   : 8.73220        (-0.761006      0.818203)
R1^2/D10^2  : 0.132098        (-0.0324009      0.0457515)
kT2 [keV]   : 38.8012        (-4.10307      5.69717)
R2^2/D10^2  : 1.36929E-03    (-0.000452879   0.000565701)
------------------------------------------------------------
#Fit statistic : Chi-Squared =          57.28 using 59 PHA bins.
# Reduced chi-squared =          1.041 for     55 degrees of freedom
# Null hypothesis probability =   3.905106e-01

Energy  Fluence     90% Error
[keV]   [erg/cm2]   [erg/cm2]
15- 25  1.705e-06   1.382e-07
25- 50  4.450e-06   2.064e-07
50-150  1.415e-05   1.084e-06
15-150  2.030e-05   1.204e-06
Peak spectrum fit
Power-law model

Time interval is from   15.972 sec. to   16.972 sec.

Spectral model in power-law:
------------------------------------------------------------
Parameters  : value       lower 90%   higher 90%
Photon index: 1.06950     ( -0.0977638   0.0972536 )
Norm@50keV  : 5.48944E-02    ( -0.00297656   0.00297655 )
------------------------------------------------------------
#Fit statistic : Chi-Squared =          42.62 using 59 PHA bins.
# Reduced chi-squared =         0.7477 for     57 degrees of freedom
# Null hypothesis probability =   9.217109e-01

Photon flux (15-150 keV)    in 1 sec: 0.299354 (    ) ph/cm2/s
Energy fluence (15-150 keV)             : 5.79709e-07 ( -3.63211e-08  3.6517e-08 ) ergs/cm2
Cutoff power-law model

Time interval is from   15.972 sec. to   16.972 sec.
Spectral model in the cutoff power-law:
------------------------------------------------------------
Parameters  : value       lower 90%   higher 90%
Photon index: 1.06432     ( -0.328591   0.235603 )
Epeak [keV] : 9998.11      ( -9998.02 -9998.02 )
Norm@50keV  : 5.52024E-02    ( -0.00299326   0.0274489 )
------------------------------------------------------------
#Fit statistic : Chi-Squared =          42.61 using 59 PHA bins.
# Reduced chi-squared =         0.7609 for     56 degrees of freedom
# Null hypothesis probability =   9.063104e-01

Photon flux (15-150 keV)    in 1 sec: 6.34267 ( -0.35024  0.36289 ) ph/cm2/s
Energy fluence (15-150 keV)             : 5.78709e-07 ( -3.99928e-08  3.84968e-08 ) ergs/cm2
Band function

Time interval is from   15.972 sec. to   16.972 sec.

Spectral model in the Band function:
------------------------------------------------------------
Parameters  : value       lower 90%   higher 90%
alpha       : -0.691968   ( 0.693804   5.33143 )
beta        : -1.11924    ( 1.11771   0.135895 )
Epeak [keV] : 132.357      ( -128.492 471.72 )
Norm@50keV   : 9.13013E-02    ( -0.042418   0 )
------------------------------------------------------------
#Fit statistic : Chi-Squared =          42.11 using 59 PHA bins.
# Reduced chi-squared =         0.7657 for     55 degrees of freedom
# Null hypothesis probability =   8.989704e-01

Photon flux (15-150 keV)    in 1 sec:  (    ) ph/cm2/s
Energy fluence (15-150 keV)             : 0 ( 0  0 ) ergs/cm2
Single BB

Spectral model blackbody:
------------------------------------------------------------
Parameters  : value    Lower 90%  Upper 90%
kT [keV]    : 20.0184  (  )
R^2/D10^2   : 0.296412  (   )
(R is the radius in km and D10 is the distance to the source in units of 10 kpc)
------------------------------------------------------------
#Fit statistic : Chi-Squared =         117.15 using 59 PHA bins.
# Reduced chi-squared =         2.0552 for     57 degrees of freedom
# Null hypothesis probability =   4.781402e-06

Energy  Fluence     90% Error
[keV]   [erg/cm2]   [erg/cm2]
15- 25  2.289e-08   2.475e-09
25- 50  1.141e-07   9.100e-09
50-150  3.390e-07   3.550e-08
15-150  4.760e-07   3.505e-08
Thermal bremsstrahlung (OTTB)

Spectral model: thermal bremsstrahlung
------------------------------------------------------------
Parameters  : value         Lower 90%    Upper 90%
kT [keV]    : 200.000       (-8.26833      -200)
Norm        : 25.3525       (-1.42475     1.42475)
------------------------------------------------------------
#Fit statistic : Chi-Squared =         106.17 using 59 PHA bins.
# Reduced chi-squared =         1.8626 for     57 degrees of freedom
# Null hypothesis probability =   8.421574e-05

Energy  Fluence     90% Error
[keV]   [erg/cm2]   [erg/cm2]
15- 25  6.313e-08   3.935e-09
25- 50  1.214e-07   7.900e-09
50-150  2.663e-07   6.260e-08
15-150  4.509e-07   7.000e-08
Double BB

Spectral model: bbodyrad<1> + bbodyrad<2>
------------------------------------------------------------
Parameters  : value         Lower 90%    Upper 90%
kT1 [keV]   : 9.09235        (-1.609      1.78926)
R1^2/D10^2  : 2.28302        (-0.913416      1.80804)
kT2 [keV]   : 41.4070        (-8.85042      18.8183)
R2^2/D10^2  : 2.66154E-02    (-0.0167622   0.0284419)
------------------------------------------------------------
#Fit statistic : Chi-Squared =          41.06 using 59 PHA bins.
# Reduced chi-squared =         0.7465 for     55 degrees of freedom
# Null hypothesis probability =   9.187331e-01

Energy  Fluence     90% Error
[keV]   [erg/cm2]   [erg/cm2]
15- 25  4.268e-08   9.055e-09
25- 50  1.193e-07   2.071e-08
50-150  4.257e-07   1.615e-07
15-150  5.878e-07   1.717e-07
Pre-slew spectrum (Pre-slew PHA with pre-slew DRM)
Power-law model

Spectral model in power-law:
------------------------------------------------------------
Parameters  : value       lower 90%   higher 90%
Photon index: 1.12595     ( -0.111187   0.109662 )
Norm@50keV  : 8.36598E-03    ( -0.000494432   0.000493458 )
------------------------------------------------------------
#Fit statistic : Chi-Squared =          65.99 using 59 PHA bins.
# Reduced chi-squared =          1.158 for     57 degrees of freedom
# Null hypothesis probability =   1.941390e-01

Photon flux (15-150 keV)    in 15.05 sec: 0.972983 ( -0.0598504  0.0600906 ) ph/cm2/s
Energy fluence (15-150 keV)             : 1.30571e-06 ( -8.39188e-08  8.42096e-08 ) ergs/cm2
Cutoff power-law model

Spectral model in the cutoff power-law:
------------------------------------------------------------
Parameters  : value       lower 90%   higher 90%
Photon index: 1.12618     ( -0.116748   0.105847 )
Epeak [keV] : 9999.36      ( -9999.36 -9999.36 )
Norm@50keV  : 8.41183E-03    ( -0.000492448   0.00203531 )
------------------------------------------------------------
#Fit statistic : Chi-Squared =          66.04 using 59 PHA bins.
# Reduced chi-squared =          1.179 for     56 degrees of freedom
# Null hypothesis probability =   1.686656e-01

Photon flux (15-150 keV)    in 15.05 sec: 0.972884 ( -0.05948  0.059736 ) ph/cm2/s
Energy fluence (15-150 keV)             : 1.30241e-06 ( -8.04663e-08  8.89229e-08 ) ergs/cm2
Band function

Spectral model in the Band function:
------------------------------------------------------------
Parameters  : value       lower 90%   higher 90%
alpha       : -0.909217   ( 0.909217   0.909217 )
beta        : -1.12596    ( 1.12596   0.111198 )
Epeak [keV] : 50.5940      ( -50.594 -50.594 )
Norm@50keV   : 1.47110E-02    ( -0.00675498   361048 )
------------------------------------------------------------
#Fit statistic : Chi-Squared =          65.99 using 59 PHA bins.
# Reduced chi-squared =          1.200 for     55 degrees of freedom
# Null hypothesis probability =   1.474399e-01

Photon flux (15-150 keV)    in 15.05 sec:  (    ) ph/cm2/s
Energy fluence (15-150 keV)             : 0 ( 0  0 ) ergs/cm2
S(25-50 keV) vs. S(50-100 keV) plot

S(25-50 keV)  = 4.26e-06
S(50-100 keV) = 7.35e-06
T90 vs. Hardness ratio plot

T90                                   = 327.751999974251 sec.
Hardness ratio (energy fluence ratio) = 1.72535
Color vs. Color plot

Count Ratio  (25-50 keV) / (15-25 keV) = 1.54677
Count Ratio (50-100 keV) / (15-25 keV) = 1.38191
Mask shadow pattern

IMX = -2.262474928634723E-02, IMY = 4.397838829652273E-01
TIME vs. PHA plot around the trigger time

Blue+Cyan dotted lines: Time interval of the scaled map
From 0.000000 to 1.024000
TIME vs. DetID plot around the trigger time

Blue+Cyan dotted lines: Time interval of the scaled map
From 0.000000 to 1.024000
100 us light curve (15-350 keV)

Blue+Cyan dotted lines: Time interval of the scaled map
From 0.000000 to 1.024000
Spacecraft aspect plot

Bright source in the pre-burst/pre-slew/post-slew images
Pre-burst image of 15-350 keV band
Time interval of the image:
-239.744000 -1.492000

# RAcent  DECcent POSerr Theta    Phi  PeakCts   SNR AngSep     Name
#  [deg]    [deg]    ['] [deg]  [deg]                   [']
 83.6333  22.0204    0.3  21.5  -10.0  10.2836  40.6    0.4	Crab
137.7041 -12.9898    2.9  43.5  145.4   2.8604   4.0 ------	UNKNOWN
119.3974 -12.5314    3.2  28.0  160.7   1.0571   3.6 ------	UNKNOWN
 66.8802  -6.3287    2.4  33.5  -81.2   2.1750   4.8 ------	UNKNOWN
 54.3359   5.2262    3.1  43.6  -59.0   4.0934   3.7 ------	UNKNOWN
 46.2003  17.8106    3.7  52.1  -42.4   4.4166   3.2 ------	UNKNOWN
Pre-slew background subtracted image of 15-350 keV band
Time interval of the image:
-1.492000 13.556590

# RAcent  DECcent POSerr Theta    Phi  PeakCts   SNR AngSep     Name
#  [deg]    [deg]    ['] [deg]  [deg]                   [']
 83.4390  22.0740    6.8  21.6  -10.3  -0.0953  -1.7   11.4	Crab
134.7125  20.4425    2.8  38.3   93.6   0.8650   4.0 ------	UNKNOWN
120.6399  25.5193    1.9  29.1   74.6   0.5340   6.1 ------	UNKNOWN
112.3852   5.2936    2.1  14.1  121.0   0.3093   5.5 ------	UNKNOWN
 62.4669  40.0264    2.1  46.9   -8.2   0.5231   5.4 ------	UNKNOWN
 59.5657  29.1803    2.8  43.3  -23.1   0.3628   4.1 ------	UNKNOWN
 78.1686  -7.0385    0.4  23.8  -92.9   1.9695  27.0 ------	UNKNOWN
Post-slew image of 15-350 keV band
Time interval of the image:
58.956600 596.256590

# RAcent  DECcent POSerr Theta    Phi  PeakCts   SNR AngSep     Name
#  [deg]    [deg]    ['] [deg]  [deg]                   [']
 83.6467  22.0133    0.4  29.5   35.5  21.7736  31.7    0.8	Crab
117.5304 -21.1441    2.0  40.5  139.7   8.0959   5.7 ------	UNKNOWN
115.6033 -53.2756    3.3  55.3  179.0  10.1326   3.4 ------	UNKNOWN
 78.1886  -7.0450    0.6   0.0  -65.9  10.1667  19.1 ------	UNKNOWN
 29.7844  13.0531    3.7  52.1  -42.2  11.5276   3.1 ------	UNKNOWN
Plot creation:
Fri Mar 18 11:44:21 EDT 2016