Special notes of this burst
Image
Pre-slew 15.0-350.0 keV image (Event data)
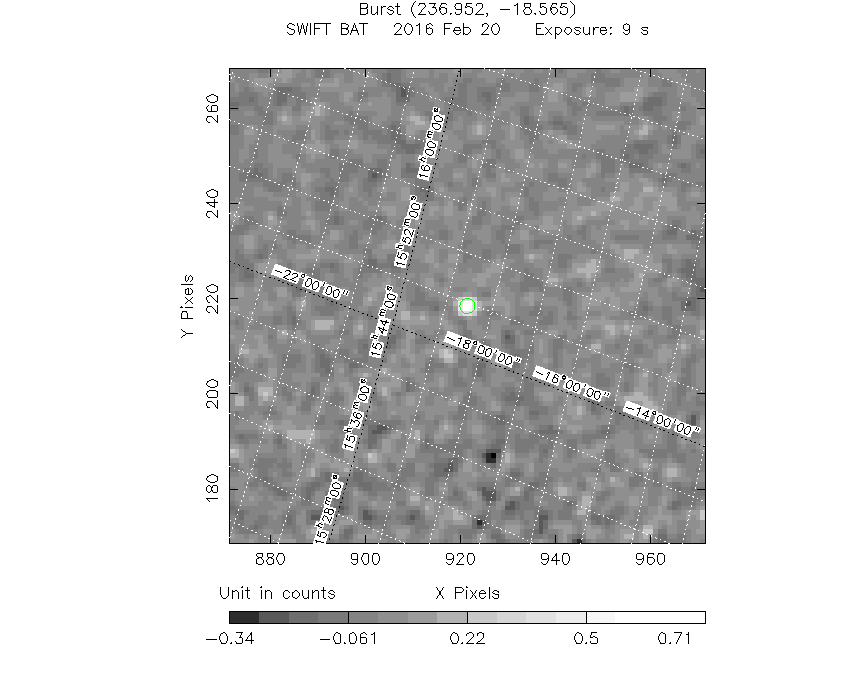
#   RAcent    DECcent   POSerr    Theta     Phi              Peak Cts       SNR   Name
  236.9405   -18.5424   0.0143    28.7834    99.1988         0.8934490     13.625 TRIG_00674670

Foreground time interval of the image:
 -0.100   8.988 (delta_t =   9.088 [sec])
Background time interval of the image:
-239.568  -0.100 (delta_t = 239.468 [sec])
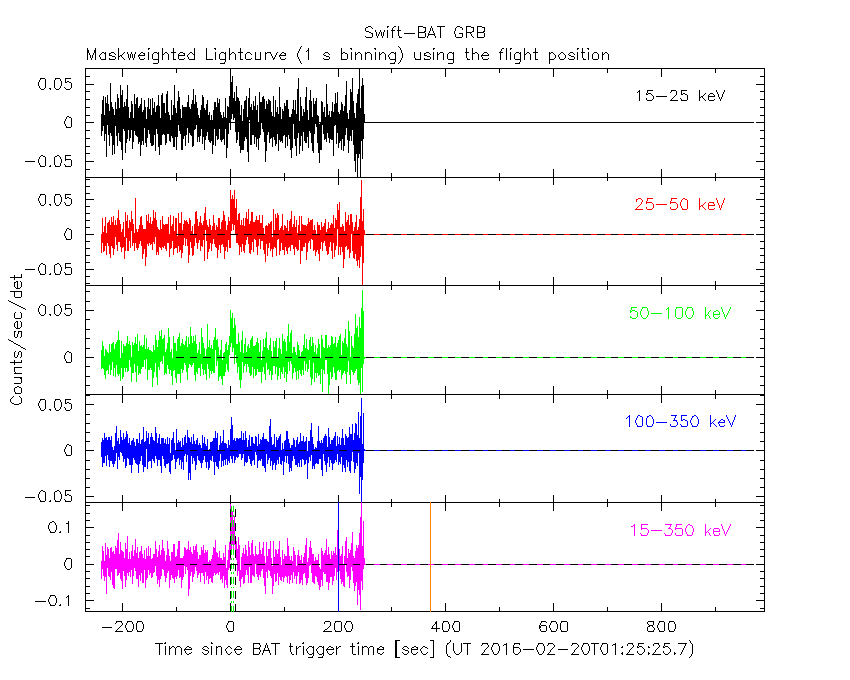
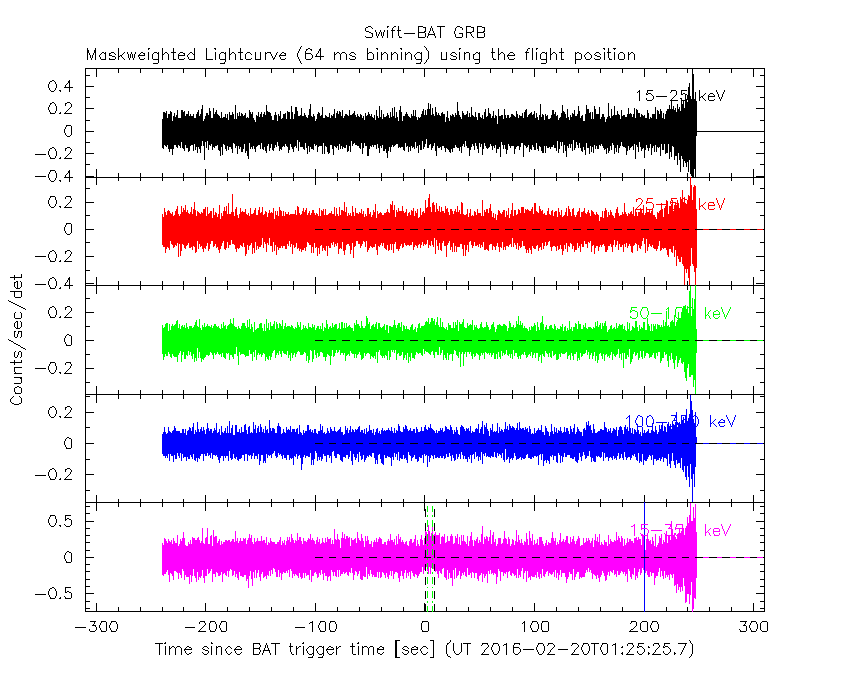
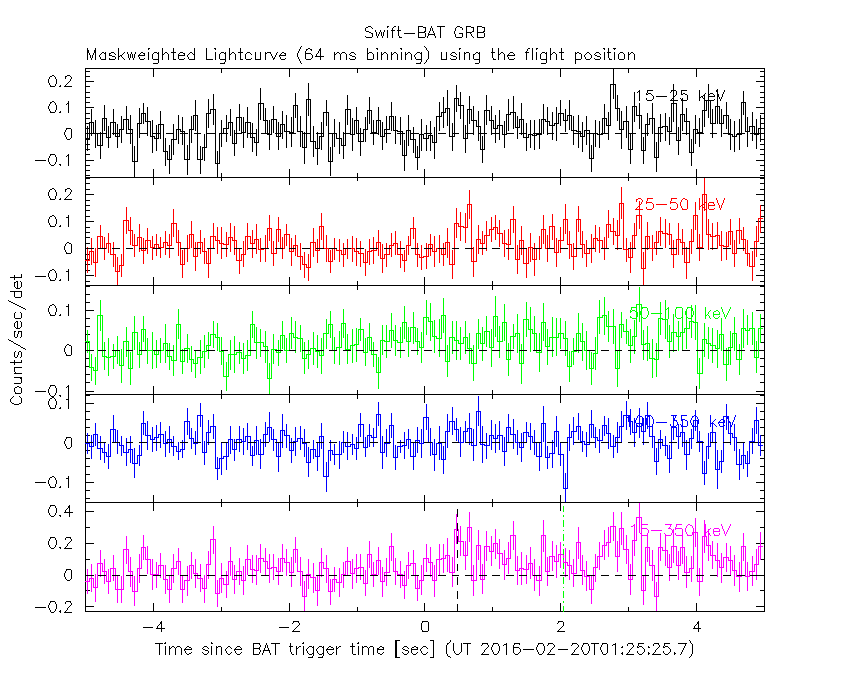
Lightcurves
Notes:
- 1) The mask-weighted light curves are using the flight position.
- 2) Multiple plots of different time binning/intervals are shown to cover all scenarios of short/long GRBs, rate/image triggers, and real/false positives.
- 3) For all the mask-weighted lightcurves, the y-axis units are counts/sec/det where a det is 0.4 x 0.4 = 0.16 sq cm.
- 4) The verticle lines correspond to following: green dotted lines are T50 interval, black dotted lines are T90 interval, blue solid line(s) is a spacecraft slew start time, and orange solid line(s) is a spacecraft slew end time.
- 5) Time of each bin is in the middle of the bin.
1 s binning
From T0-310 s to T0+310 s

From T100_start - 20 s to T100_end + 30 s

Full time interval
64 ms binning
Full time interval
From T100_start to T100_end

From T0-5 sec to T0+5 sec
16 ms binning
From T100_start-5 s to T100_start+5 s
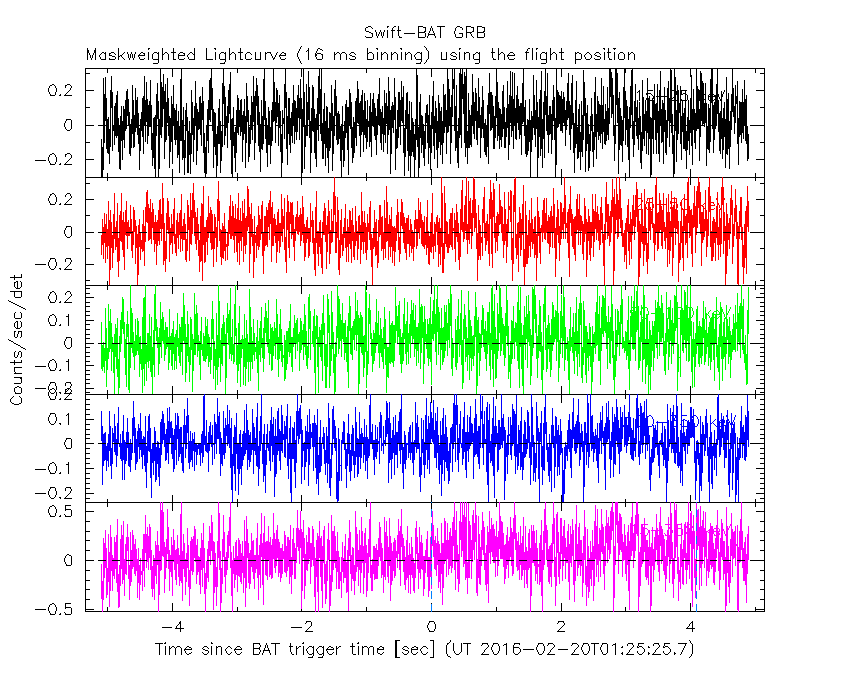
Blue+Cyan dotted lines: Time interval of the scaled map
From 0.000000 to 4.096000
8 ms binning
From T100_start-3 s to T100_start+3 s

Blue+Cyan dotted lines: Time interval of the scaled map
From 0.000000 to 4.096000
2 ms binning
From T100_start-1 s to T100_start+1 s
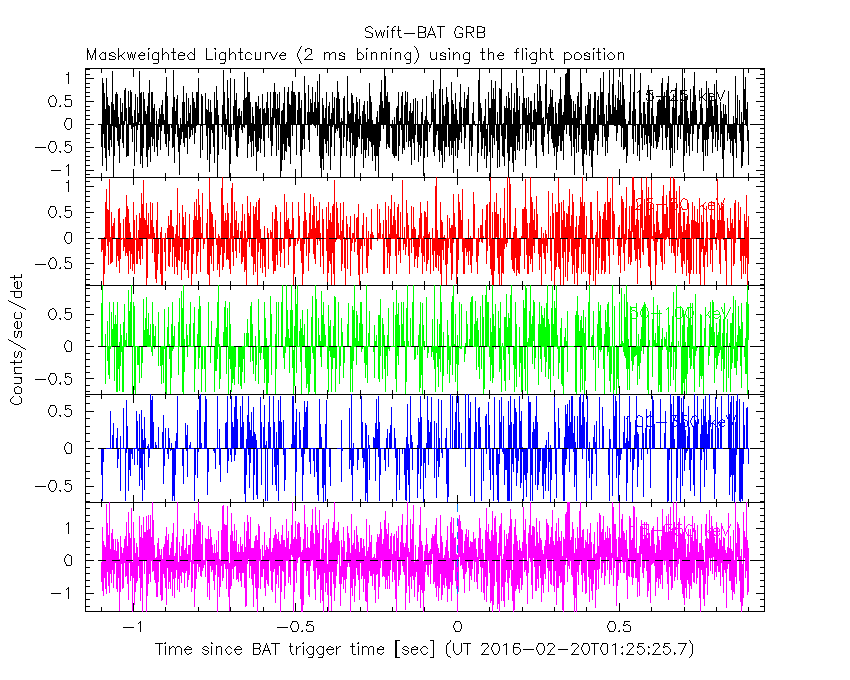
Blue+Cyan dotted lines: Time interval of the scaled map
From 0.000000 to 4.096000
SN=5 or 10 sec. binning (whichever binning is satisfied first)
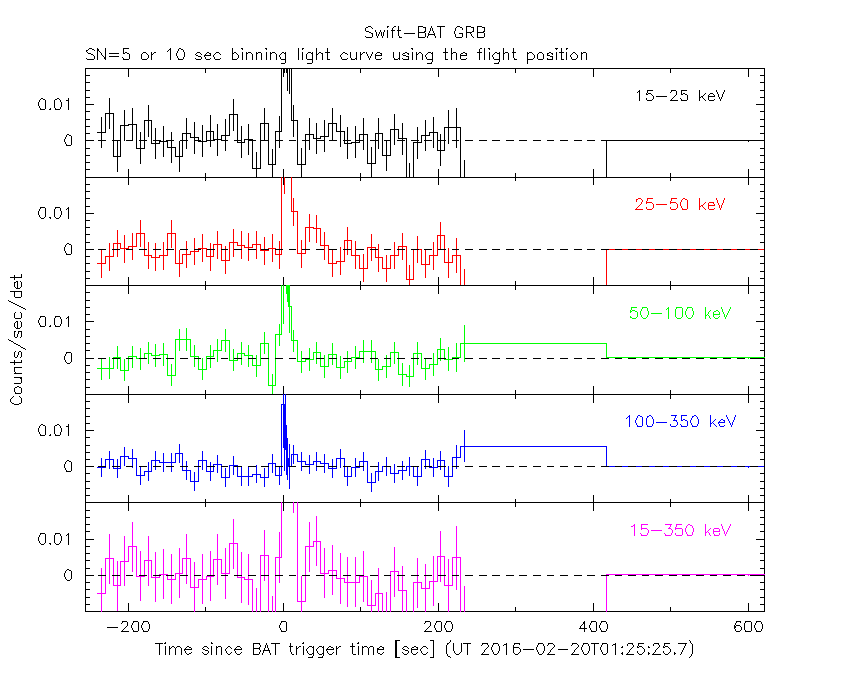
SN=5 or 10 sec. binning (T < 200 sec)

Quad-rate summed light curves (from T0-300s to T0+1000s)

Spectral Evolution

Spectra
Notes:
- 1) The fitting includes the systematic errors.
- 2) When the burst includes telescope slew time periods, the fitting uses an average response file made from multiple 5-s response files through out the slew time plus single time preiod for the non-slew times, and weighted by the total counts in the corresponding time period using addrmf. An average response file is needed becuase a spectral fit using the pre-slew DRM will introduce some errors in both a spectral shape and a normalization if the PHA file contains a lot of the slew/post-slew time interval.
- 3) For fits to more complicated models (e.g. a power-law over a cutoff power-law), the BAT team has decided to require a chi-square improvement of more than 6 for each extra dof.
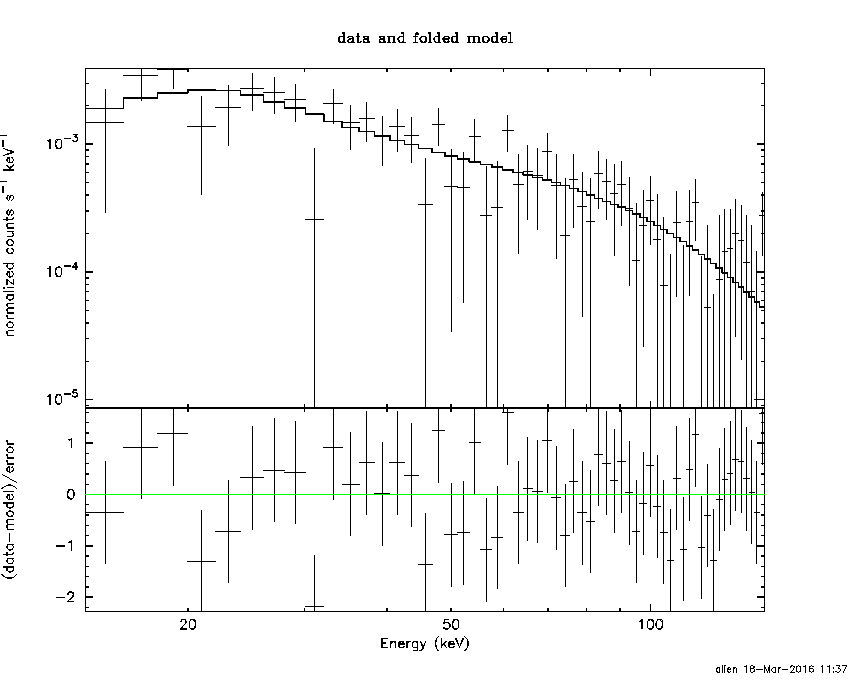
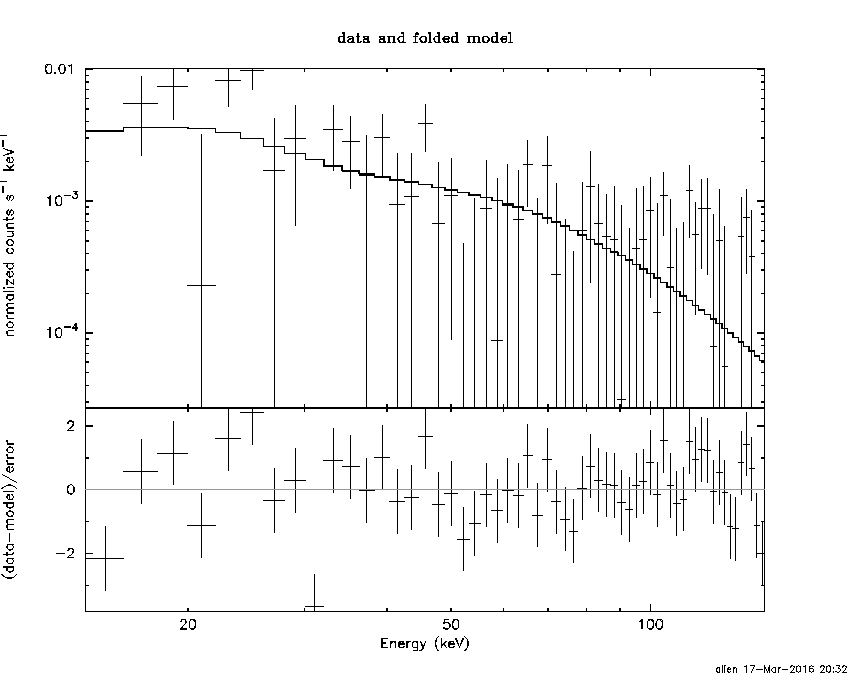
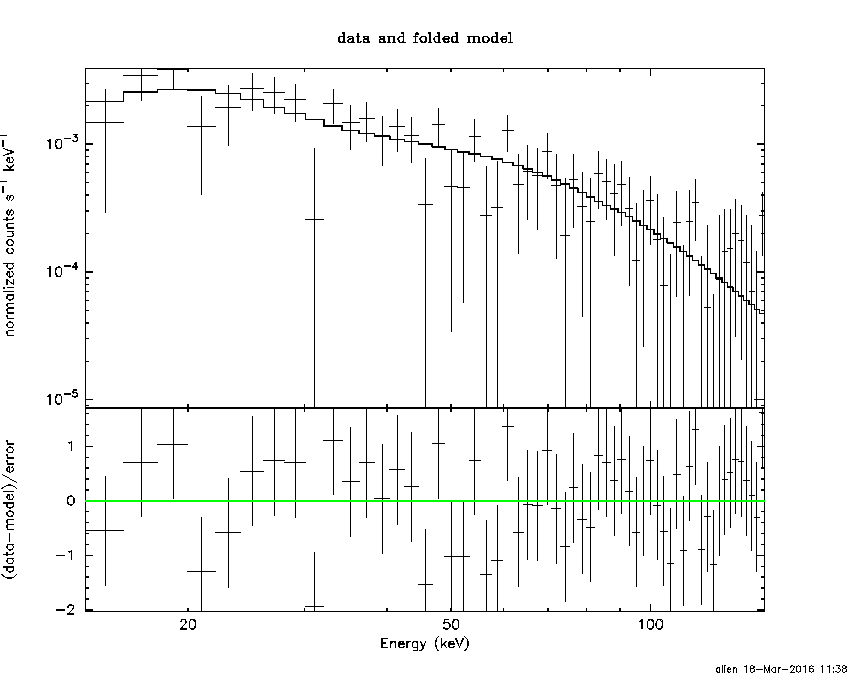
Time averaged spectrum fit using the average DRM
Power-law model

Time interval is from   -0.100 sec. to    8.988 sec.

Spectral model in power-law:
------------------------------------------------------------
Parameters  : value       lower 90%   higher 90%
Photon index: 1.51366     ( -0.245663   0.245003 )
Norm@50keV  : 5.96335E-03    ( -0.000793522   0.000789932 )
------------------------------------------------------------
#Fit statistic : Chi-Squared =          39.06 using 59 PHA bins.
# Reduced chi-squared =         0.6853 for     57 degrees of freedom
# Null hypothesis probability =   9.666305e-01

Photon flux (15-150 keV)    in 9.088 sec: 0.747248 ( -0.102904  0.103523 ) ph/cm2/s
Energy fluence (15-150 keV)             : 5.1306e-07 ( -7.36013e-08  7.43321e-08 ) ergs/cm2
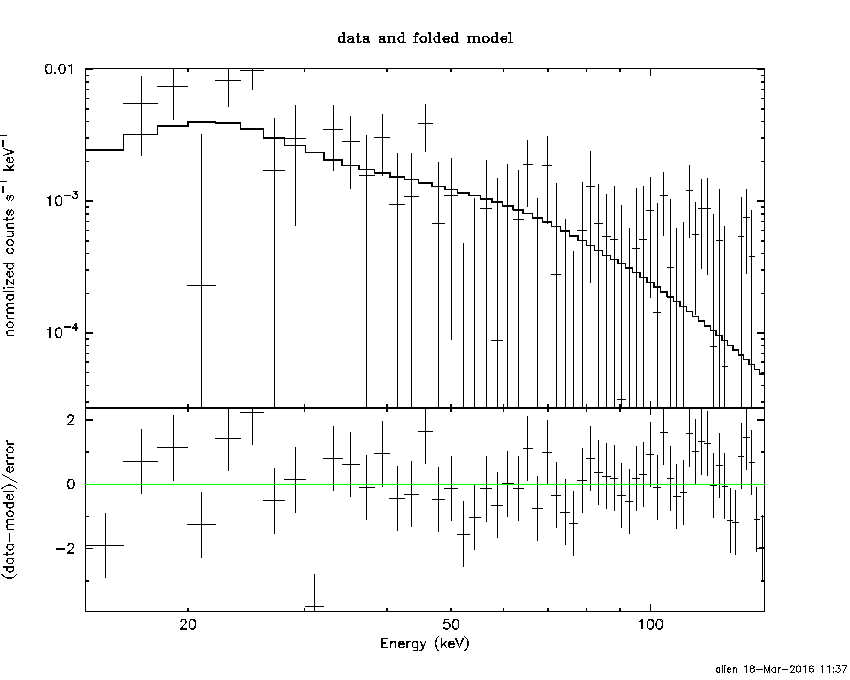
Cutoff power-law model

Time interval is from   -0.100 sec. to    8.988 sec.
Spectral model in the cutoff power-law:
------------------------------------------------------------
Parameters  : value       lower 90%   higher 90%
Photon index: 1.50906     ( -0.42805   0.248151 )
Epeak [keV] : 9999.31      ( -9999.36 -9999.36 )
Norm@50keV  : 5.98181E-03    ( -0.00501503   0.00674233 )
------------------------------------------------------------
#Fit statistic : Chi-Squared =          39.07 using 59 PHA bins.
# Reduced chi-squared =         0.6977 for     56 degrees of freedom
# Null hypothesis probability =   9.583980e-01

Photon flux (15-150 keV)    in 9.088 sec: 0.754351 ( -0.151221  0.137386 ) ph/cm2/s
Energy fluence (15-150 keV)             : 5.19623e-07 ( -8.14067e-08  6.66076e-08 ) ergs/cm2
Band function

Time interval is from   -0.100 sec. to    8.988 sec.

Spectral model in the Band function:
------------------------------------------------------------
Parameters  : value       lower 90%   higher 90%
alpha       : 4.83603   ( -4.83603   -4.83603 )
beta        : -1.53730    ( -0.264863   0.255236 )
Epeak [keV] : 20.6217      ( -20.6217 9.84478 )
Norm@50keV   : 1551.36    ( -202.73   3.66025e+06 )
------------------------------------------------------------
#Fit statistic : Chi-Squared =          38.86 using 59 PHA bins.
# Reduced chi-squared =         0.7065 for     55 degrees of freedom
# Null hypothesis probability =   9.512120e-01

Photon flux (15-150 keV)    in 9.088 sec:  (    ) ph/cm2/s
Energy fluence (15-150 keV)             : 0 ( 0  0 ) ergs/cm2
Single BB

Spectral model blackbody:
------------------------------------------------------------
Parameters  : value    Lower 90%  Upper 90%
kT [keV]    : 15.0330  (-2.86611  3.76507)
R^2/D10^2   : 7.97726E-02  (-0.0791646   0.0906241)
(R is the radius in km and D10 is the distance to the source in units of 10 kpc)
------------------------------------------------------------
#Fit statistic : Chi-Squared =          59.42 using 59 PHA bins.
# Reduced chi-squared =          1.042 for     57 degrees of freedom
# Null hypothesis probability =   3.875260e-01

Energy  Fluence     90% Error
[keV]   [erg/cm2]   [erg/cm2]
15- 25  3.429e-08   9.765e-09
25- 50  1.365e-07   3.108e-08
50-150  2.102e-07   6.053e-08
15-150  3.810e-07   7.352e-08
Thermal bremsstrahlung (OTTB)

Spectral model: thermal bremsstrahlung
------------------------------------------------------------
Parameters  : value         Lower 90%    Upper 90%
kT [keV]    : 199.363       (-81.7271      -199.363)
Norm        : 3.04714       (-0.399819     0.399901)
------------------------------------------------------------
#Fit statistic : Chi-Squared =          40.08 using 59 PHA bins.
# Reduced chi-squared =         0.7032 for     57 degrees of freedom
# Null hypothesis probability =   9.564820e-01

Energy  Fluence     90% Error
[keV]   [erg/cm2]   [erg/cm2]
15- 25  6.896e-08   3.909e-08
25- 50  1.326e-07   7.402e-08
50-150  2.909e-07   1.608e-07
15-150  4.925e-07   2.745e-07
Double BB
Spectral model: bbodyrad<1> + bbodyrad<2>
------------------------------------------------------------
Parameters  : value         Lower 90%    Upper 90%
kT1 [keV]   : 7.60339        (-2.2176      2.79689)
R1^2/D10^2  : 0.686283        (-0.447483      1.67603)
kT2 [keV]   : 37.8594        (-14.738      -37.8674)
R2^2/D10^2  : 2.93400E-03    (-0.00283594   0.0117996)
------------------------------------------------------------
#Fit statistic : Chi-Squared =          38.22 using 59 PHA bins.
# Reduced chi-squared =         0.6949 for     55 degrees of freedom
# Null hypothesis probability =   9.585381e-01

Energy  Fluence     90% Error
[keV]   [erg/cm2]   [erg/cm2]
15- 25  6.774e-08   3.764e-08
25- 50  1.345e-07   6.388e-08
50-150  3.288e-07   1.761e-07
15-150  5.311e-07   2.592e-07
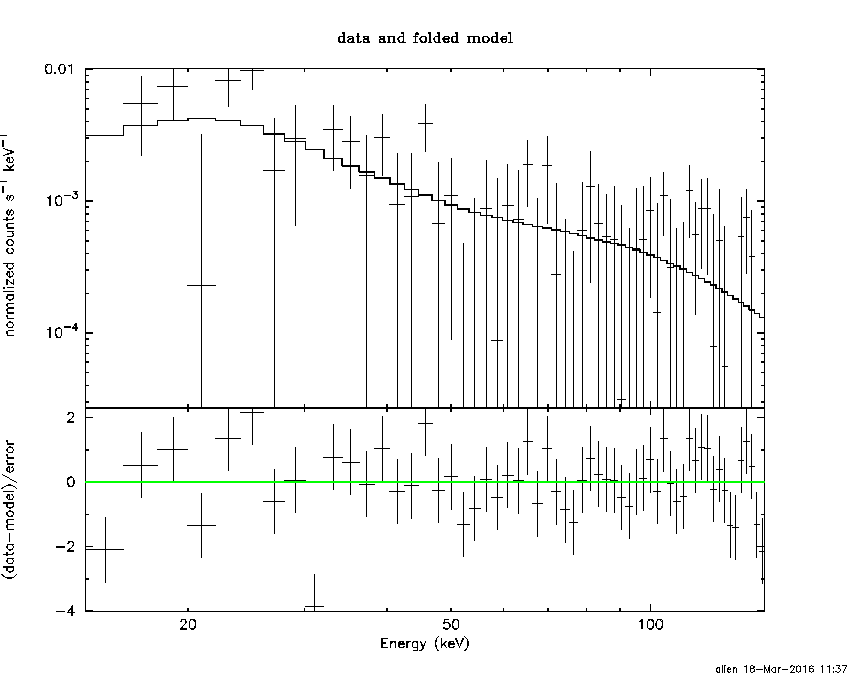
Peak spectrum fit
Power-law model
Time interval is from    0.328 sec. to    1.328 sec.

Spectral model in power-law:
------------------------------------------------------------
Parameters  : value       lower 90%   higher 90%
Photon index: 1.54583     ( -0.607714   0.567037 )
Norm@50keV  : 7.94608E-03    ( -0.00237699   0.00233403 )
------------------------------------------------------------
#Fit statistic : Chi-Squared =          67.40 using 59 PHA bins.
# Reduced chi-squared =          1.182 for     57 degrees of freedom
# Null hypothesis probability =   1.630972e-01

Photon flux (15-150 keV)    in 1 sec: 1.00474 ( -0.306975  0.30976 ) ph/cm2/s
Energy fluence (15-150 keV)             : 7.486e-08 ( -2.35998e-08  2.43076e-08 ) ergs/cm2
Cutoff power-law model

Time interval is from    0.328 sec. to    1.328 sec.
Spectral model in the cutoff power-law:
------------------------------------------------------------
Parameters  : value       lower 90%   higher 90%
Photon index: 2.10498     ( -1.87888   0.823312 )
Epeak [keV] : 40.5690      (   )
Norm@50keV  : 3.89640E-03    (     )
------------------------------------------------------------
#Fit statistic : Chi-Squared =          67.15 using 59 PHA bins.
# Reduced chi-squared =          1.199 for     56 degrees of freedom
# Null hypothesis probability =   1.461592e-01

Photon flux (15-150 keV)    in 1 sec: 1.00939 ( -0.30834  0.30705 ) ph/cm2/s
Energy fluence (15-150 keV)             : 4.41225e-08 ( 0  0 ) ergs/cm2
Band function
Time interval is from    0.328 sec. to    1.328 sec.

Spectral model in the Band function:
------------------------------------------------------------
Parameters  : value       lower 90%   higher 90%
alpha       : 4.92340   ( -4.9234   -4.9234 )
beta        : -1.77448    ( -0.859387   0.70925 )
Epeak [keV] : 25.6212      ( -25.6212 10.3507 )
Norm@50keV   : 725.237    ( -206.467   7.2951e+06 )
------------------------------------------------------------
#Fit statistic : Chi-Squared =          66.34 using 59 PHA bins.
# Reduced chi-squared =          1.206 for     55 degrees of freedom
# Null hypothesis probability =   1.405785e-01

Photon flux (15-150 keV)    in 1 sec:  (    ) ph/cm2/s
Energy fluence (15-150 keV)             : 0 ( 0  0 ) ergs/cm2
Single BB

Spectral model blackbody:
------------------------------------------------------------
Parameters  : value    Lower 90%  Upper 90%
kT [keV]    : 10.8103  (-3.67609  13.0461)
R^2/D10^2   : 0.344916  (-0.338176   1.37571)
(R is the radius in km and D10 is the distance to the source in units of 10 kpc)
------------------------------------------------------------
#Fit statistic : Chi-Squared =          73.01 using 59 PHA bins.
# Reduced chi-squared =          1.281 for     57 degrees of freedom
# Null hypothesis probability =   7.500196e-02

Energy  Fluence     90% Error
[keV]   [erg/cm2]   [erg/cm2]
15- 25  8.391e-09   5.260e-09
25- 50  2.320e-08   1.422e-08
50-150  1.511e-08   1.120e-08
15-150  4.670e-08   2.881e-08
Thermal bremsstrahlung (OTTB)
Spectral model: thermal bremsstrahlung
------------------------------------------------------------
Parameters  : value         Lower 90%    Upper 90%
kT [keV]    : 199.363       (-199.363      -199.363)
Norm        : 4.05508       (-1.1808     1.92859)
------------------------------------------------------------
#Fit statistic : Chi-Squared =          67.81 using 59 PHA bins.
# Reduced chi-squared =          1.190 for     57 degrees of freedom
# Null hypothesis probability =   1.547336e-01

Energy  Fluence     90% Error
[keV]   [erg/cm2]   [erg/cm2]
15- 25  1.010e-08   6.180e-09
25- 50  1.942e-08   1.173e-08
50-150  4.260e-08   2.543e-08
15-150  7.212e-08   4.262e-08
Double BB
Spectral model: bbodyrad<1> + bbodyrad<2>
------------------------------------------------------------
Parameters  : value         Lower 90%    Upper 90%
kT1 [keV]   : 7.19052        (-2.50011      3.49884)
R1^2/D10^2  : 1.37451        (-1.10899      6.12369)
kT2 [keV]   : 65.3040        (-42.0494      -65.0499)
R2^2/D10^2  : 1.13660E-03    (-0.00105559   0.0149171)
------------------------------------------------------------
#Fit statistic : Chi-Squared =          64.63 using 59 PHA bins.
# Reduced chi-squared =          1.175 for     55 degrees of freedom
# Null hypothesis probability =   1.755345e-01

Energy  Fluence     90% Error
[keV]   [erg/cm2]   [erg/cm2]
15- 25  1.216e-08   7.355e-09
25- 50  2.016e-08   1.203e-08
50-150  5.288e-08   2.927e-08
15-150  8.520e-08   4.001e-08
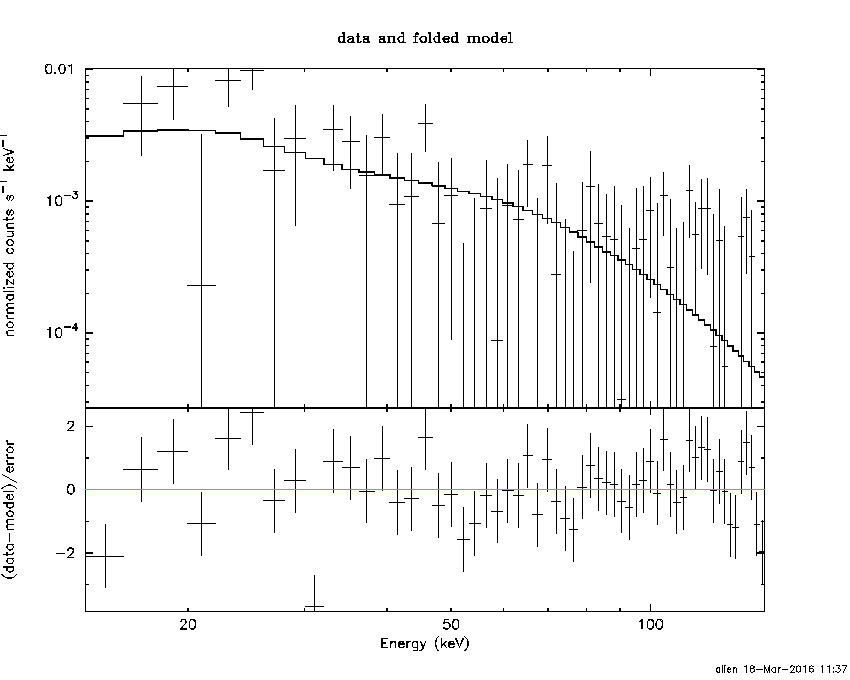
Pre-slew spectrum (Pre-slew PHA with pre-slew DRM)
Power-law model

Spectral model in power-law:
------------------------------------------------------------
Parameters  : value       lower 90%   higher 90%
Photon index: 1.51366     ( -0.245663   0.245003 )
Norm@50keV  : 5.96335E-03    ( -0.000793522   0.000789932 )
------------------------------------------------------------
#Fit statistic : Chi-Squared =          39.06 using 59 PHA bins.
# Reduced chi-squared =         0.6853 for     57 degrees of freedom
# Null hypothesis probability =   9.666305e-01

Photon flux (15-150 keV)    in 9.088 sec: 0.747229 ( -0.102897  0.103515 ) ph/cm2/s
Energy fluence (15-150 keV)             : 5.1299e-07 ( -7.35869e-08  7.43426e-08 ) ergs/cm2
Cutoff power-law model

Spectral model in the cutoff power-law:
------------------------------------------------------------
Parameters  : value       lower 90%   higher 90%
Photon index: 1.51176     ( -0.304391   0.245937 )
Epeak [keV] : 9999.20      ( -9999.36 -9999.36 )
Norm@50keV  : 5.98009E-03    ( -0.00443699   0.0067422 )
------------------------------------------------------------
#Fit statistic : Chi-Squared =          39.07 using 59 PHA bins.
# Reduced chi-squared =         0.6977 for     56 degrees of freedom
# Null hypothesis probability =   9.584005e-01

Photon flux (15-150 keV)    in 9.088 sec: 0.748514 ( -0.104094  0.101854 ) ph/cm2/s
Energy fluence (15-150 keV)             : 5.1186e-07 ( -7.34365e-08  7.44525e-08 ) ergs/cm2
Band function
Spectral model in the Band function:
------------------------------------------------------------
Parameters  : value       lower 90%   higher 90%
alpha       : 4.83603   ( -4.83603   -4.83603 )
beta        : -1.53730    ( -0.264863   0.255236 )
Epeak [keV] : 20.6217      ( -20.6217 9.84478 )
Norm@50keV   : 1551.36    ( -202.73   3.66025e+06 )
------------------------------------------------------------
#Fit statistic : Chi-Squared =          38.86 using 59 PHA bins.
# Reduced chi-squared =         0.7065 for     55 degrees of freedom
# Null hypothesis probability =   9.512120e-01

Photon flux (15-150 keV)    in 9.088 sec:  (    ) ph/cm2/s
Energy fluence (15-150 keV)             : 0 ( 0  0 ) ergs/cm2
S(25-50 keV) vs. S(50-100 keV) plot
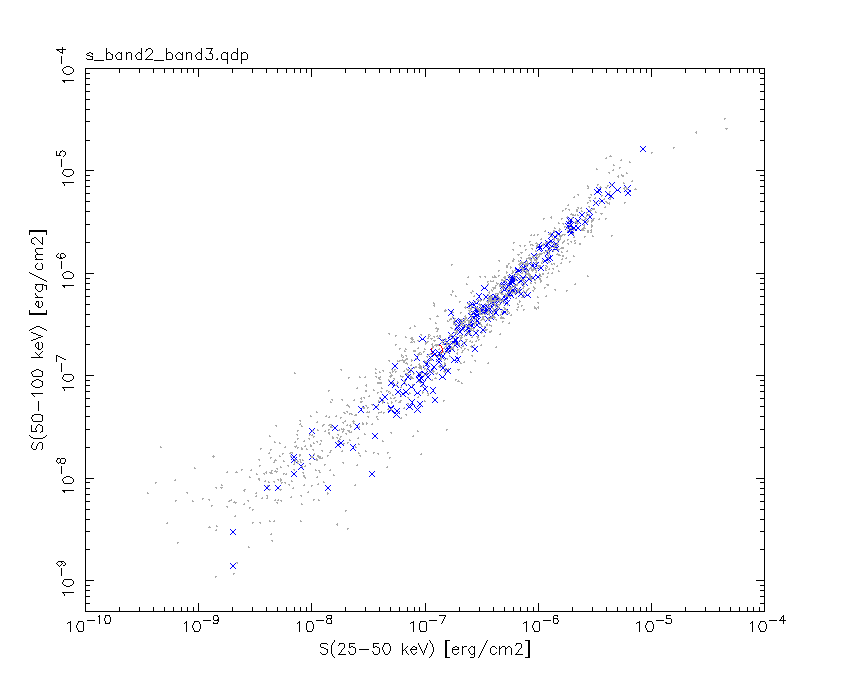
S(25-50 keV)  = 1.28e-07
S(50-100 keV) = 1.79e-07
T90 vs. Hardness ratio plot
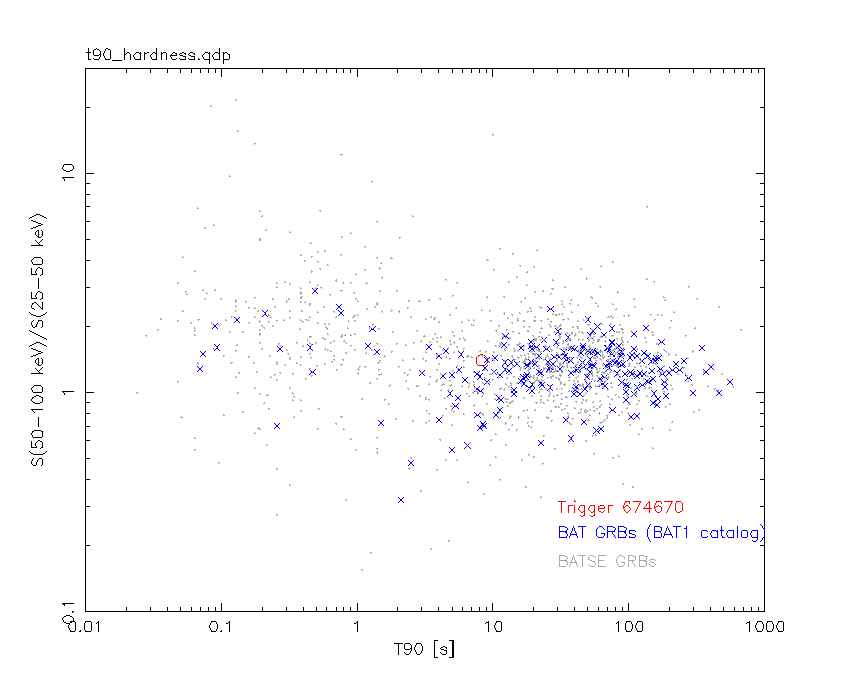
T90                                   = 8.25999993085861 sec.
Hardness ratio (energy fluence ratio) = 1.39844
Color vs. Color plot

Count Ratio  (25-50 keV) / (15-25 keV) = 1.27025
Count Ratio (50-100 keV) / (15-25 keV) = 0.901224
Mask shadow pattern

IMX = -8.782326275476202E-02, IMY = -5.423115040799718E-01
TIME vs. PHA plot around the trigger time
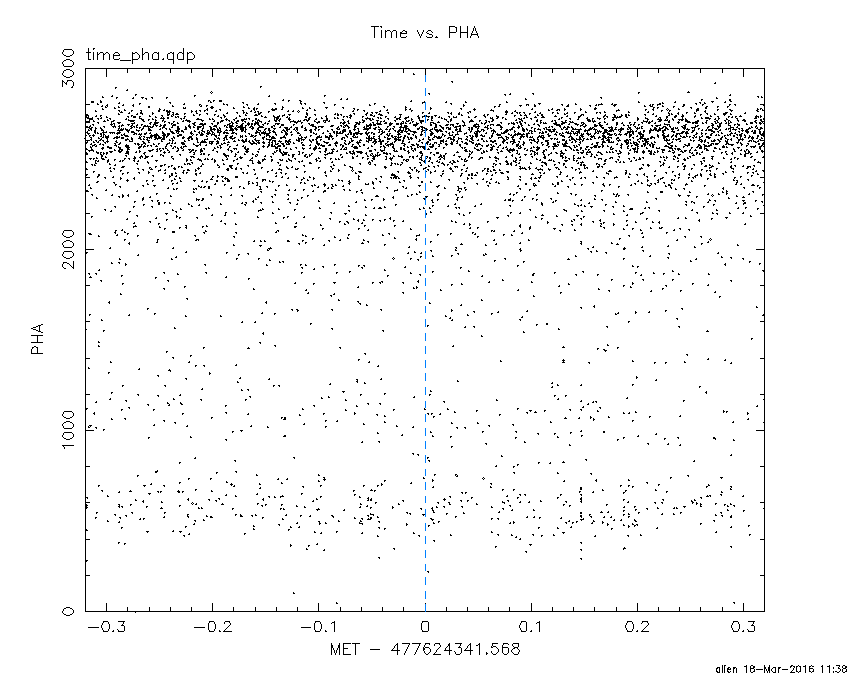
Blue+Cyan dotted lines: Time interval of the scaled map
From 0.000000 to 4.096000
TIME vs. DetID plot around the trigger time
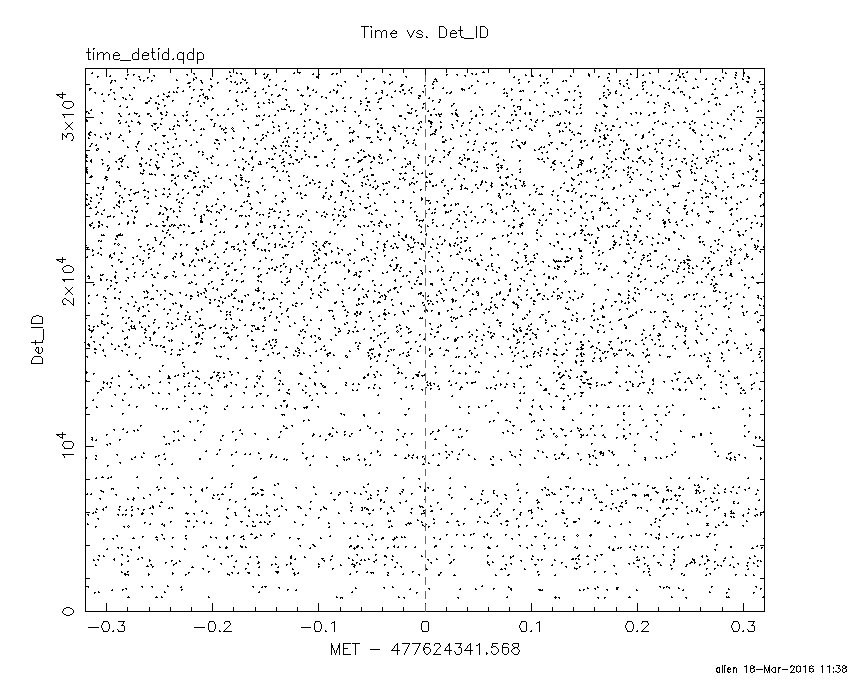
Blue+Cyan dotted lines: Time interval of the scaled map
From 0.000000 to 4.096000
100 us light curve (15-350 keV)
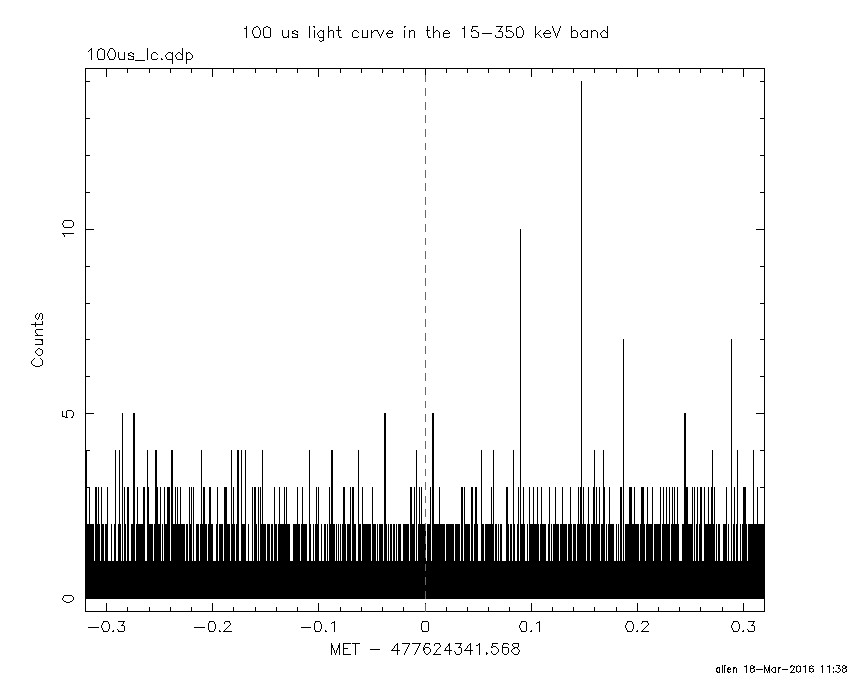
Blue+Cyan dotted lines: Time interval of the scaled map
From 0.000000 to 4.096000
Spacecraft aspect plot

Bright source in the pre-burst/pre-slew/post-slew images
Pre-burst image of 15-350 keV band
Time interval of the image:
-239.568000 -0.100000

# RAcent  DECcent POSerr Theta    Phi  PeakCts   SNR AngSep     Name
#  [deg]    [deg]    ['] [deg]  [deg]                   [']
244.9802 -15.6553    0.4  23.8  114.0  13.2696  32.3    0.9	Sco X-1
255.9618 -37.8429    0.7  12.4   36.2   3.7859  16.2    1.2	4U 1700-377
256.2400 -36.4584    4.3  11.3   40.6   0.6232   2.7    9.7	GX 349+2
262.8701 -24.6392    3.5   5.3  137.9   0.8510   3.3    9.9	GX 1+4
264.9022 -44.5647    3.8  15.6   -1.6   0.7820   3.1    9.7	4U 1735-44
268.2489  -1.2921    0.0  27.7  178.6   0.6395   2.3   12.0	SW J1753.5-0127
270.1298 -24.9197    0.0   5.3 -145.0   0.4106   1.6   12.7	GX 5-1
270.3586 -25.7773    8.1   4.8 -136.5   0.3629   1.4    3.7	GRS 1758-258
273.9695 -13.9452    4.2  16.6 -158.7   0.7414   2.8    5.9	GX 17+2
276.0984 -30.3965    5.7   8.6  -83.4   0.4889   2.0    9.2	H1820-303
284.9084 -24.7814    7.3  17.0 -105.3   0.4156   1.6   10.9	HT1900.1-2455
288.8143  10.9710    3.7  45.4 -153.7   1.5394   3.1    1.8	GRS 1915+105
263.1454 -34.0023    0.0   5.7   22.4   0.3236   1.3   12.7	GX 354-0
269.0673 -32.2622    3.0   4.0  -39.9   0.8470   3.8 ------	UNKNOWN
299.9739  15.8527    4.5  55.3 -145.1   4.1434   2.6 ------	UNKNOWN
300.2928  15.6489    3.9  55.4 -144.7   4.8967   3.0 ------	UNKNOWN
Pre-slew background subtracted image of 15-350 keV band
Time interval of the image:
-0.100000 8.988000

# RAcent  DECcent POSerr Theta    Phi  PeakCts   SNR AngSep     Name
#  [deg]    [deg]    ['] [deg]  [deg]                   [']
244.9954 -15.7859    4.7  23.7  113.8   0.1257   2.5    8.8	Sco X-1
255.7687 -37.9599    0.0  12.6   36.3   0.0601   1.7   12.4	4U 1700-377
256.6490 -36.3057    0.0  11.0   40.1   0.0766   2.1   12.5	GX 349+2
263.0871 -24.9048    4.6   5.0  138.0   0.0818   2.5   10.5	GX 1+4
264.9221 -44.6064    5.6  15.7   -1.6   0.0695   2.1   12.1	4U 1735-44
268.4304  -1.3748    3.5  27.7  179.0  -0.1336  -3.3    6.0	SW J1753.5-0127
270.2974 -24.9299   19.1   5.3 -143.6   0.0207   0.6    9.0	GX 5-1
270.4657 -25.7921    7.3   4.8 -135.6  -0.0540  -1.6    9.3	GRS 1758-258
273.9743 -14.1434  659.7  16.4 -158.4   0.0006   0.0    6.7	GX 17+2
275.9941 -30.2193    7.4   8.5  -84.6   0.0532   1.6    9.6	H1820-303
285.0487 -24.7761    3.5  17.2 -105.2  -0.1096  -3.3    8.7	HT1900.1-2455
288.8047  10.9352    8.5  45.4 -153.7  -0.0767  -1.4    0.7	GRS 1915+105
262.7887 -33.9610    6.1   5.9   25.1   0.0659   1.9   12.5	GX 354-0
236.9405 -18.5424    0.9  28.8   99.2   0.8935  13.6 ------	UNKNOWN
221.3425 -77.5579    2.3  52.7    5.6   0.6881   4.9 ------	UNKNOWN
282.4116  -3.7667    2.2  29.4 -151.3   0.1988   5.2 ------	UNKNOWN
Post-slew image of 15-350 keV band
Time interval of the image:
371.132600 962.472000

# RAcent  DECcent POSerr Theta    Phi  PeakCts   SNR AngSep     Name
#  [deg]    [deg]    ['] [deg]  [deg]                   [']
299.5984  35.1966    0.4  48.7  -28.1  26.3587  30.5    0.5	Cyg X-1
308.1118  40.9924    1.9  40.2  -31.5   3.4405   5.9    2.4	Cyg X-3
325.9562  38.4553    0.0  34.9  -52.8   0.6626   1.1   12.9	Cyg X-2
 44.7622  66.5500    3.5  16.0  129.9   1.3904   3.3 ------	UNKNOWN
 61.1975  23.4103    3.5  54.1  177.1   5.3771   3.3 ------	UNKNOWN
 31.2410  11.8026    5.3  55.3 -145.1   7.5355   2.4 ------	UNKNOWN
 30.9579  11.7329    4.8  55.3 -144.7   9.1539   2.9 ------	UNKNOWN
Plot creation:
Fri Mar 18 11:38:44 EDT 2016